0850
Simultaneous R2* and Quantitative Susceptibility Mapping of Trabecularized Yellow Bone Marrow: Initial Results in the Calcaneus1Department of Diagnostic and Interventional Radiology, Technical University of Munich, Munich, Germany, 2Philips Research Laboratory, Hamburg, Germany, 3Department of Orthopedics and Sport Orthopedics, Technical University of Munich, Munich, Germany, 4Section of Neuroradiology, Technical University of Munich, Munich, Germany, 5Philips Healthcare, Hamburg, Germany
Synopsis
R2* mapping has been previously used to measure trabecular bone density by quantifying the magnetic field inhomogeneity effects induced by the susceptibility difference between trabecular bone and marrow. Quantitative susceptibility mapping (QSM) has been emerging in other body parts for measuring the field-independent magnetic susceptibility. Trabecular bone is in many locations embedded in yellow fatty marrow. Therefore, trabecular bone QSM requires to account for the presence of fat. The purpose of the present work is to develop a methodology for simultaneous R2* mapping and QSM of trabecularized yellow bone marrow and apply the technique in the calcaneus of healthy volunteers.
Introduction
Trabecular bone imaging is clinically highly significant in diagnosing bone loss and predicting fracture risk in patients with osteoporosis1. $$$R_2^{*}$$$ has been previously used to measure trabecular bone density by probing the magnetic field inhomogeneities effects induced by the susceptibility difference between bone and water or fat in bone marrow1. Bone marrow $$$R_2^{* }$$$-mapping is known to be affected by the tissue $$$T_2$$$ relaxation time2 and the field strength3. Quantitative susceptibility mapping (QSM) has been emerging as a technique to measure the field-independent magnetic susceptibility4. However, there are only a few reports applying QSM for mapping the susceptibility of bone regions5-7. Trabecular bone is in many skeletal sites embedded in yellow fatty marrow. Therefore, QSM of trabecular bone requires to account for the presence of fat in the field map estimation. The purpose of the present work is to develop a methodology for simultaneous $$$R_2^{*}$$$-mapping and QSM of trabecularized yellow bone marrow and apply the technique in the calcaneus of healthy volunteers.Methods
MRI measurements
The right ankle of five healthy volunteers was sagitally scanned at a $$$3 T$$$ system (Ingenia, Philips Healthcare) with an 8-channel ankle coil. A time-interleaved gradient echo (TIMGRE) sequence8 with monopolar readout gradients was used to map $$$R_2^{*}$$$ and susceptibility. A high-resolution balanced steady-state free precession sequence (bSSFP) was used to measure apparent ratio of bone volume to total volume (BV/TV) . Imaging parameters are listed in the table in Figure 2.
$$$R_2^{*}$$$ mapping and QSM processing
Figure 1 depicts the performed steps in a flowchart. Water–fat separation was performed using a complex-based water–fat separation with a multi-peak fat spectrum and a single $$$T_2^{*}$$$ correction9, resulting in fat fraction, field map and $$$R_2^{* }$$$-maps. The local field was extracted from the field mapping result with the Laplacian boundary value method (LBV)10 from the MEDI toolbox11. Susceptibility maps $$$\chi$$$ were computed by optimizing the $$$\ell_1$$$-regularized MEDI cost function12:
$$\chi = \underset{\chi'}{argmin}{\lvert\lvert W (F^{\dagger} D F \chi' - f_L) \rvert\rvert_2^2} + \lambda \lvert\lvert M \nabla \chi'\rvert\rvert_{\ell_1},$$
with $$$W$$$ the data weighting, $$$F$$$ Fourier transformation, $$$D$$$ the dipole kernel in $$$k$$$-space, and $$$f_L$$$ the local field4. An iterative solution was obtained by applying Nesterov's algorithm (NESTA)13. The gradient weighting $$$M$$$ was obtained by thresholding the absolute value of the forward gradient on the opposed phase image $$$\lvert W - F \rvert$$$ such that 40% of the voxels in the tissue region belong to edges and are weighted by a value of 0.01, whereas all other voxels in $$$M$$$ were set to 1.
ROI analysis
Three ROI's inside the calcaneus were drawn in the low-resolution magnitude images of each subject where the calcaneus is known to have different BV/TV. These ROI's, depicted in Figure 2 are the: (A) the subtalar, (B) cavum calcanei, (C) tuber calcanei3. The ROI masks were then applied to the susceptibility maps and mean susceptibility values were computed without any referencing. ROI's at approximately the same locations where drawn in the high-resolution bSSFP images to obtain a measure of an apparent BV/TV, which was computed as one minus the mean high-resolution magnitude scaled to the interval $$$[0, 1]$$$ and shifted by $$$-0.4$$$.
Results
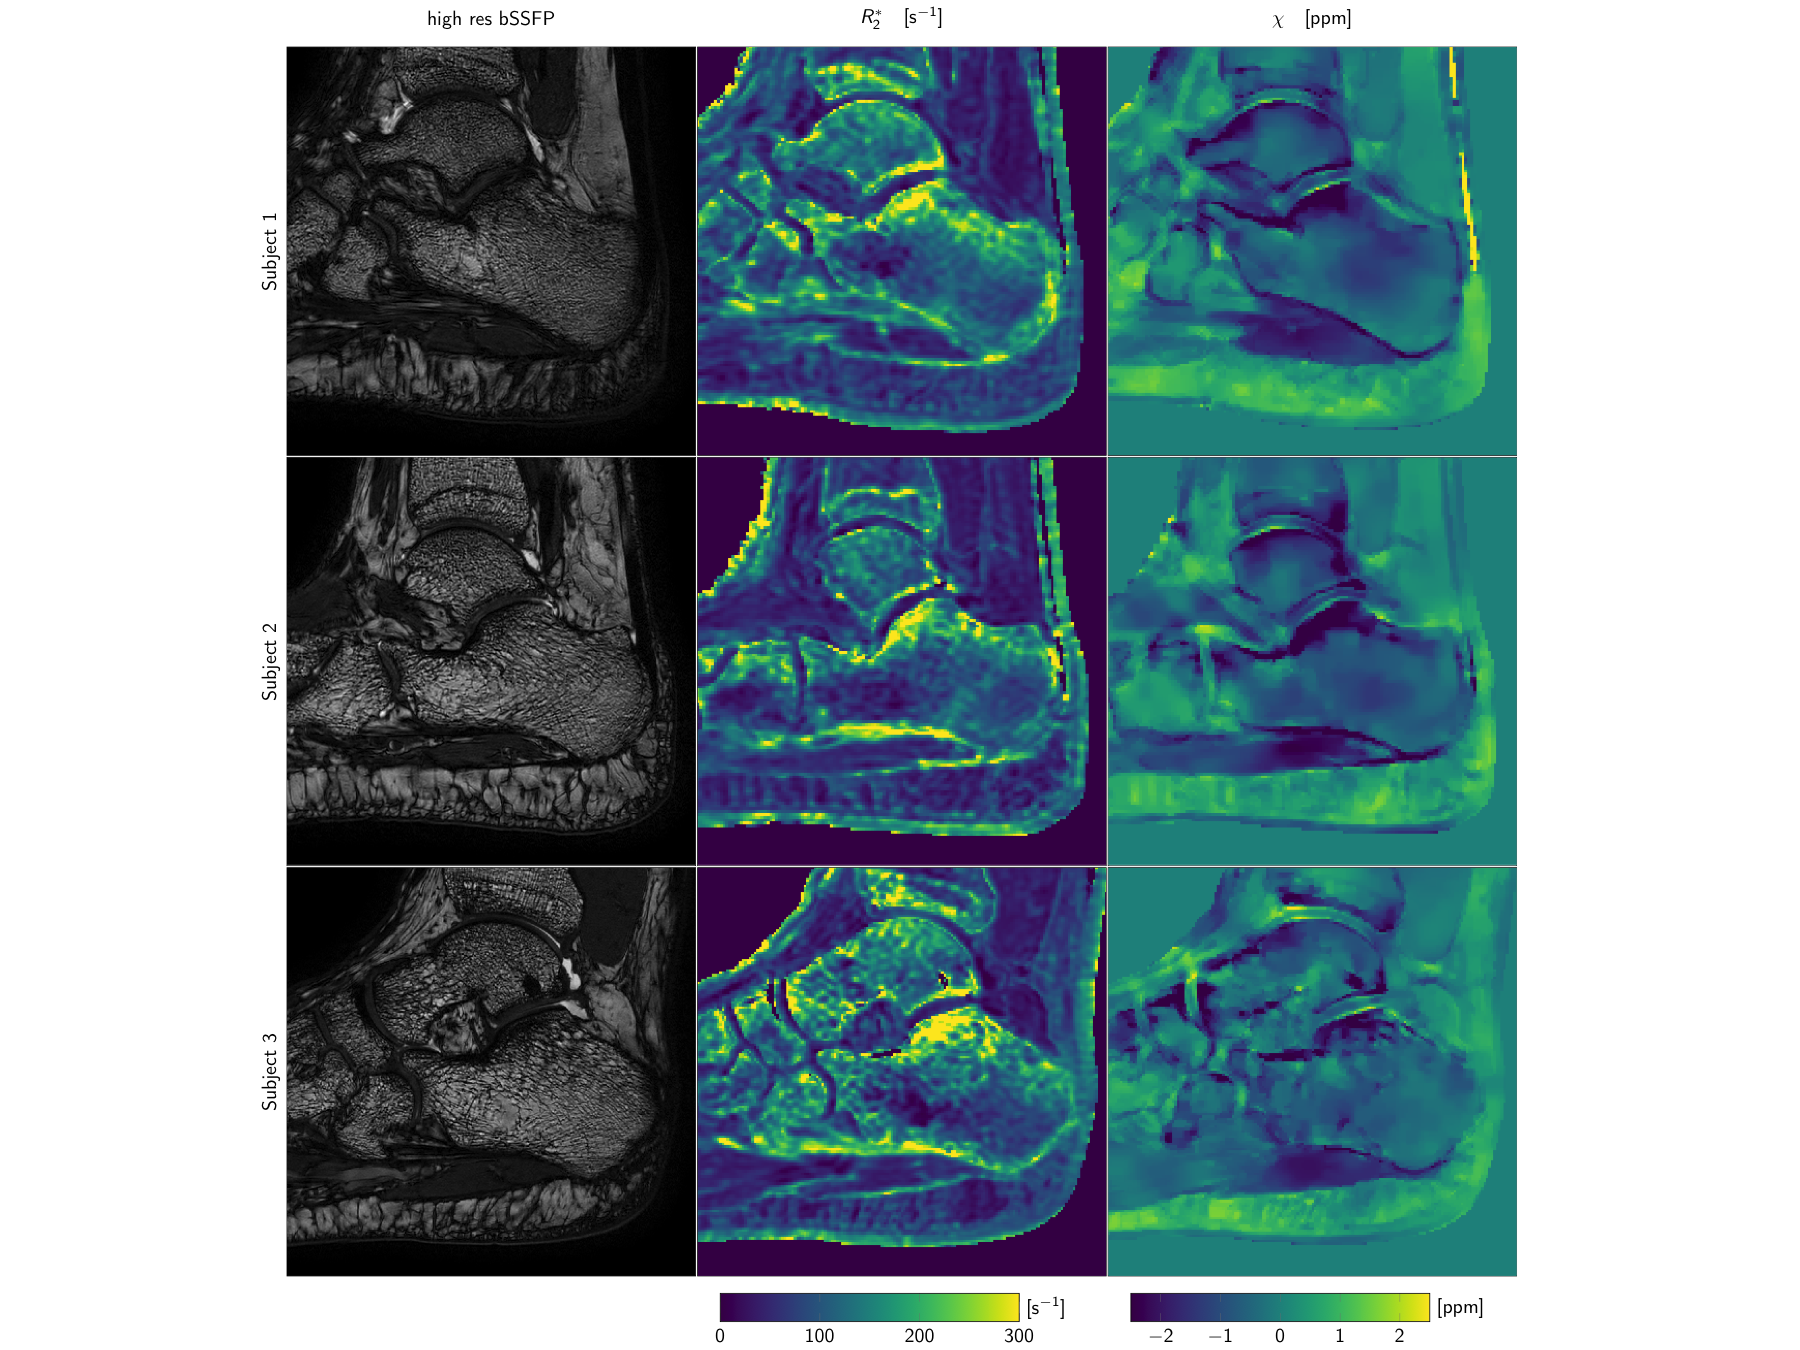
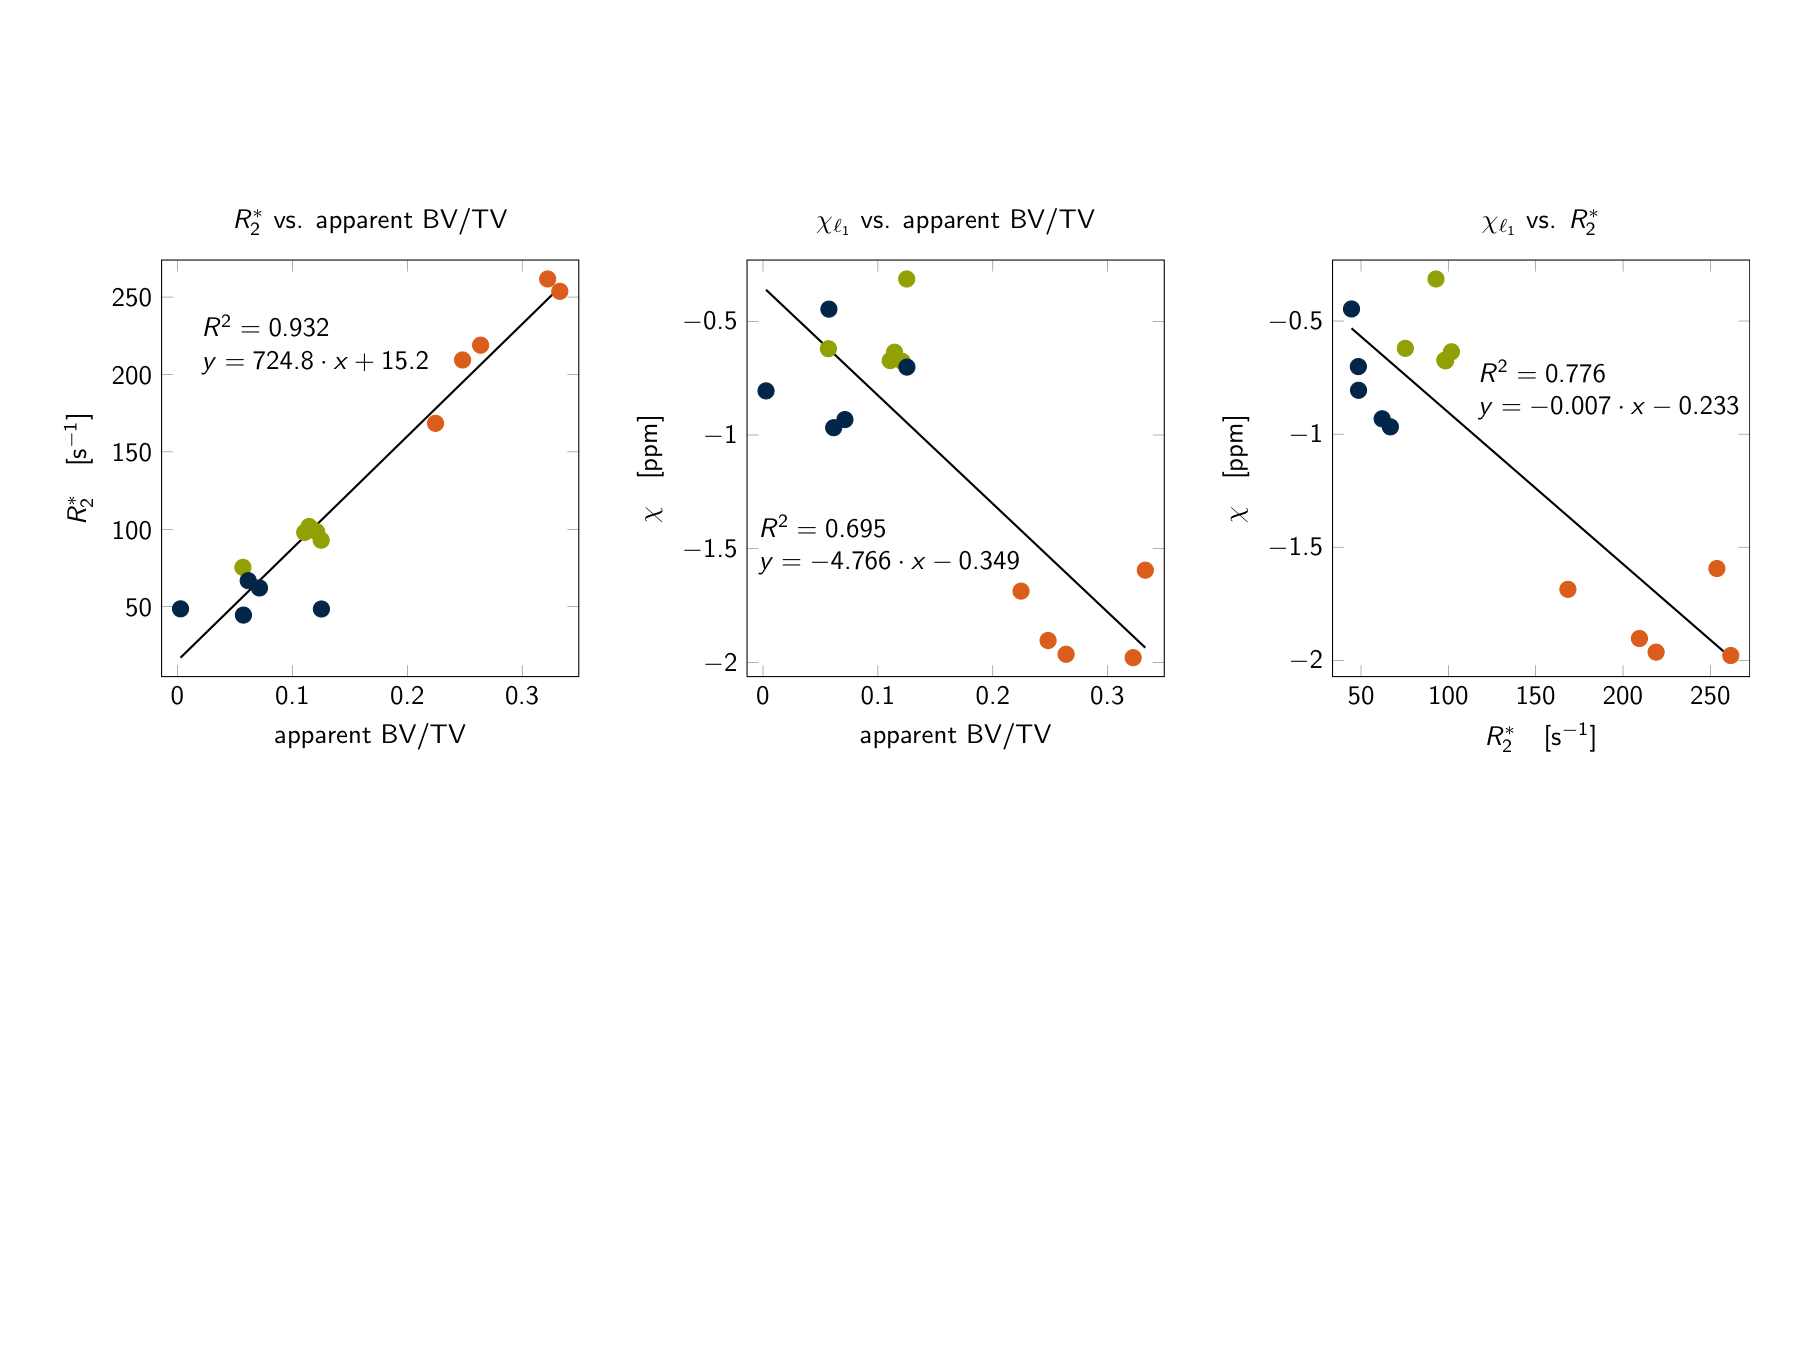
Typical high-resolution bSSFP images, $$$R_2^{*}$$$-maps and susceptibility maps ($$$\chi$$$) are shown in Figure 3. Higher $$$R_2^{*}$$$ values and lower $$$\chi$$$ values were found in the subtalar region compared to two other calcaneus regions, in agreement with the highest apparent BV/TV measured in the subtalar region (Figure 3). $$$R_2^{*}$$$ showed a positive correlation with apparent BV/TV ($$$R^2=0.932$$$ Figure 4). $$$\chi$$$ showed a negative correlation with apparent BV/TV ($$$R^2=0.776$$$ Figure 4) and $$$R_2^{*}$$$ ($$$R^2=0.695$$$ Figure 4).Discussion and Conclusion
The present work demonstrated a methodological framework to simultaneously measure $$$R_2^{* }$$$ and susceptibility in trabecularized yellow bone marrow while addressing the presence of fat. The presented preliminary results showed a correlation between the extracted susceptibility and the apparent BV/TV and between the extracted susceptibility and $$$R_2^{* }$$$. QSM results showed the most diamagnetic values for marrow susceptibility in the subtalar region of the calcaneus and less diamagnetic values in the cavum and tuber calcanei regions, in agreement with the the anatomically-known trabecular density variation within the calcaneus3. However, QSM could not correctly asses susceptibility differences between cavum and tuber calcanei where BV/TV differences are smaller. Edge information used in the dipole inversion gradient weighting was difficult to obtain in these regions. Therefore, further work is necessary in order to investigate whether bone marrow QSM can probe in vivo trabecular density changes induced by pathological bone loss or osteoporosis.Acknowledgements
The present work was supported by Philips Healthcare and the European Research Council (grant agreement No. 677661, ProFatMRI).References
1. Wehrli FW, Song HK, Saha PK, et al. Quantitative MRI for the assessment of bone structure and function. NMR Biomed. 2006;19:731-764
2. Wehrli FW, Hopkins JA, Hwang SN, et al. Cross-sectional study of osteopenia with quantitative MR imaging and bone densitometry. Radiology. 2000;217:527-538
3. Song HK, Wehrli FW, Ma J. Field strength and angle dependence of trabecular bone marrow transverse relaxation in the calcaneus. J Magn Reson Imaging. 1997;7:382-388.
4. Wang Y, Liu T. Quantitative susceptibility mapping (QSM): decoding MRI data for a tissue magnetic biomarker. Magn Reson Med. 2014;73:82-101.
5. Dimov AV, Liu Z, Spincemaille P, et al. Quantitative susceptibility mapping of bone using ultra-short TE sequence. Proc. Int. Soc. Magn. Reson. Med 2015. p. 938.
6. Dimov AV, Liu Z, Spincemaille P, et al. Bone Quantitative susceptibility mapping using tissue specific R2* and multi-peak fat spectrum to model ultra-short TE gradient echo signal. Proc. Int. Soc. Magn. Reson. Med 2016. p. 363.
7. Diefenbach MN, Van AT, Meineke J, et al. On the feasibility of quantitative susceptibility mapping for trabecular bone volume density mapping at 3 T. Proc. Int. Soc. Magn. Reson. Med 2016. p. 677.
8. Ruschke S, Eggers H, Kooijman H, et al. Correction of phase errors in quantitative water-fat imaging using a monopolar time-interleaved multi-echo gradient echo sequence. Magn Reson Med 2016. doi: 10.1002/mrm.26485.
9. Yu H, Shimakawa A, McKenzie C, et al. Multiecho water-fat separation and simultaneous R2* estimation with multifrequency fat spectrum modeling. Magn Reson Med 2008;60:1122—1134.
10. Zhou D, Liu T, Spincemaille P, et al. Background field removal by solving the Laplacian boundary value problem, NMR Biomed 2014;27:312-319.
11. MEDI Toolbox Cornell MRI Research Lab. 2016. http://www.weill.cornell.edu/mri/pages/qsm.html.
12. Liu T, Liu J, de Rochefort L, et al. Morphology enabled dipole inversion (MEDI) from a single-angle acquisition: comparison with COSMOS in human brain imaging. Magn Reson. Med. 2011;66:777-783.
13. Becker S. Bobin J, Candes E, et al. NESTA:a fast and accurate first-order method for sparse recovery. SIAM J Imaging Sci. 2011;4:1-39.
Figures
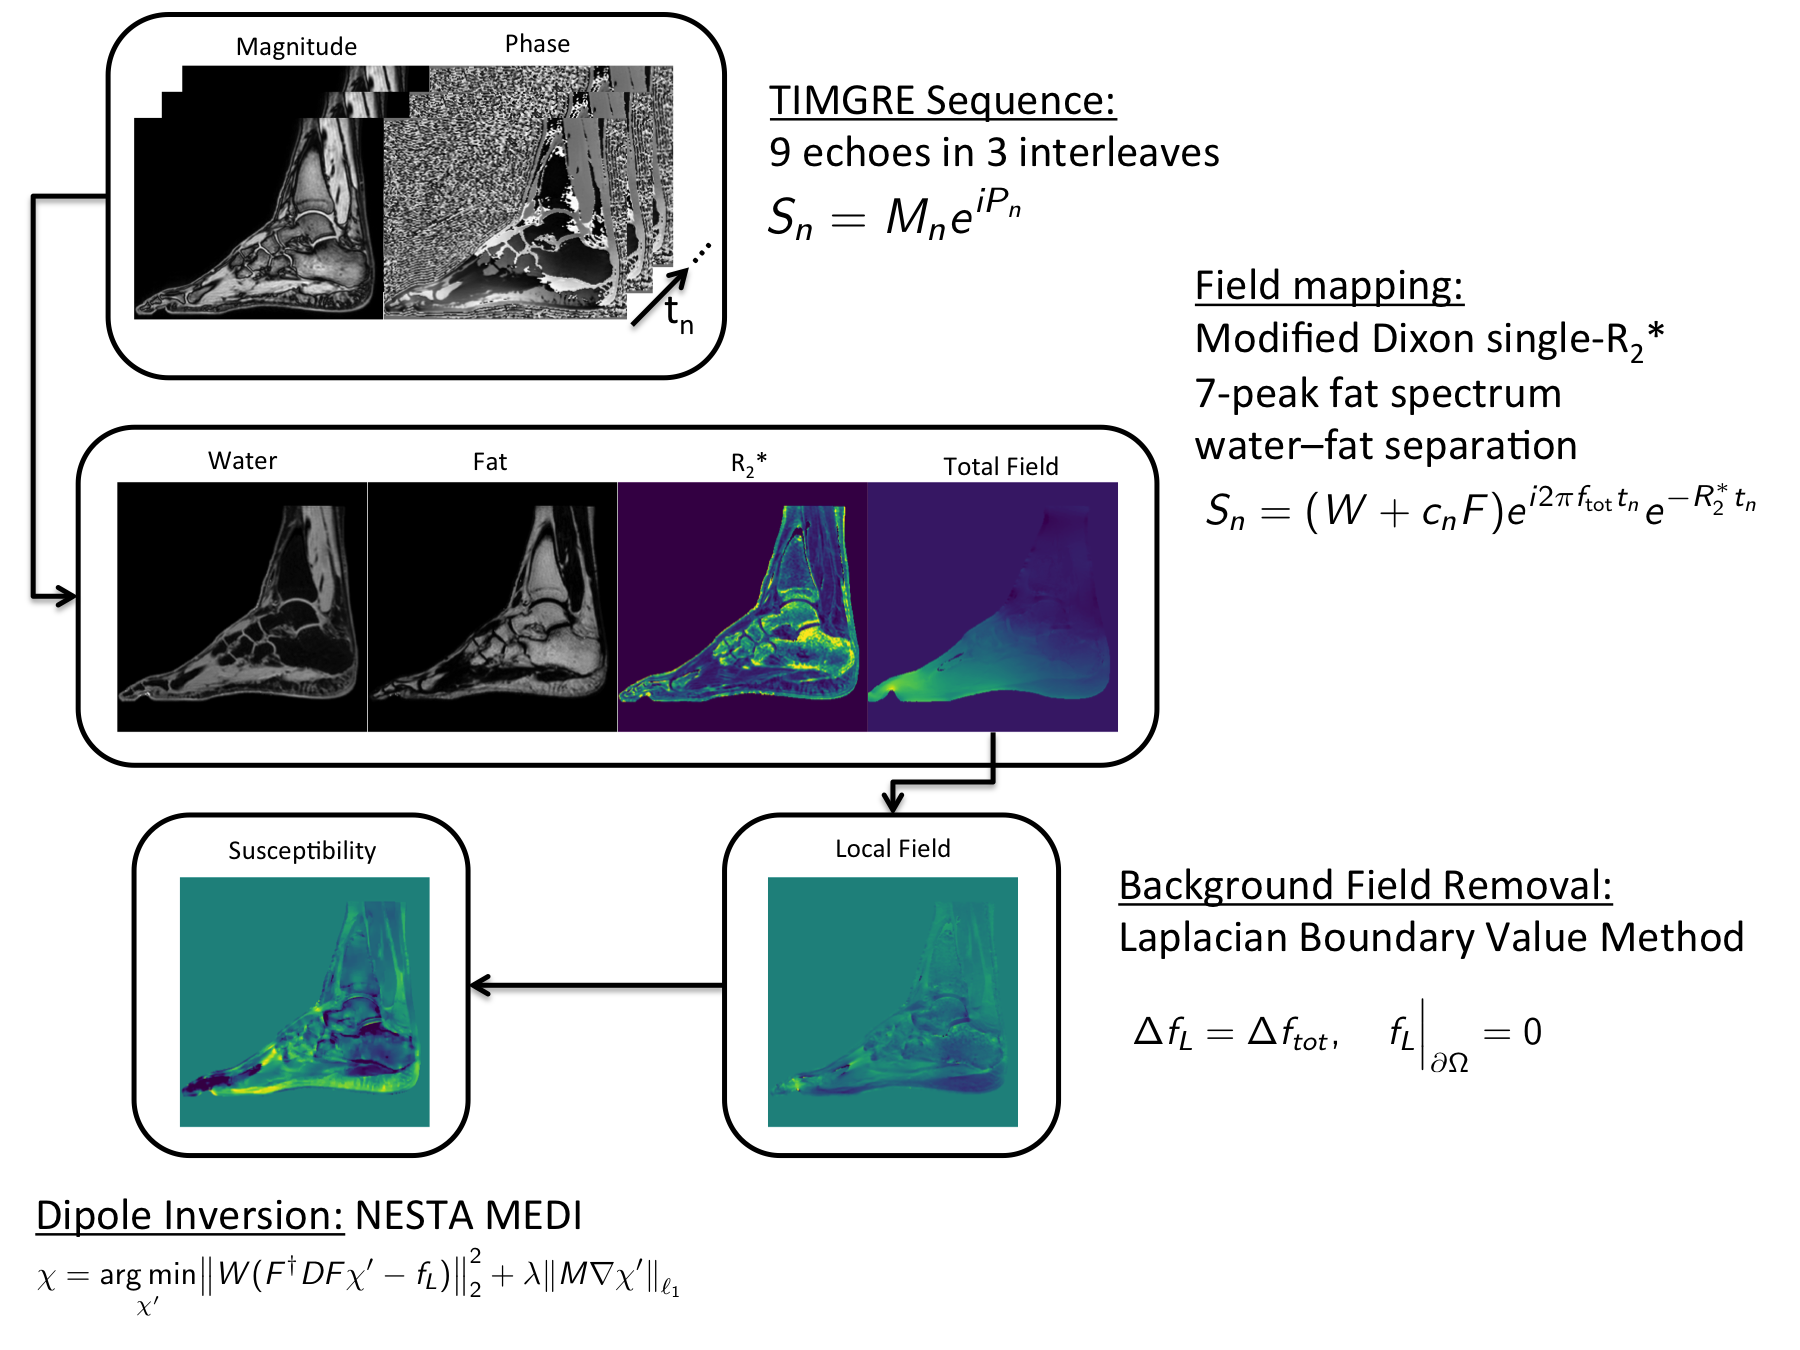
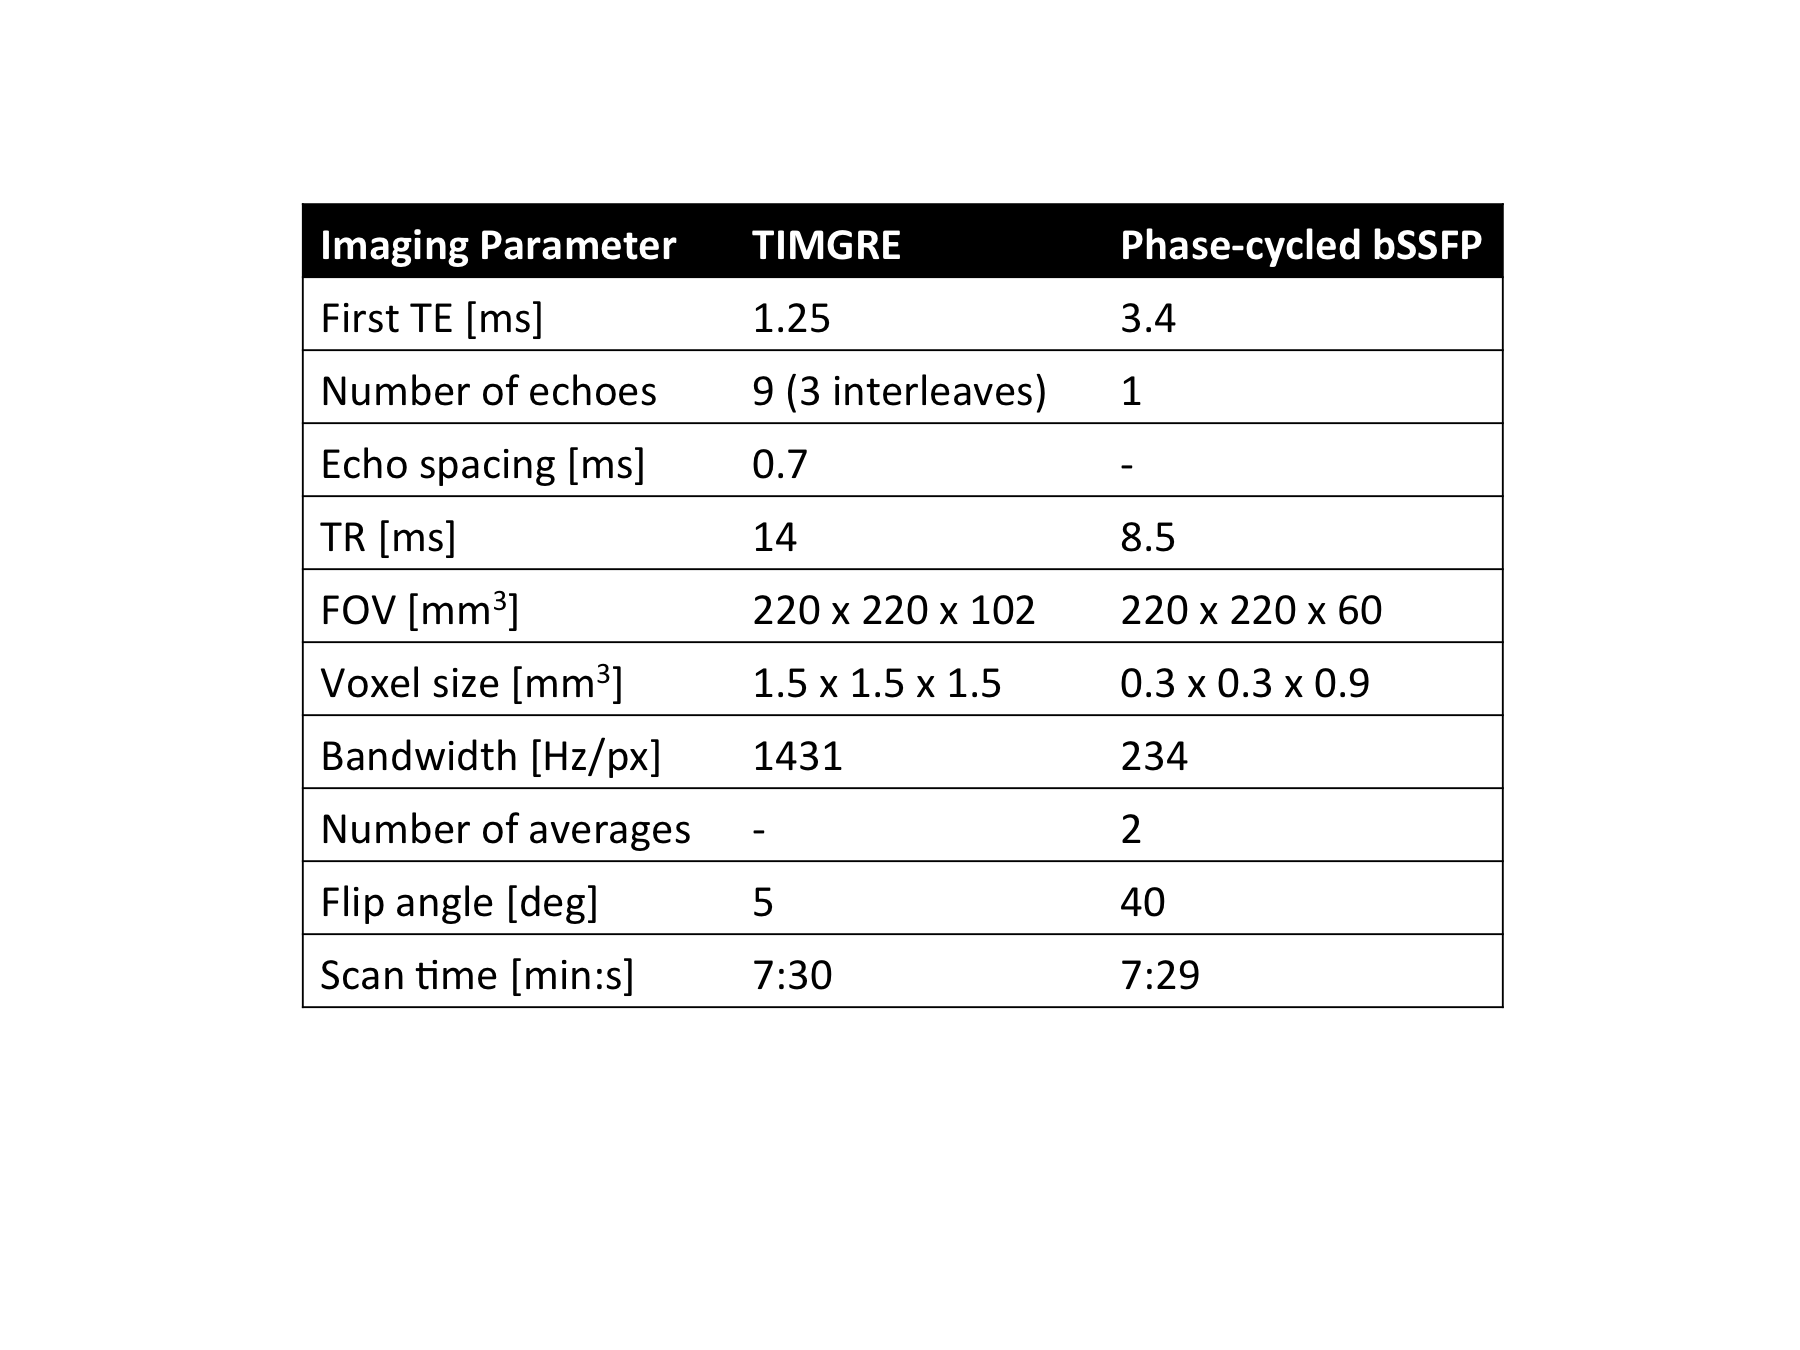

Figure 3: Magnitude images: (left) high-resolution balanced steady-state free precession (bSSFP) image used to estimate the apparent bone volume to total volume ratio (BV/TV), (right) lower-resolution time-interleaved gradient echo (TIMGRE), first echo magnitude image with the three ROI's: (A) subtalar, (B) cavum calcanei, (C) tuber calcanei