0848
Study Of The Associations Between [18F]-NaF PET Bone Remodeling, MRI Trabecular Bone Structure and Patient Reported Outcomes in subjects with OsteoarthritisValentina Pedoia1, Rohit Curucundhi1, Dragana Savic2, Misung Han1, Youngho Seo1, Matthew D. Bucknor1, Benjamin L. Franc1, and Sharmila Majumdar1
1Radiology and Biomedical Imaging, University Of California, San Francisco, San Francisco, CA, United States, 2Department of Physiology, Anatomy and Genetics, University of Oxford
Synopsis
In Osteoarthritis (OA) degeneration of articular cartilage, are accompanied by changes in subchondral and trabecular bone. In this study we analyzed bone structure, cartilage degeneration and bone remodeling, quantified using simultaneous PET/MRI system in fourteen subjects with radiographic or symptomatic OA. The aim of this study was to evaluate these imaging biomarkers in association with patient reported outcomes for evaluating this technique as a tool for assessing OA. Our results showed associations between Standardized Uptake Values (SUV) and both level of pain measured by KOOS and cartilage degeneration measured using T1ρ and T2 relaxation times.
Introduction
Osteoarthritis (OA) is a whole joint disease in which degeneration of articular cartilage, are accompanied by changes in subchondral and trabecular bone. The changes in bone structure occur over longer time periods, but are mediated by faster processes of bone remodeling1,2. The aim of this study was to analyze bone structure, and cartilage degeneration with bone remodeling and functional changes that may potentially be markers of early OA. Using state of the art simultaneous Time-of-flight (TOF) Positron Emission Tomography/Magnetic Resonance (PET/MR) imaging, the goal was to evaluate the association between quantitative PET/MR biomarkers with patient reported outcomes (PROMs), an important step in the validation of this technique as a tool for assessing OA.Methods
Fourteen subjects with radiographic or symptomatic OA were recruited for this study (age 57.79±8.58 years, BMI 25.147±4.26 Kg/m3, 10 males, 12(85.8%) Kellgren-Lawrence (KL) 0-1, 2(14.2%) Kellgren-Lawrence (KL) 2-4). Patients reported outcome was measured with KOOS3 and WOMAC4. Using an intravenous catheter, patients were placed feet first into a 3T TOF PET-MR scanner (GE Healthcare, Waukesha, WI). Patients were then injected with an average of 340.4 Mbq [18F]-NaF through an intravenous catheter at the onset of scan. A dynamic PET scan was acquired the first 60 minutes and a static 10 min scan was acquired at 90 minutes after the initial time of injection, while a simultaneous MR scan was conducted. For PET analysis bone regions were manually segmented using circular ROIs in PMOD (PMOD technologies Ltd, Zurich). Average and maximum Standardized Uptake Values (SUV) were computed for 60 and 90 min data Figure 1 shows the SUV at 60 minute computed from one of the subjects. Dynamic PET data Ki defined as the slope of the Patlak plot was derived from the assessment of the 60 min PET data using a linear Patlak graphical analysis method. The MRI imaging protocol included simultaneous T1ρ/T2 MAPSS5 for cartilage compositional assessment and variable flip angle 3D fast spin-echo6 (3DVFA-FSE: pixel-spacing 0.19mm, slice-thickness 0.5mm TR/TE = 400/9.9ms, ETL=8) used for the trabecular structure quantification. Trabecular number: Tb.N and trabecular volume BV/TV were obtained within manually segmented ROIs (Figure 2). Fuzzy-C means clustering was used to segment the ROI into bone and marrow7. Pearson partial correlation adjusted for age, gender and BMI were used to study the associations between bone remodeling, trabecular bone structure data and PROMs. Voxel-based relaxometry (VBR)8 for T1ρ and T2 was then used to study cartilage biochemical composition.Results
Figure 3 shows the overall correlation matrix computed on the 3 data domains considered (PET, Tb and PROMs). SUVavg60 showed moderate correlations between different compartments (average R = 0.31), generally much stronger was the inter-compartmental correlations when the SUVavg90 was considered, with stronger correlation observed between adjacent compartments (SUVavg60.MT vs SUVavg60.MF R=0.90). Inter-compartmental SUVavg90 correlation was much weaker when the patella compartment was considered (average R=0.35). This lack of correlation between patella and other compartments was also observed in the analysis SUVmax60 and SUVmax90. Generally positive association was observed between SUVavg and Ki values (average R=0.35) showing similar behavior for 60 and 90 min data. Moderate negative correlation was observed between the SUVavg60 in femoral trochlea compartment and trabecular bone structure (Tb.N average R=-0.46, BV/TV average R=-0.26). This relationship was stronger for the SUVmax90 (Tb.N average R=-0.85, BV/TV average R=-0.81). Trabecular bone data did not demonstrate direct association with PROMs. However, SUVavg60 in patella showed a negative association with all the KOOS and WOMAC sub-scores with strongest correlation observed with KOOS pain (R=-0.49). In addition to the association with PROMs SUVavg60 in patella was observed to be positively associated with cartilage T1ρ especially in trochlea and medial tibia (Figure 4).Discussion and Conclusions
In this study correlations were seen between bone trabecular structure measured with MRI and bone remodelling, as well as a relationship between [18F]-NaF PET uptake and patient reported outcomes. Our results showed stronger inter-compartmental association in SUVavg90 then SUVavg60 , suggesting that by 90 minutes the local differences are no longer visible as the uptake has equilibrated. While strong associations were observed between trabecular bone data and bone uptake (SUV), the association observed with Ki was weak. SUVavg60 was observed to be associated with the level of pain measured by KOOS, speculatively this may indicate that bone remodelling and blood flow may be markers for pain, and also associated cartilage matrix degeneration as indicated by the correlations with T1ρ. These results demonstrate the potential of [18F]-NaF PET-MR to extract quantitative imaging biomarkers potentially useful in studying osteoarthritis and relating imaging findings with patient outcomes.Acknowledgements
NIH-P50AR060752 and GE Healthcare.References
[1] E. Radin, R. Rose, Role of subchondral bone in the initiation and progression of cartilage damage. Cinical orthopedics and Related research 213, 34 (1986). [2] D. B. Burr, M. A. Gallant, Bone remodelling in osteoarthritis. Nature reviews. Rheumatology 8, 665 (Nov, 2012). [3] Roos, E.M., Roos, H.P., Lohmander, L.S., Ekdahl, C. & Beynnon, B.D. Knee Injury and Osteoarthritis Outcome Score (KOOS)--development of a self-administered outcome measure. The Journal of orthopaedic and sports physical therapy 28, 88-96 (1998). [4] Ackerman, I. Western Ontario and McMaster Universities Osteoarthritis Index (WOMAC). The Australian journal of physiotherapy 55, 213 (2009).Figures
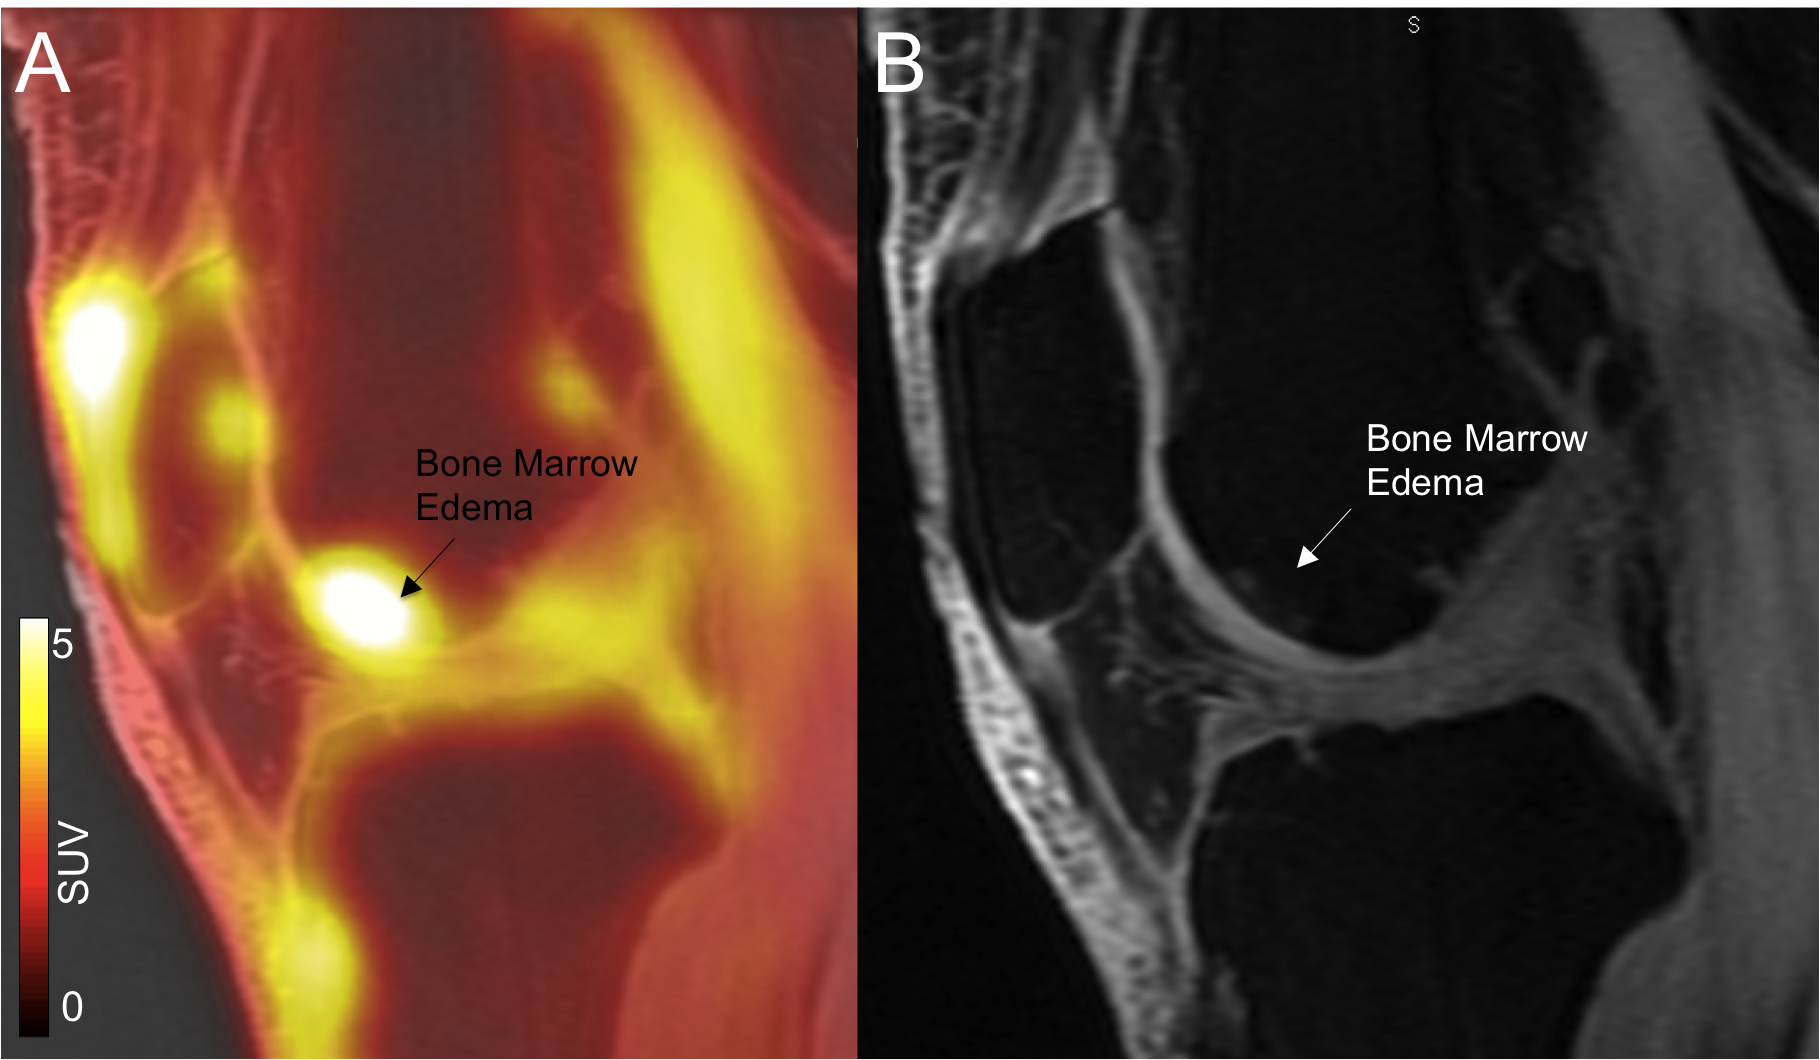
Figure 1: SUV in bone marrow edema. Example of one subject that showed higher PET uptake in the region of bone marrow edema A) SUV overall on T1ρ-wighted image (TSL=0). B) T1ρ -wighted image (TSL=0).
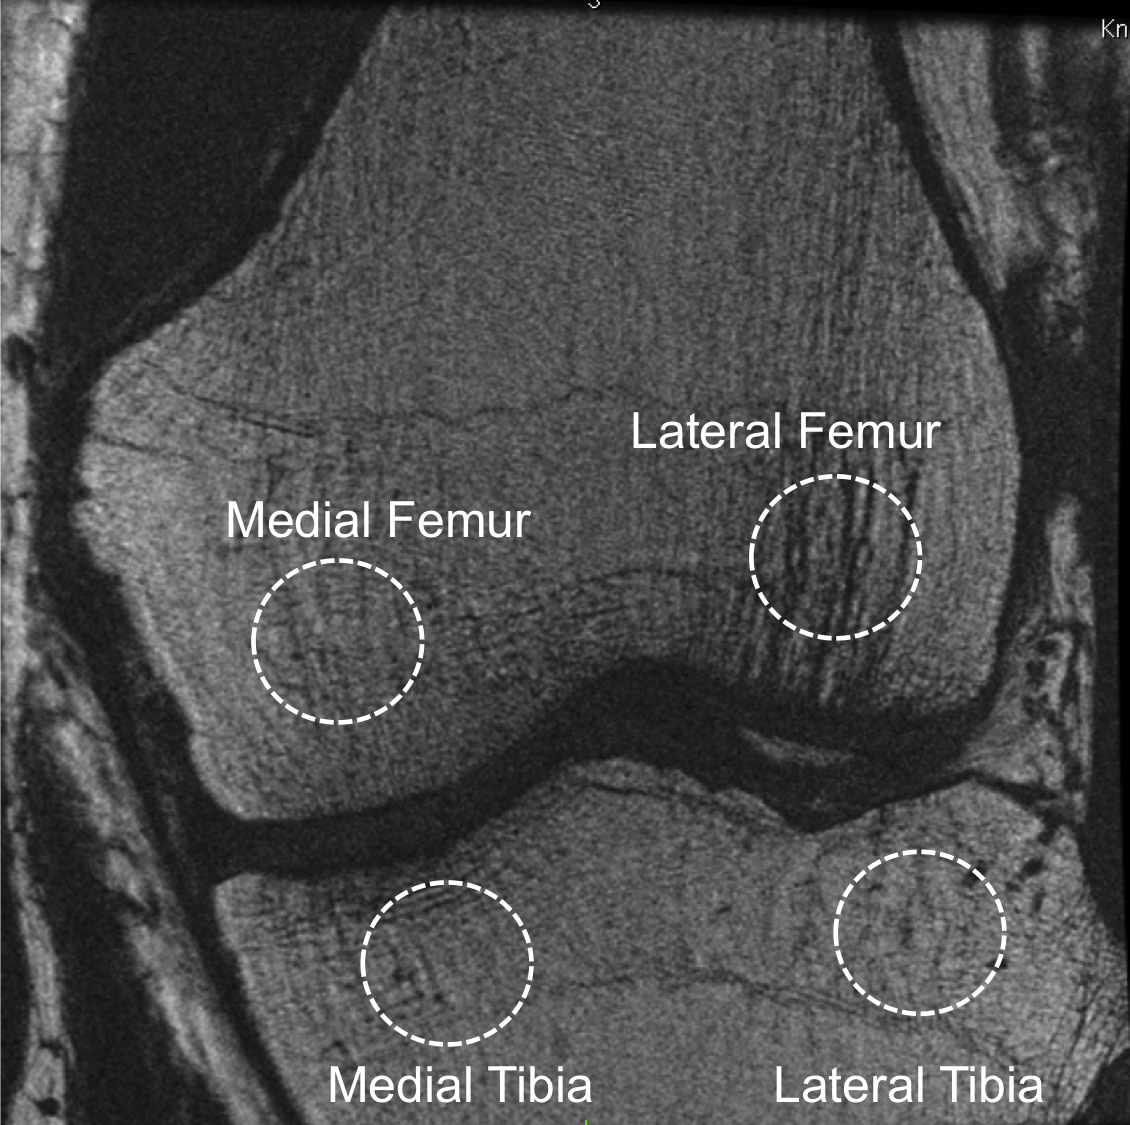
Figure 2: Trabecular bone structure data analysis. Variable flip angle 3D fast spin-echo4 (3D VFA-FSE: pixel-spacing 0.19mm, slice-thickness 0.5mm TR/TE = 400/9.9ms, ETL=8) used for the trabecular structure quantification. The figure shows and example of manually identified regions of interest.
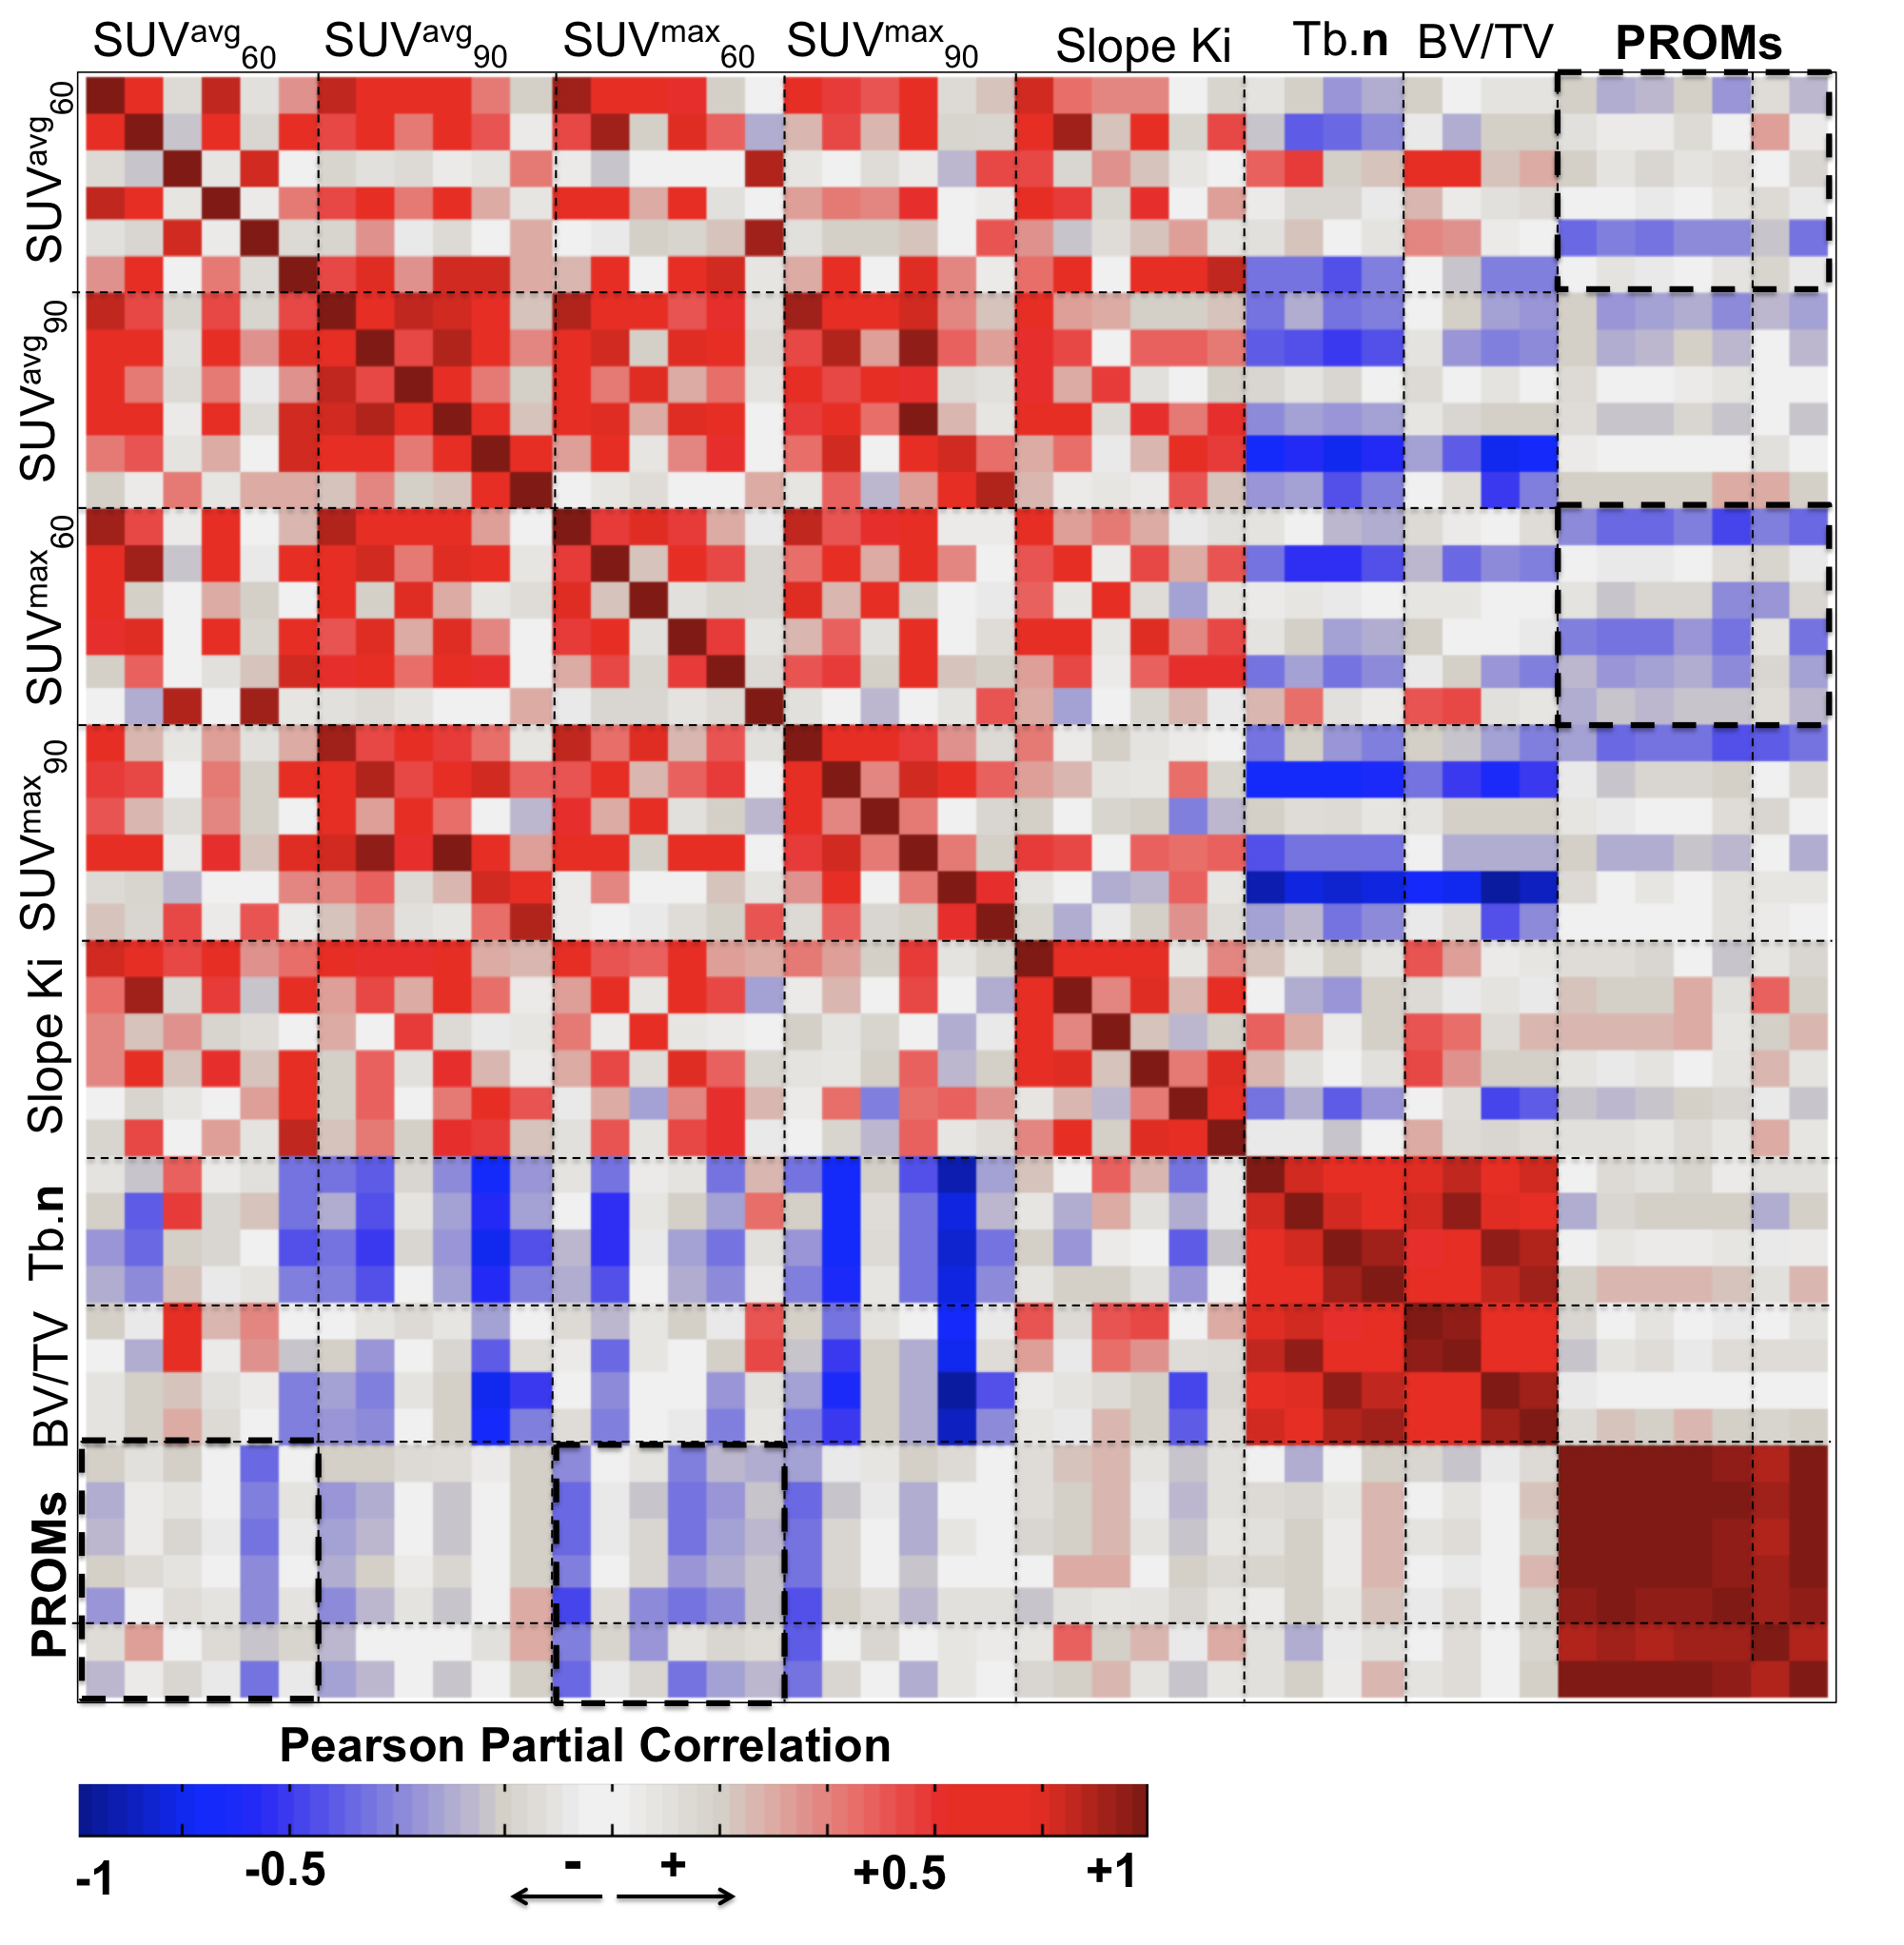
Figure 3: Correlation Matrix showing the association between SUV average and max, Ki, trabecular bone structure variables and patients reported outcome. The associations are computed using Pearson partial correlation considering age, gender and BMI as adjusting factors.
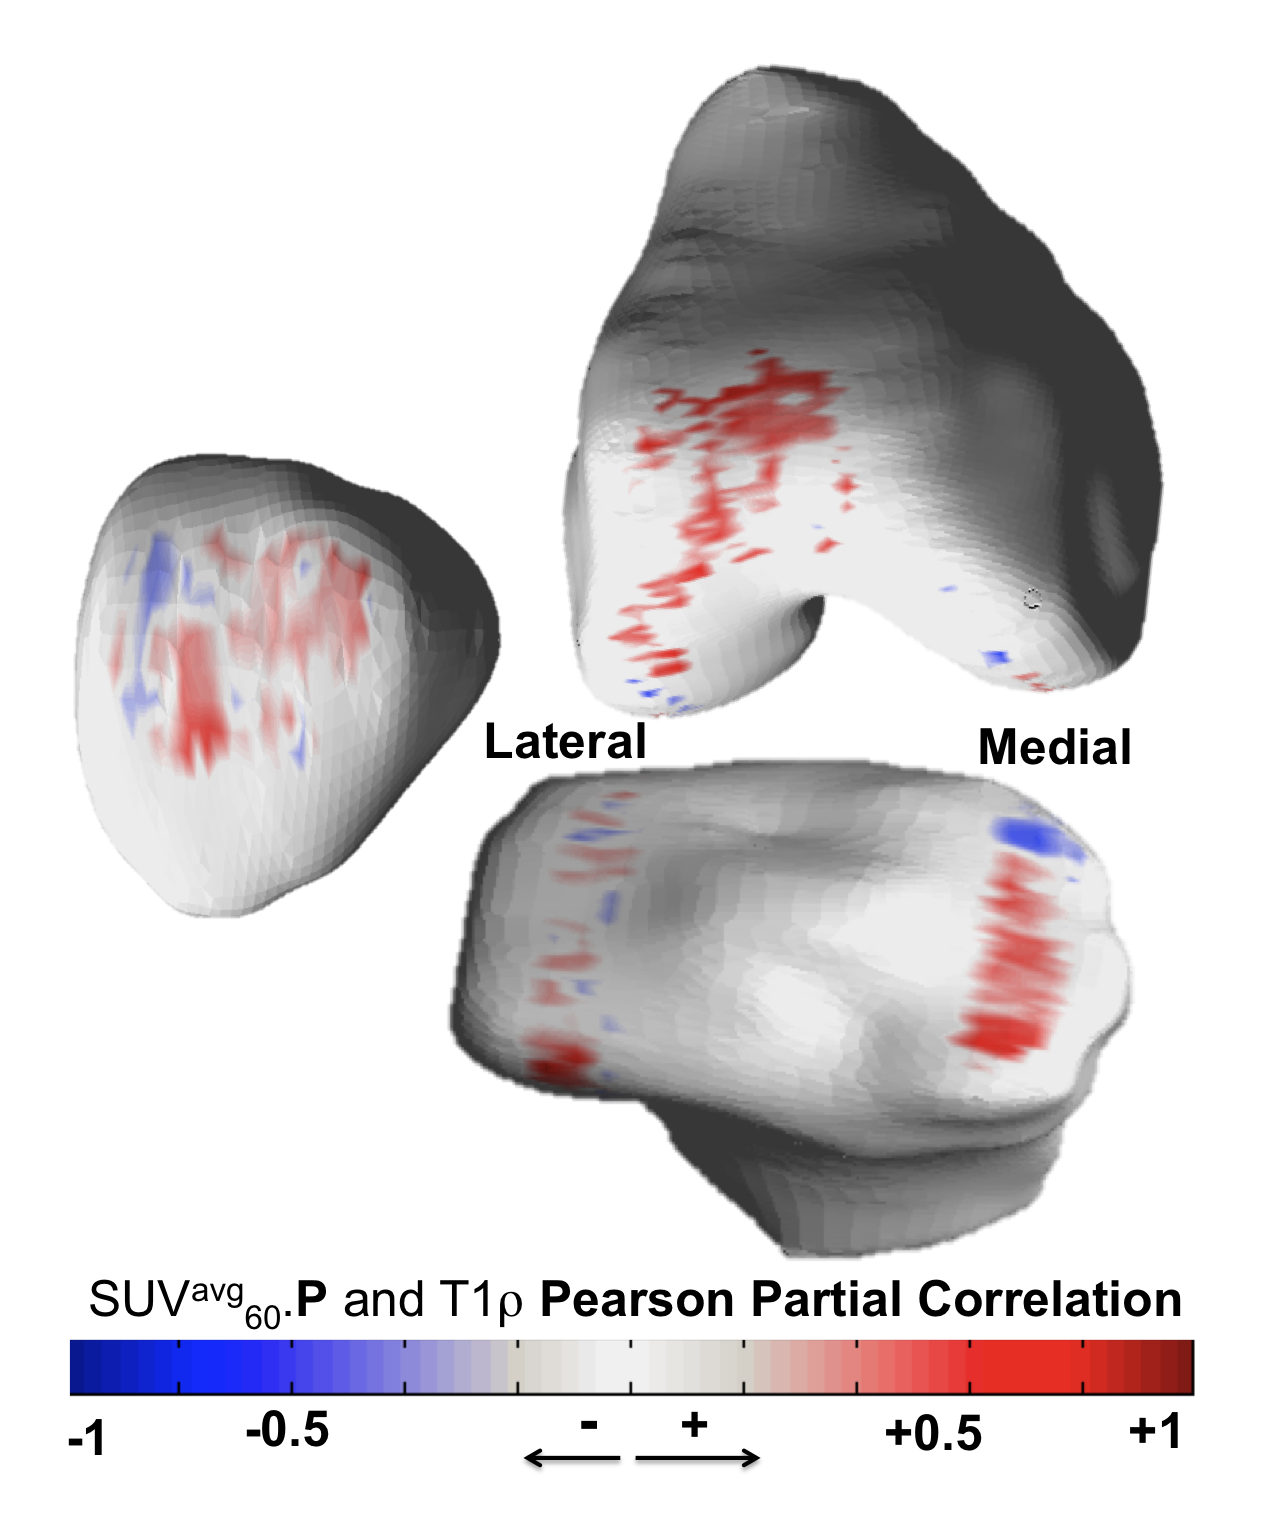
Figure 4: Bone cartilage interaction computed with voxel based relaxometry. 3D R-map showing the local correlation between the SUV average computed in patella and the voxel-based values of T1ρ. The associations are computed using Pearson partial correlation considering age, gender and BMI as adjusting factors. Average of R-value along the cartilage thickness are computed and rendered on a bone surface manually segmented.