0847
Feasibility of bone mineral and water quantification in vivo by solid-state 31P and 1H MRI at 3T1University of Pennsylvania, Philadelphia, PA, United States
Synopsis
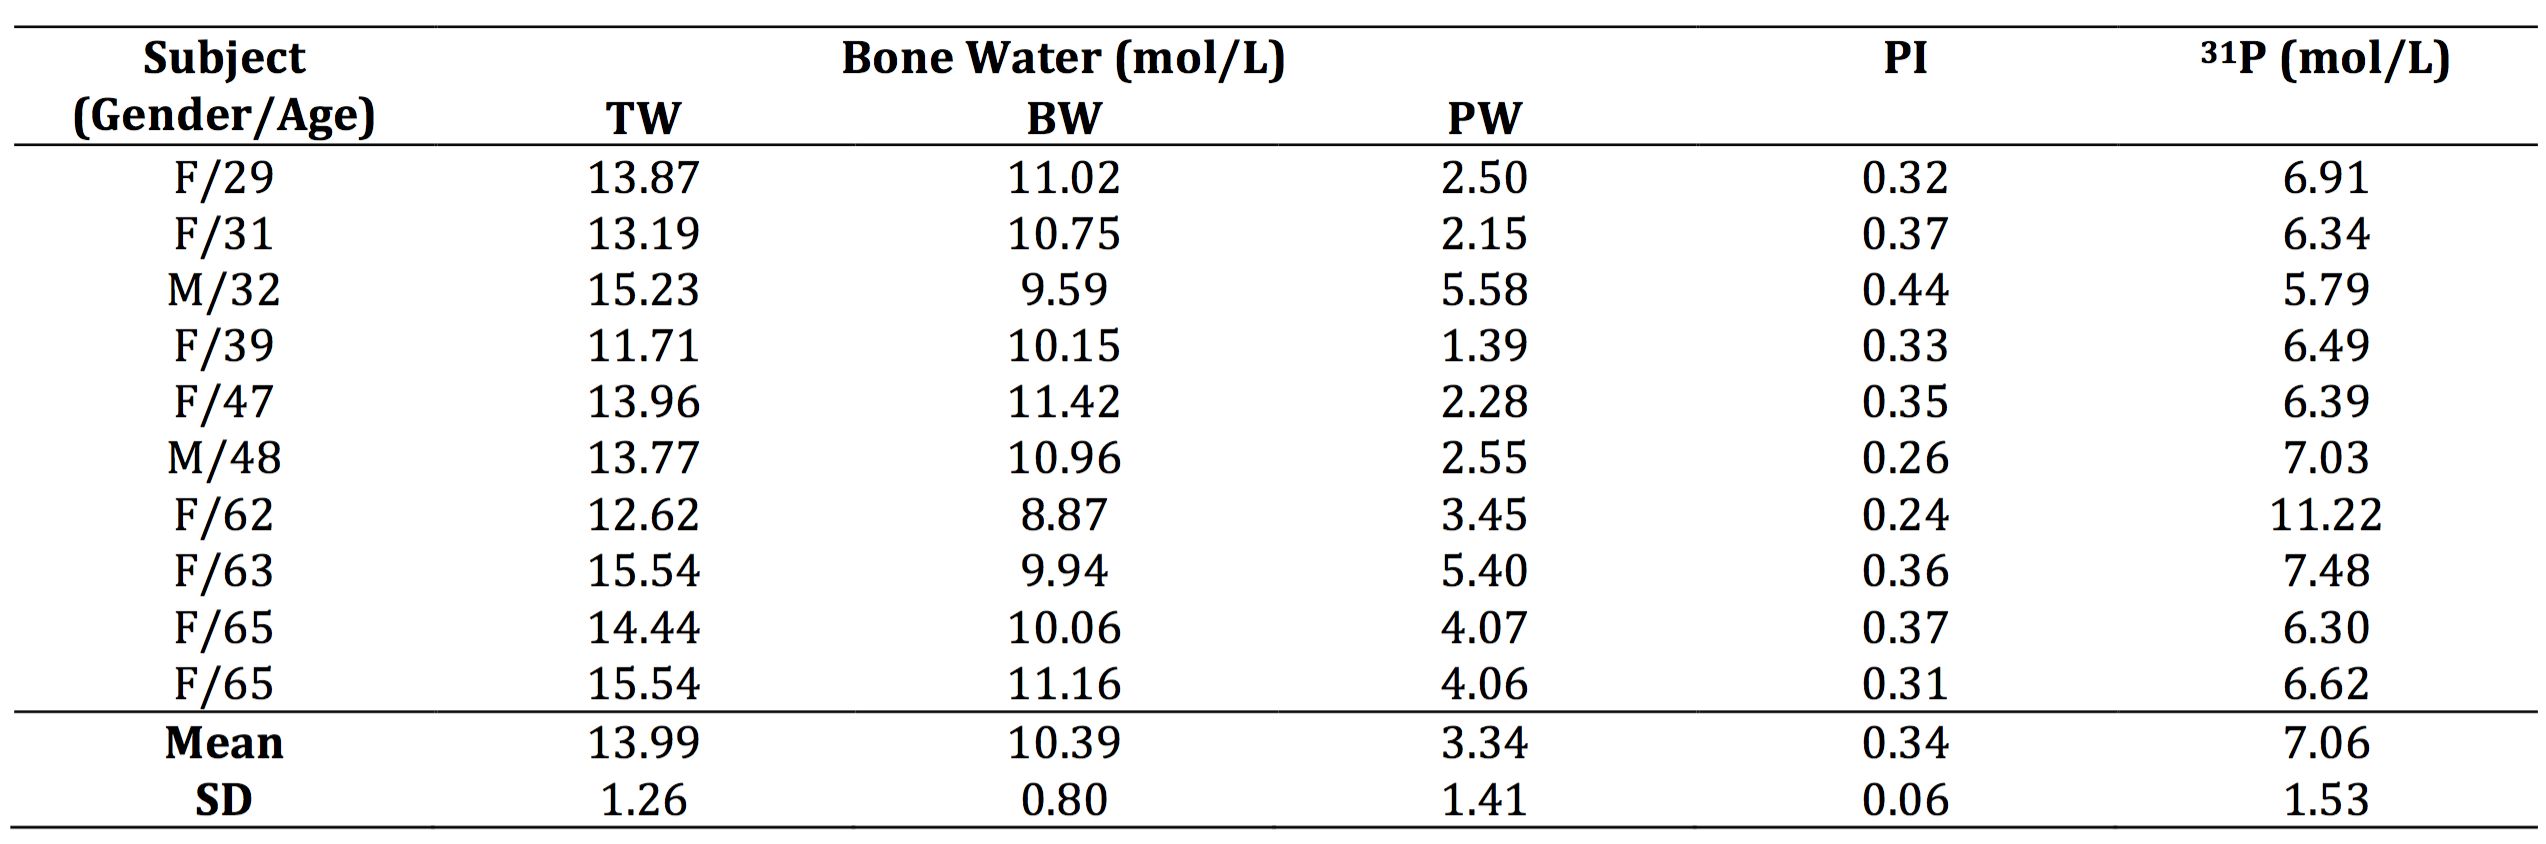
Surrogates for bone matrix density, pore volume fraction and mineral density can be studied with solid-state MRI. Here, we developed an in vivo MRI protocol to simultaneously quantify bone mineral 31P and bound and pore water on a 3 Tesla clinical MRI system with a dual-frequency extremity coil and 3D 1H UTE and 31P PETRA-ZTE pulse sequences. Measurements in the mid-tibia of 10 subjects yielded 7.06±1.53mol/L 31P, and 13.99±1.26 and 10.39±0.80mol/L H2O for total and bound water, respectively, in good agreement with prior ex vivo data. The work suggests that both organic and inorganic phases of cortical bone can be quantitatively evaluated in vivo with a single, integrated protocol.
Introduction
The organic and inorganic constituents of bone determine tensile and compressive bone strength in health and disease. Relying on the overall electron density, X-ray based techniques often fail to predict fracture risk1 or differentiate disorders such as osteoporosis and osteomalacia. Recently, solid-state MRI has enabled quantification of biomarkers for bone matrix density and porosity, as collagen bound and pore water (BW, PW) have been quantified in vivo2, 3. Similarly, in vivo 31P MRI has been shown to be feasible on clinical imagers4, 5, and more recently, 31P quantification was demonstrated ex vivo6. However, neither MRI based in vivo 31P quantification nor successful integration of bone 31P and water quantification procedure has previously been attempted. Here we demonstrate the feasibility of solid-state 1H/31P MRI for in vivo quantification of bound and pore water, along with mineral as part of a single integrated protocol.Methods
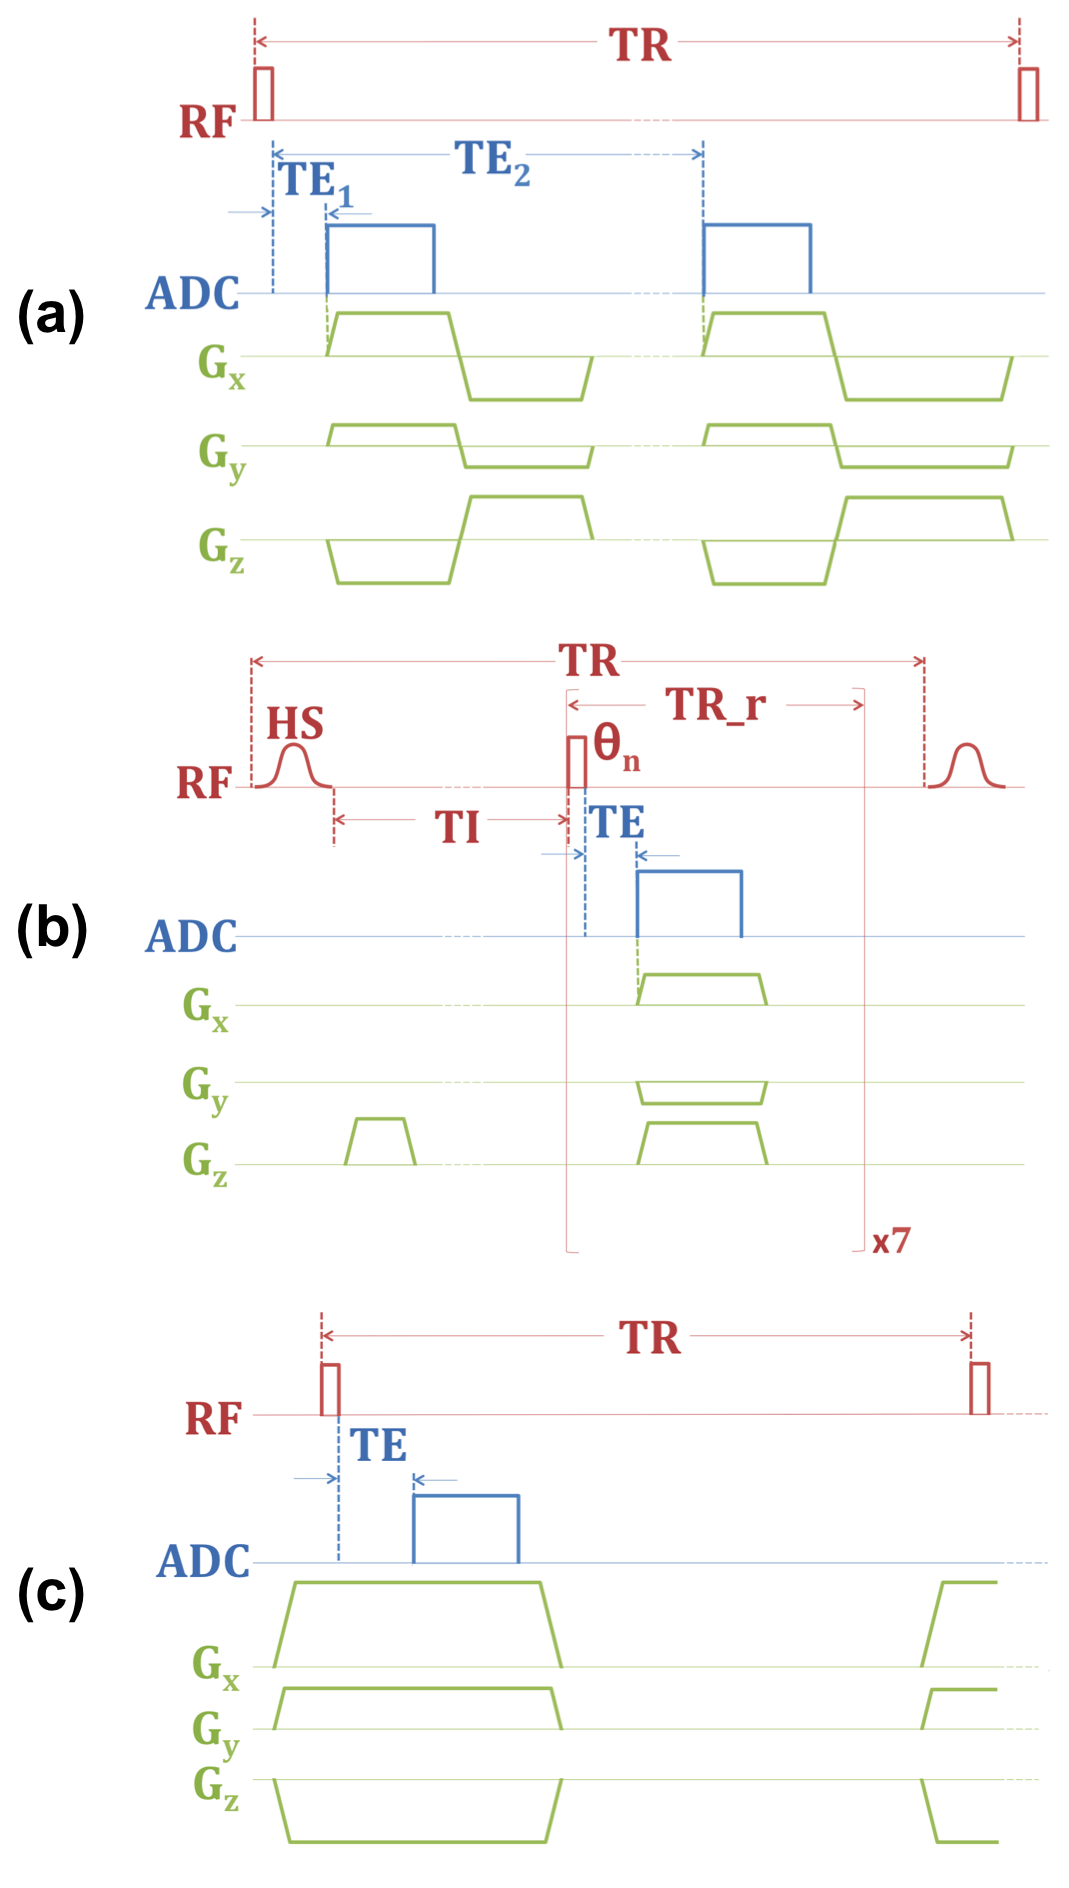
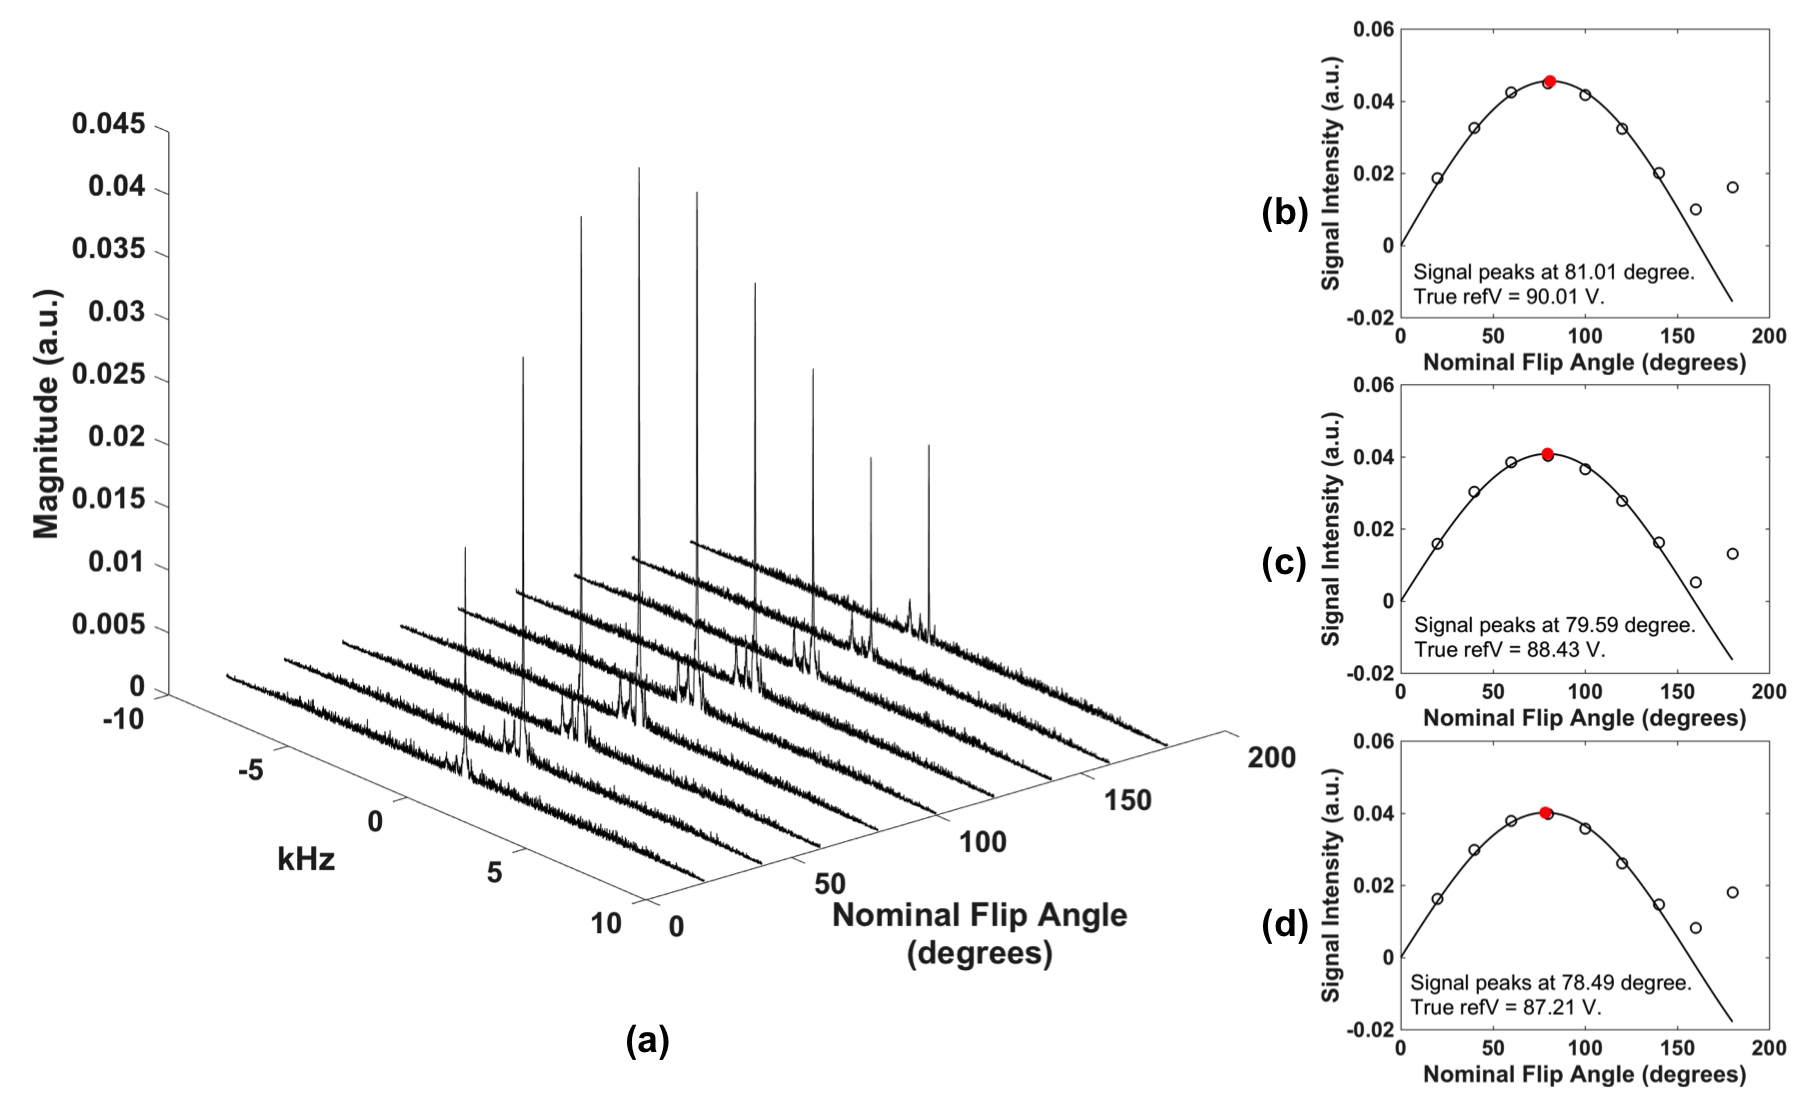
The 50min procedure was performed on a Siemens 3T TIM Trio system with a custom 1H/31P coil. Total bone water (TW, T1~250ms, T2*~750µs) was imaged by 3D dual-echo UTE (Figure 1a). The signal of first echo is the sum of total cortical bone water (TW), while that of the second is primarily from water in large pores due to their longer T2*s, with their ratio yielding a porosity index (PI)7. Collagen matrix bound water (BW, T1~145ms, T2*~390µs) was imaged by 3D IR_rUTE (inversion recovery prepared rapid UTE, Figure 1b). Bone 31P (T1~18s, T2*~160µs) was imaged using PETRA-ZTE (Figure 1c)6, 8, in which the encoding/readout gradient is fully ramped up prior to excitation, and missing data points near the k-space center (defined as PETRA radius) due to the receiver dead time are recovered by single point imaging. FOV was (250mm)3 for all three sequences. Reconstructed voxel size was (1mm)3 for 1H and (2.5mm)3 for 31P images. Since no automatic transmit power calibration was available for 31P, the flip angle (FA) was calibrated by incrementally stepping the power and maximizing the calf muscle phosphocreatine signal. Scans were performed in the presence of one 1H sample (20% H2O/80% D2O, doped with 27mmol/L MnCl2, T1=4.3ms, T2*=320μs) and two 31P samples of synthetic calcium apatite (7.5mol/L, T1=46.2s, T2*=139μs and 9.5mol/L, T1=42.2s, T2*=145μs). The central 4.5cm slab of the imaging volume was chosen for both water and 31P density quantifications. Tibial cortex ROI was drawn on the UTE image with a semi-automated algorithm9, and TW and BW were subsequently estimated by comparing signal within this ROI to that of the 1H reference sample on a pixel-by-pixel basis from first echo UTE and IR_rUTE images, respectively, with the difference of the two yielding PW. 31P was quantified in a similar manner, except a single value was measured from the entire slab due to lower SNR. Ten healthy subjects (two males, eight females, 49±15 y) underwent the MRI protocol described above as well as a HR-pQCT scan.Results
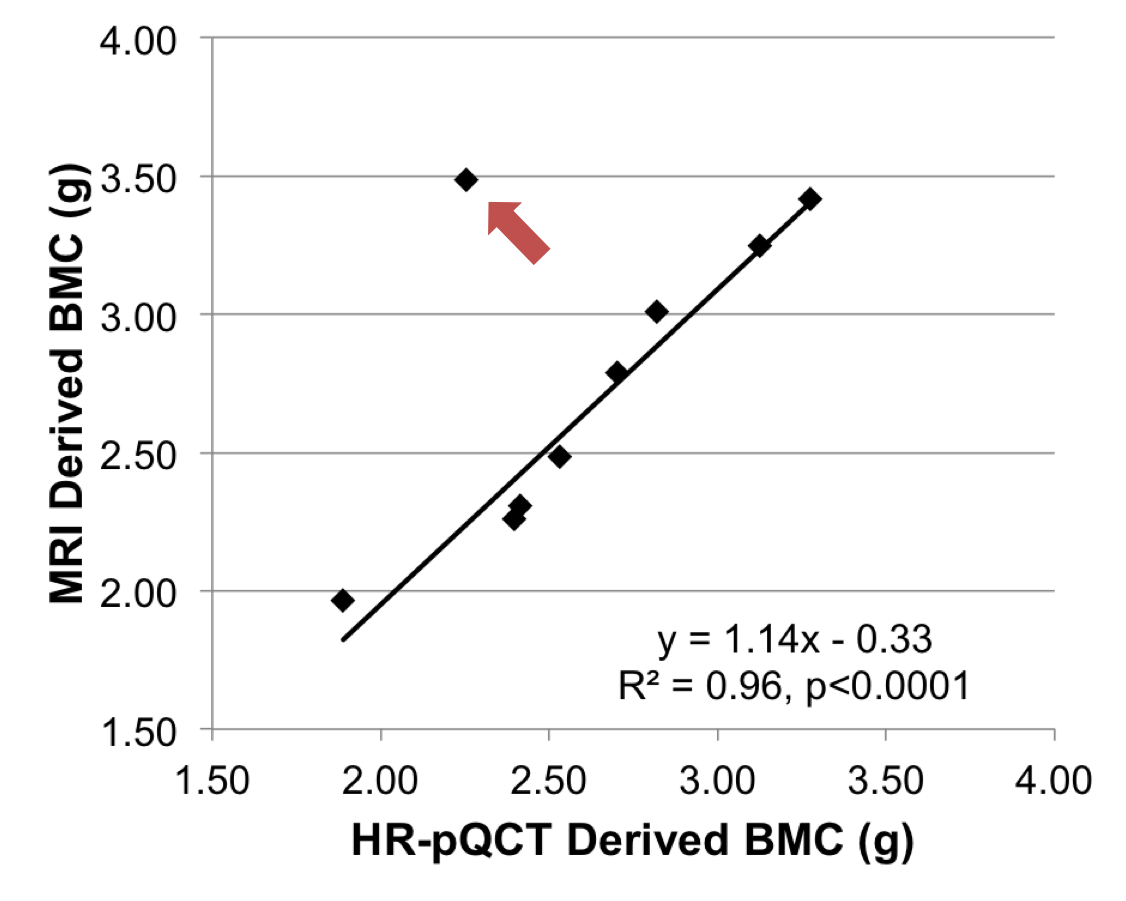
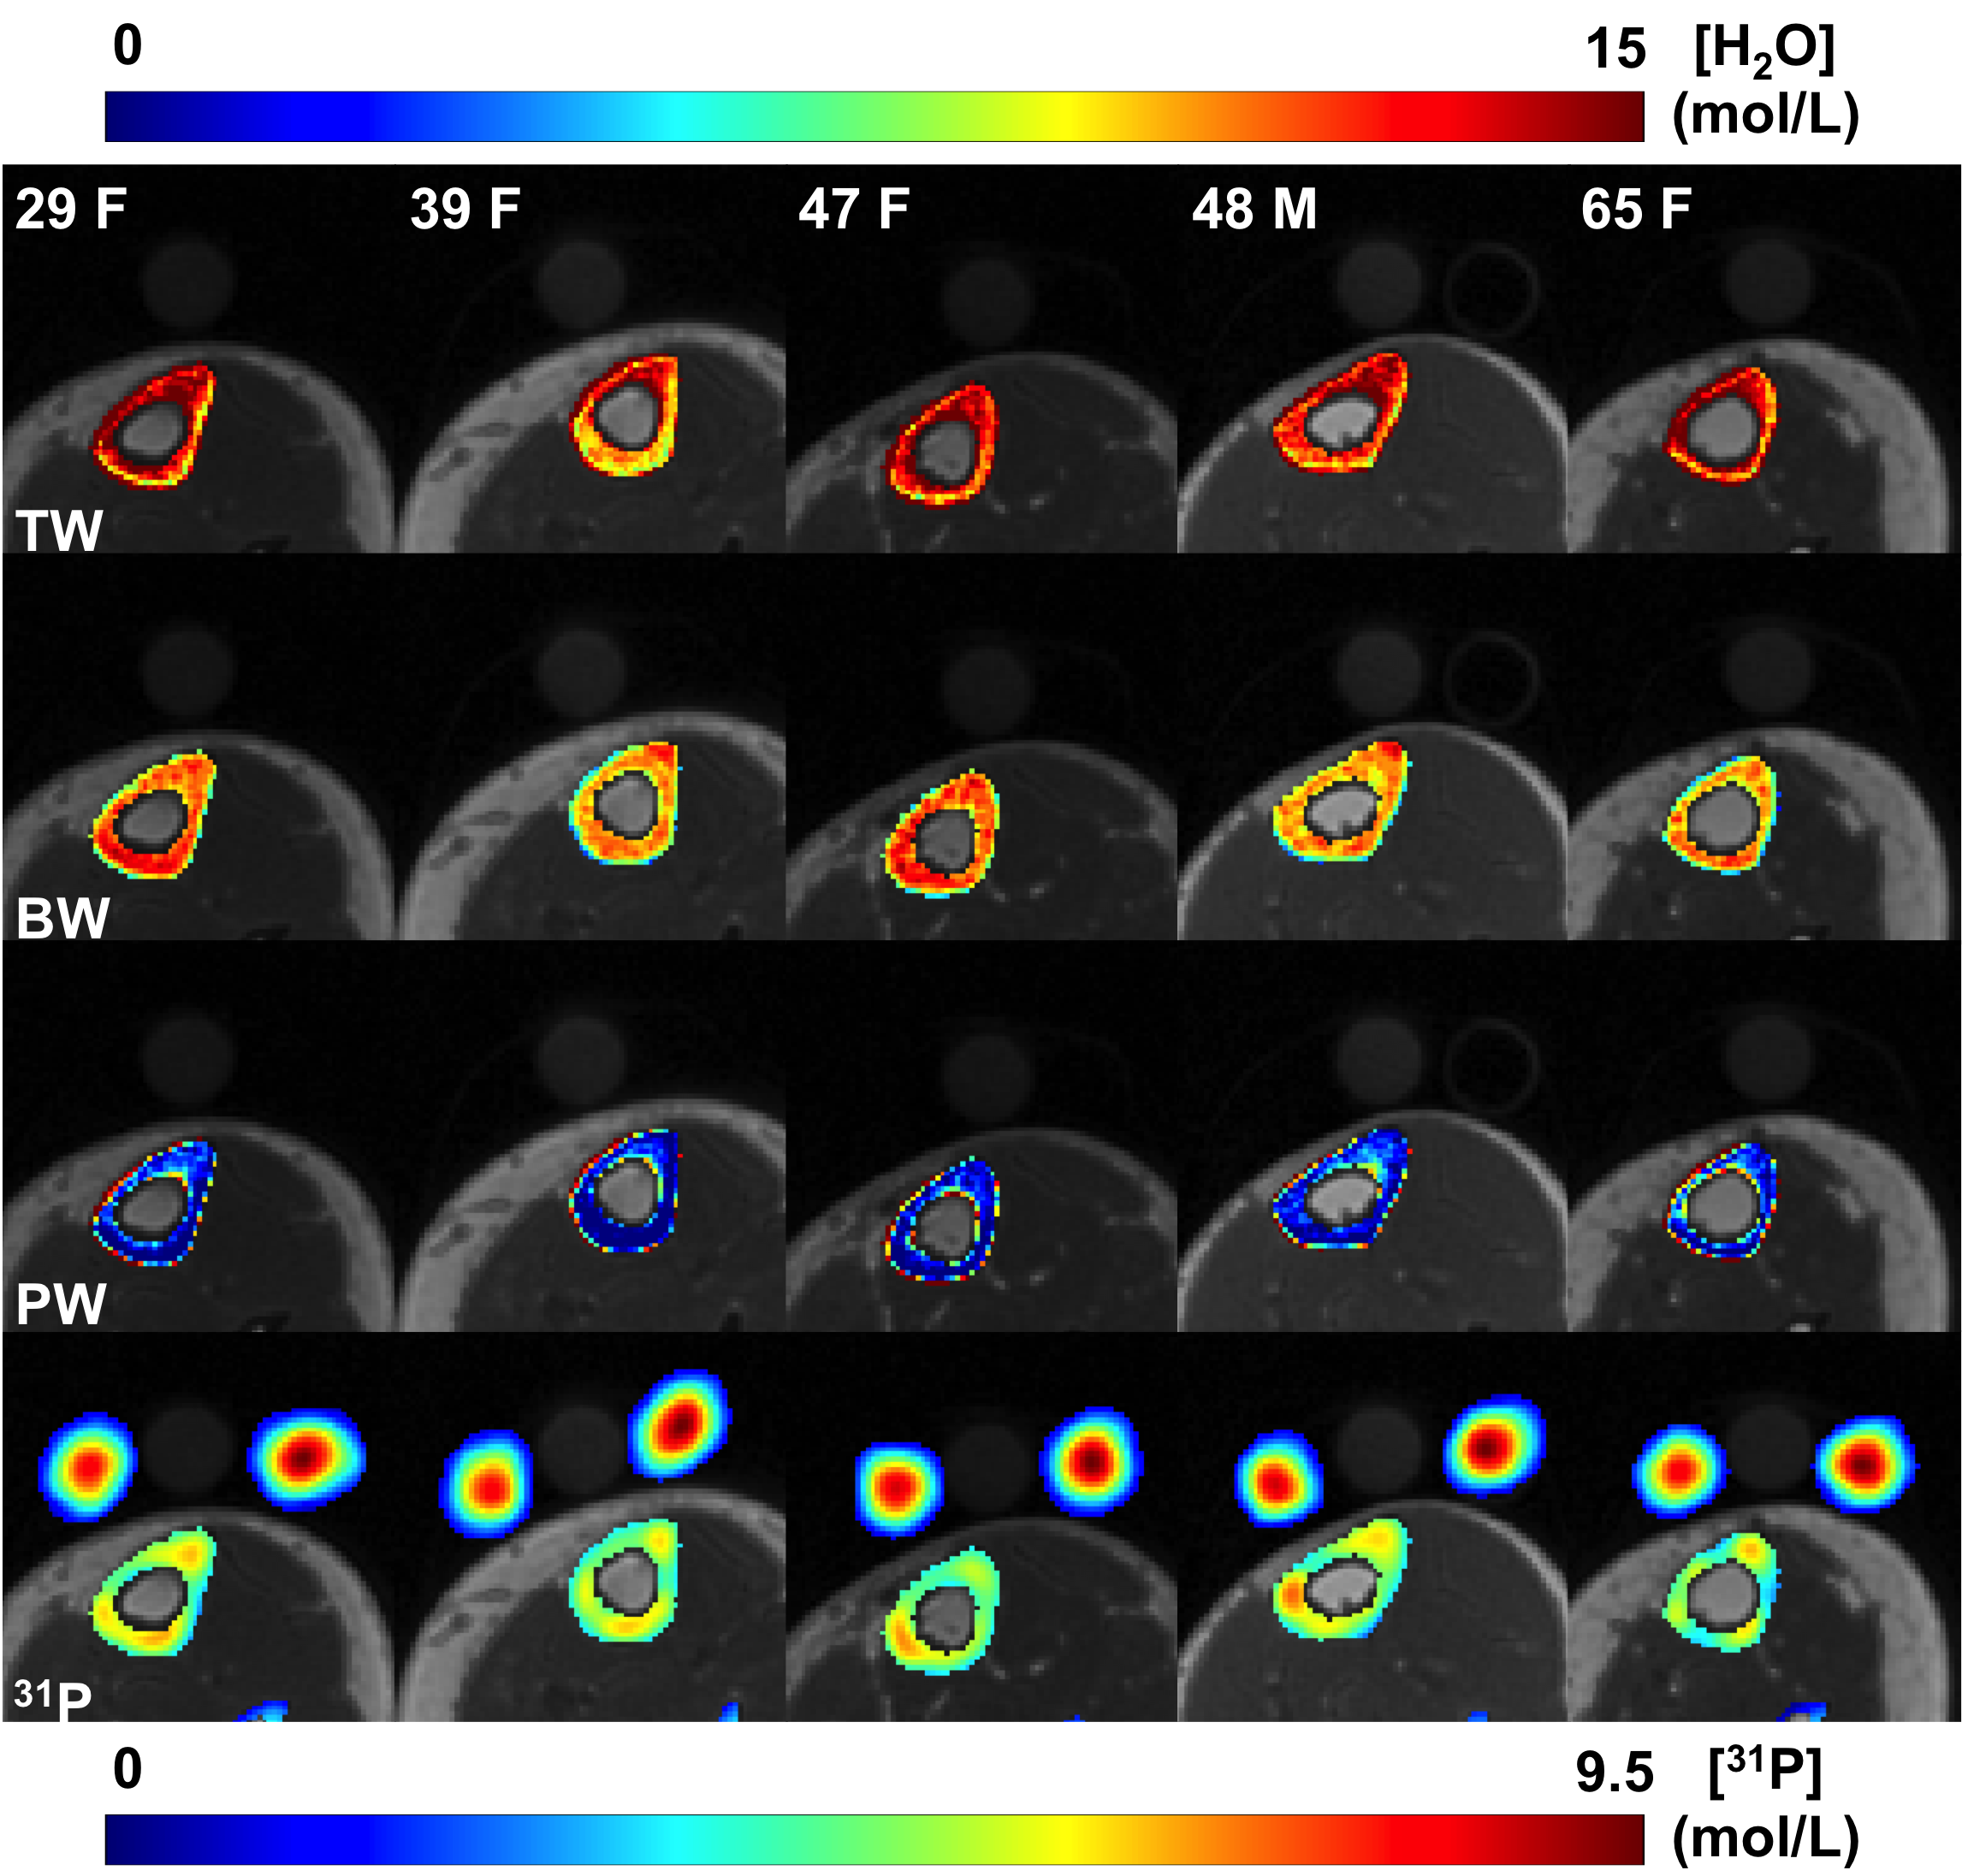
Figure 2a shows muscle phosphocreatine spectra at various nominal FAs with an arbitrarily preset 31P transmit power, and the calibration curves are given in Figure 2b-d. Bone mineral content (BMC) based on MRI-quantified total 31P content (assuming a bone apatite composition of Ca5(OH)(PO4)3) is plotted against that measured by HR-pQCT in Figure 3, showing the two quantities to be strongly correlated. Figure 4 displays bone water and 31P color maps of five of the subjects. MRI-derived parameters are listed in Table 1. PW was negatively correlated with volumetric bone mineral density (vBMD, R2=0.50, p=0.034), and PI was negatively correlated with 31P (R2=0.50, p=0.022). Excluding the 62 y/o subject (whose 31P concentration was far outside the range of all other subjects), the data suggested further possible associations, including negative correlations between vBMD and age (R2=0.50, p=0.051) and between BW and PI (R2=0.42, p=0.058), and a possible positive correlation between BW and vBMD (R2=0.44, p=0.072), all plausible.Discussion and Conclusions
Measured bone water concentrations are in good agreement with previously reported data3, 6, 10. Similarly, mineral 31P concentrations are very close to the average 31P concentration of 6.74mol/L found in an ex vivo study6, although an expected positive correlation between MRI-derived BW and 31P found ex vivo6 was not observed here, likely due to the small sample size. Further experiments are also warranted to investigate the sensitivity of MRI-based 31P quantification for differentiating different subject groups, e.g. healthy versus osteoporotic subjects and whether the technique can detect treatment effects. Nevertheless, the results presented in the current work indicate feasibility of in vivo quantification of bone 31P and water within a single imaging session.Acknowledgements
NIH R01-AG038693; NIG R01-AR50068References
1. Siris ES, Brenneman SK, Barrett-Connor E, Miller PD, Sajjan S, Berger ML, et al. The effect of age and bone mineral density on the absolute, excess, and relative risk of fracture in postmenopausal women aged 50-99: results from the National Osteoporosis Risk Assessment (NORA). Osteoporos Int. 2006;17(4):565-74.
2. Chen J, Carl M, Ma Y, Shao H, Lu X, Chen B, et al. Fast volumetric imaging of bound and pore water in cortical bone using three-dimensional ultrashort-TE (UTE) and inversion recovery UTE sequences. NMR Biomed. 2016;29(10):1373-80.
3. Manhard MK, Horch RA, Gochberg DF, Nyman JS, Does MD. In Vivo Quantitative MR Imaging of Bound and Pore Water in Cortical Bone. Radiology. 2015;277(1):221-9.
4. Robson MD, Gatehouse PD, Bydder GM, Neubauer S. Human imaging of phosphorus in cortical and trabecular bone in vivo. Magn Reson Med. 2004;51(5):888-92.
5. Wu Y, Reese TG, Cao H, Hrovat MI, Toddes SP, Lemdiasov RA, et al. Bone mineral imaged in vivo by (31) P solid state MRI of human wrists. J Magn Reson Imaging. 2011;34(3):623-33.
6. Seifert AC, Li C, Rajapakse CS, Bashoor-Zadeh M, Bhagat YA, Wright AC, et al. Bone mineral 31P and matrix-bound water densities measured by solid-state 31P and 1H MRI. NMR in Biomedicine. 2014;27(7):739-48.
7. Rajapakse CS, Bashoor-Zadeh M, Li C, Sun W, Wright AC, Wehrli FW. Volumetric Cortical Bone Porosity Assessment with MR Imaging: Validation and Clinical Feasibility. Radiology. 2015;276(2):526-35.
8. Grodzki DM, Jakob PM, Heismann B. Ultrashort echo time imaging using pointwise encoding time reduction with radial acquisition (PETRA). Magn Reson Med. 2012;67(2):510-8.
9. Rad HS, Lam SC, Magland JF, Ong H, Li C, Song HK, et al. Quantifying cortical bone water in vivo by three-dimensional ultra-short echo-time MRI. NMR in Biomedicine. 2011;24(7):855-64.
10. Techawiboonwong A, Song HK, Leonard MB, Wehrli FW. Cortical bone water: in vivo quantification with ultrashort echo-time MR imaging. Radiology. 2008;248(3):824-33.
Figures