0843
Origin of the time dependence of the diffusion-weighted signal in spinal cord white matter1UCL Institute of Neurology, Queen Square MS Centre, University College London, London, United Kingdom, 2Centre for Medical Image Computing, Department of Computer Science, University College London, London, United Kingdom, 3Champalimaud Centre for the Unknown, Champalimaud Foundation, Lisbon, Portugal, 4Translational Imaging Group, Centre for Medical Image Computing, Department of Medical Physics and Biomedical Engineering, University College London, London, United Kingdom, 5Philips UK, Guildford, Surrey, United Kingdom, 6Department of Brain and Behavioural Sciences, University of Pavia, Pavia, Italy, 7Brain MRI 3T Mondino Research Center, C. Mondino National Neurological Institute, Pavia, Italy
Synopsis
Time dependence of the brain white matter diffusion-weighted signal originates from both intra-axonal and extra-axonal spaces. Here, we investigate which of these contributions dominates in spinal cord white matter for clinically feasible acquisitions, to inform accurate model-based microstructural imaging. We analyse data from Monte Carlo simulations and from in vivo scans, and find that for diffusion times of 20-70 ms time dependence has mostly intra-axonal origin. Such a time dependence influences the estimation of axonal volume fraction and extra-axonal diffusivity, and highlights the importance of using long diffusion times to support stick-like models for axons in the spinal cord.
Purpose
Recent findings suggest that the time dependence of the diffusion-weighted (DW) magnetic resonance (MR) signal in brain white matter originates not only from the intra-axonal, but also from the extra-axonal space1, with important modelling implications2. However, it is not clear yet which of these contributions dominates for clinically-achievable diffusion times in spinal cord white matter, characterised by larger axons3 than those previously considered1.
Here, we aim to answer this question, as such information is key for mapping microstructure accurately in spinal cord applications.
Methods
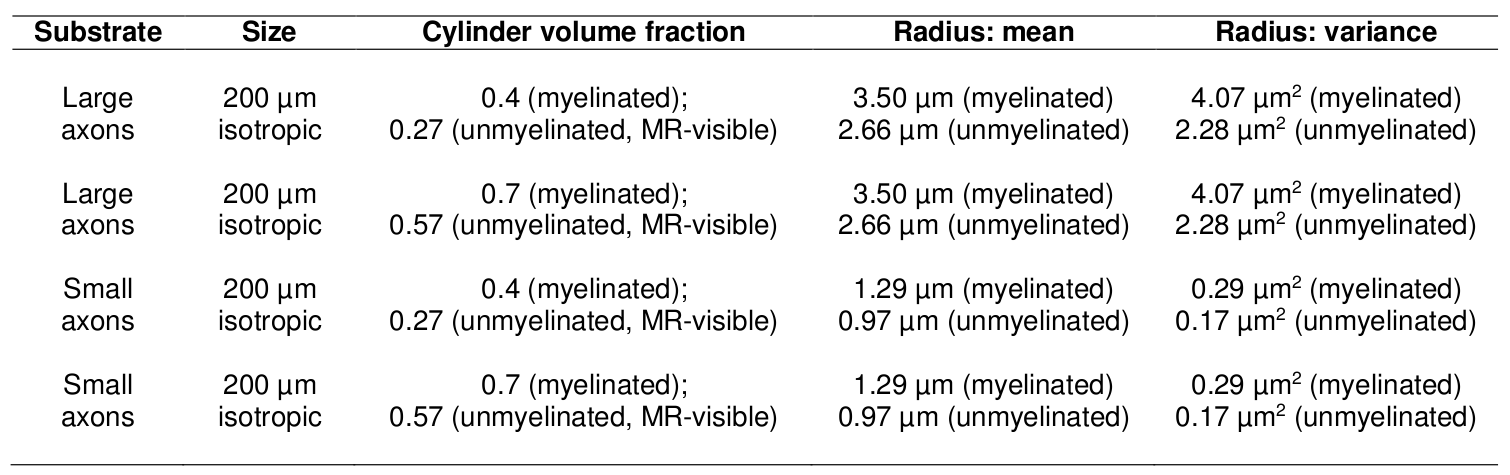
Simulations We ran Monte Carlo simulations in Camino4 using 105 spins to obtain signals from two substrates of gamma-distributed, impermeable cylinders, accommodating for myelin (g-ratio: 0.75). We modelled spinal cord white matter (large radii3; mean radius: 3.50 μm, figure 1) and, for comparison, callosal axons (smaller radii5; mean radius: 1.29 μm, figure 1), considering two different volume fractions (0.4 and 0.7) and setting 2 μm2/ms for the diffusivity inside/outside the cylinders. Assuming maximum gradient strength of 65 mT/m and TE ≤ 110 ms, we simulated three clinically-feasible pulsed-gradient spin echo (PGSE) protocols (9 b = 0; 20 directions at b = 711 s/mm2, 40 at b = 2855 s/mm2), each characterised by δ = 19 ms and a unique Δ amongst {35, 53, 71} ms.
Image acquisition We scanned three healthy volunteers (2 males, 27 years) on a 3T Philips Achieva system at cervical level. Our protocol included: a fast-field-echo (FFE) scan (resolution 0.75×0.75×5 mm3, field-of-view 240×180×60 mm3, TE/TR = 4.1/20 ms/ms, flip angle 7°); three clinically feasible, two-shell DW scans (cardiac-gated PGSE ZOOM; resolution 1×1×5 mm3, field-of-view 64×48×60 mm3, TE = 111 ms; TR 12RR repeats; b-values/directions as simulations; δ = 22 ms), each characterised by a unique Δ amongst {29, 52, 76} ms.
Image analysis Preprocessing was performed with MRtrix3 and SCT (denoising6 accounting for noise floor7; motion correction8; semi-automated white matter segmentation9 on FFE scans; co-registration FFE-DW scans9). Afterwards, we fitted voxel-by-voxel the following two-compartment signal model to each two-shell scan using Matlab: i) intra-axonal restricted compartment (zero-radius cylinders or “sticks”; volume fraction V); ii) extra-axonal hindered compartment (cylindrically symmetric tensor; perpendicular diffusivity Dh⊥ ≤ D). The model was fitted either fixing D = 2 µm2/ms or estimating D and, for each case, estimating Dh⊥ or fixing it to (1 – V) D (tortuosity limit2).
Statistical analysis We tested for Δ-dependence of V and Dh⊥ fitting in Stata 14.1 a mixed effects model accounting for within-voxel/within-subject correlations (3-level hierarchy; random intercept; random slope).
Results
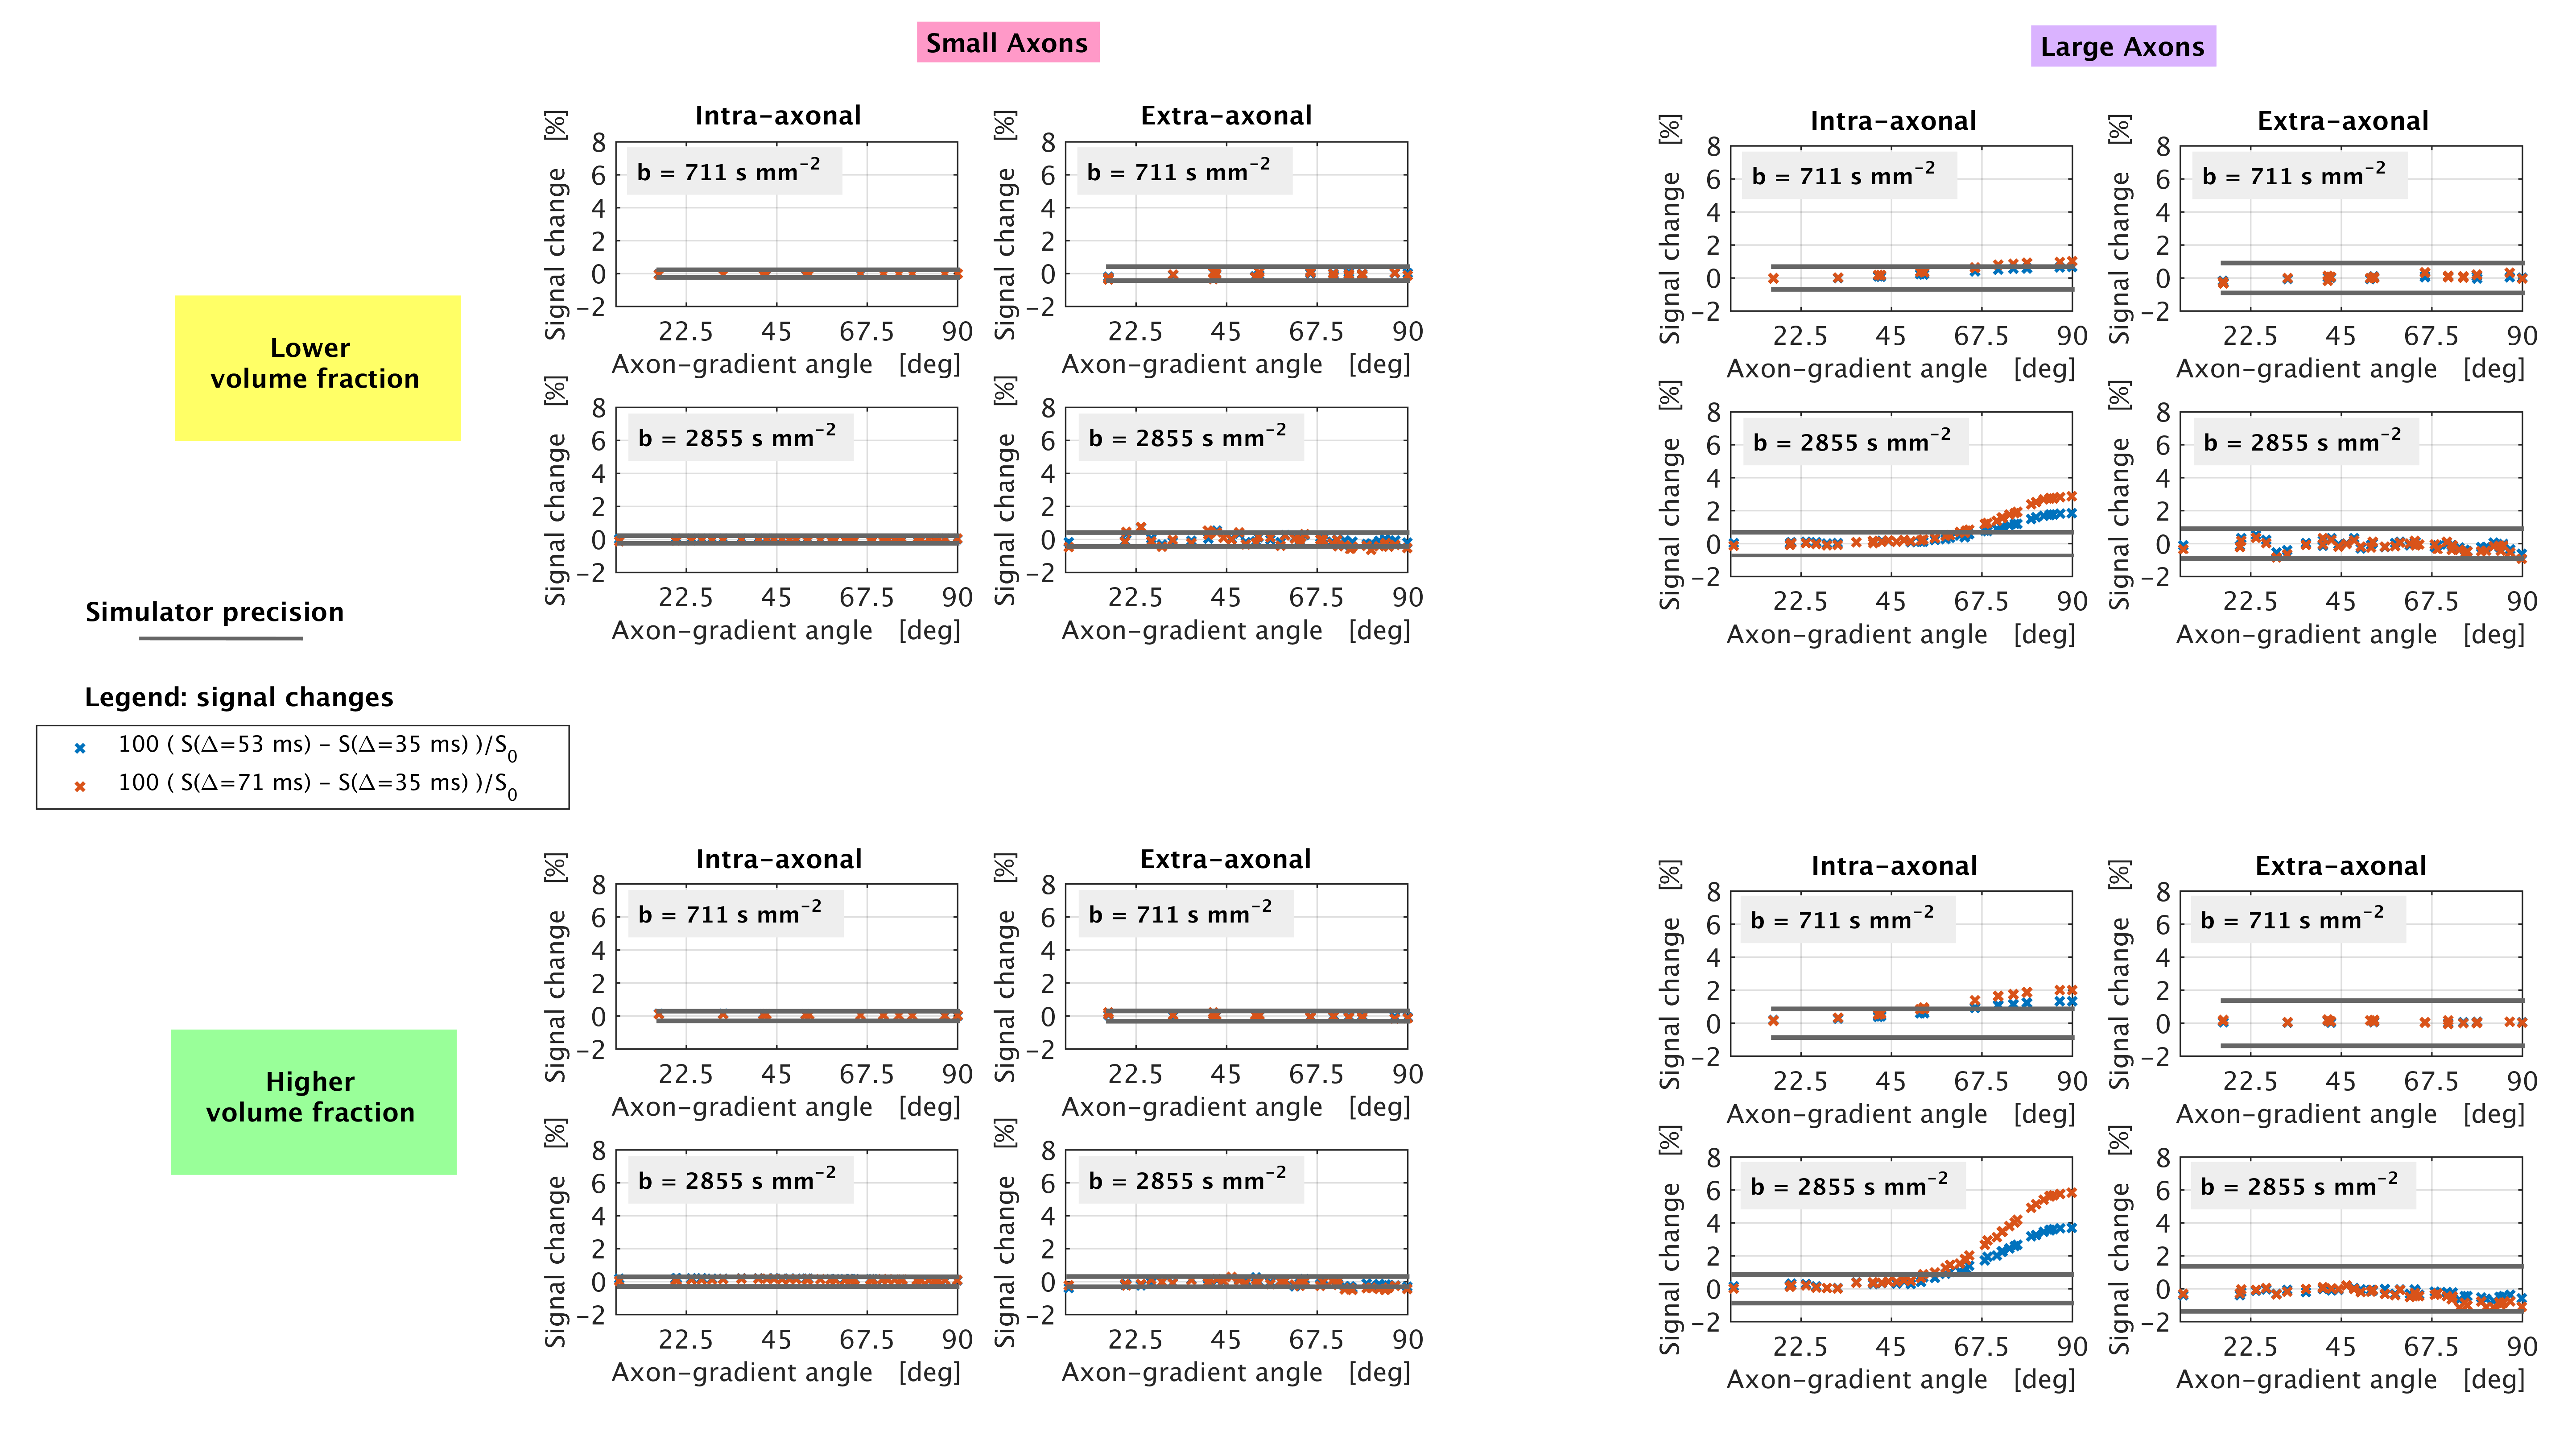
Simulations Figure 2 illustrates synthetic signal changes when Δ increases at fixed b, for different gradient orientations (signal sensitivity10). No appreciable changes above the simulation precision can be measured for small axons and for the extra-axonal signal of larger axons. However, the intra-axonal signal of the substrate with larger axons exhibits marked diffusion time dependence.
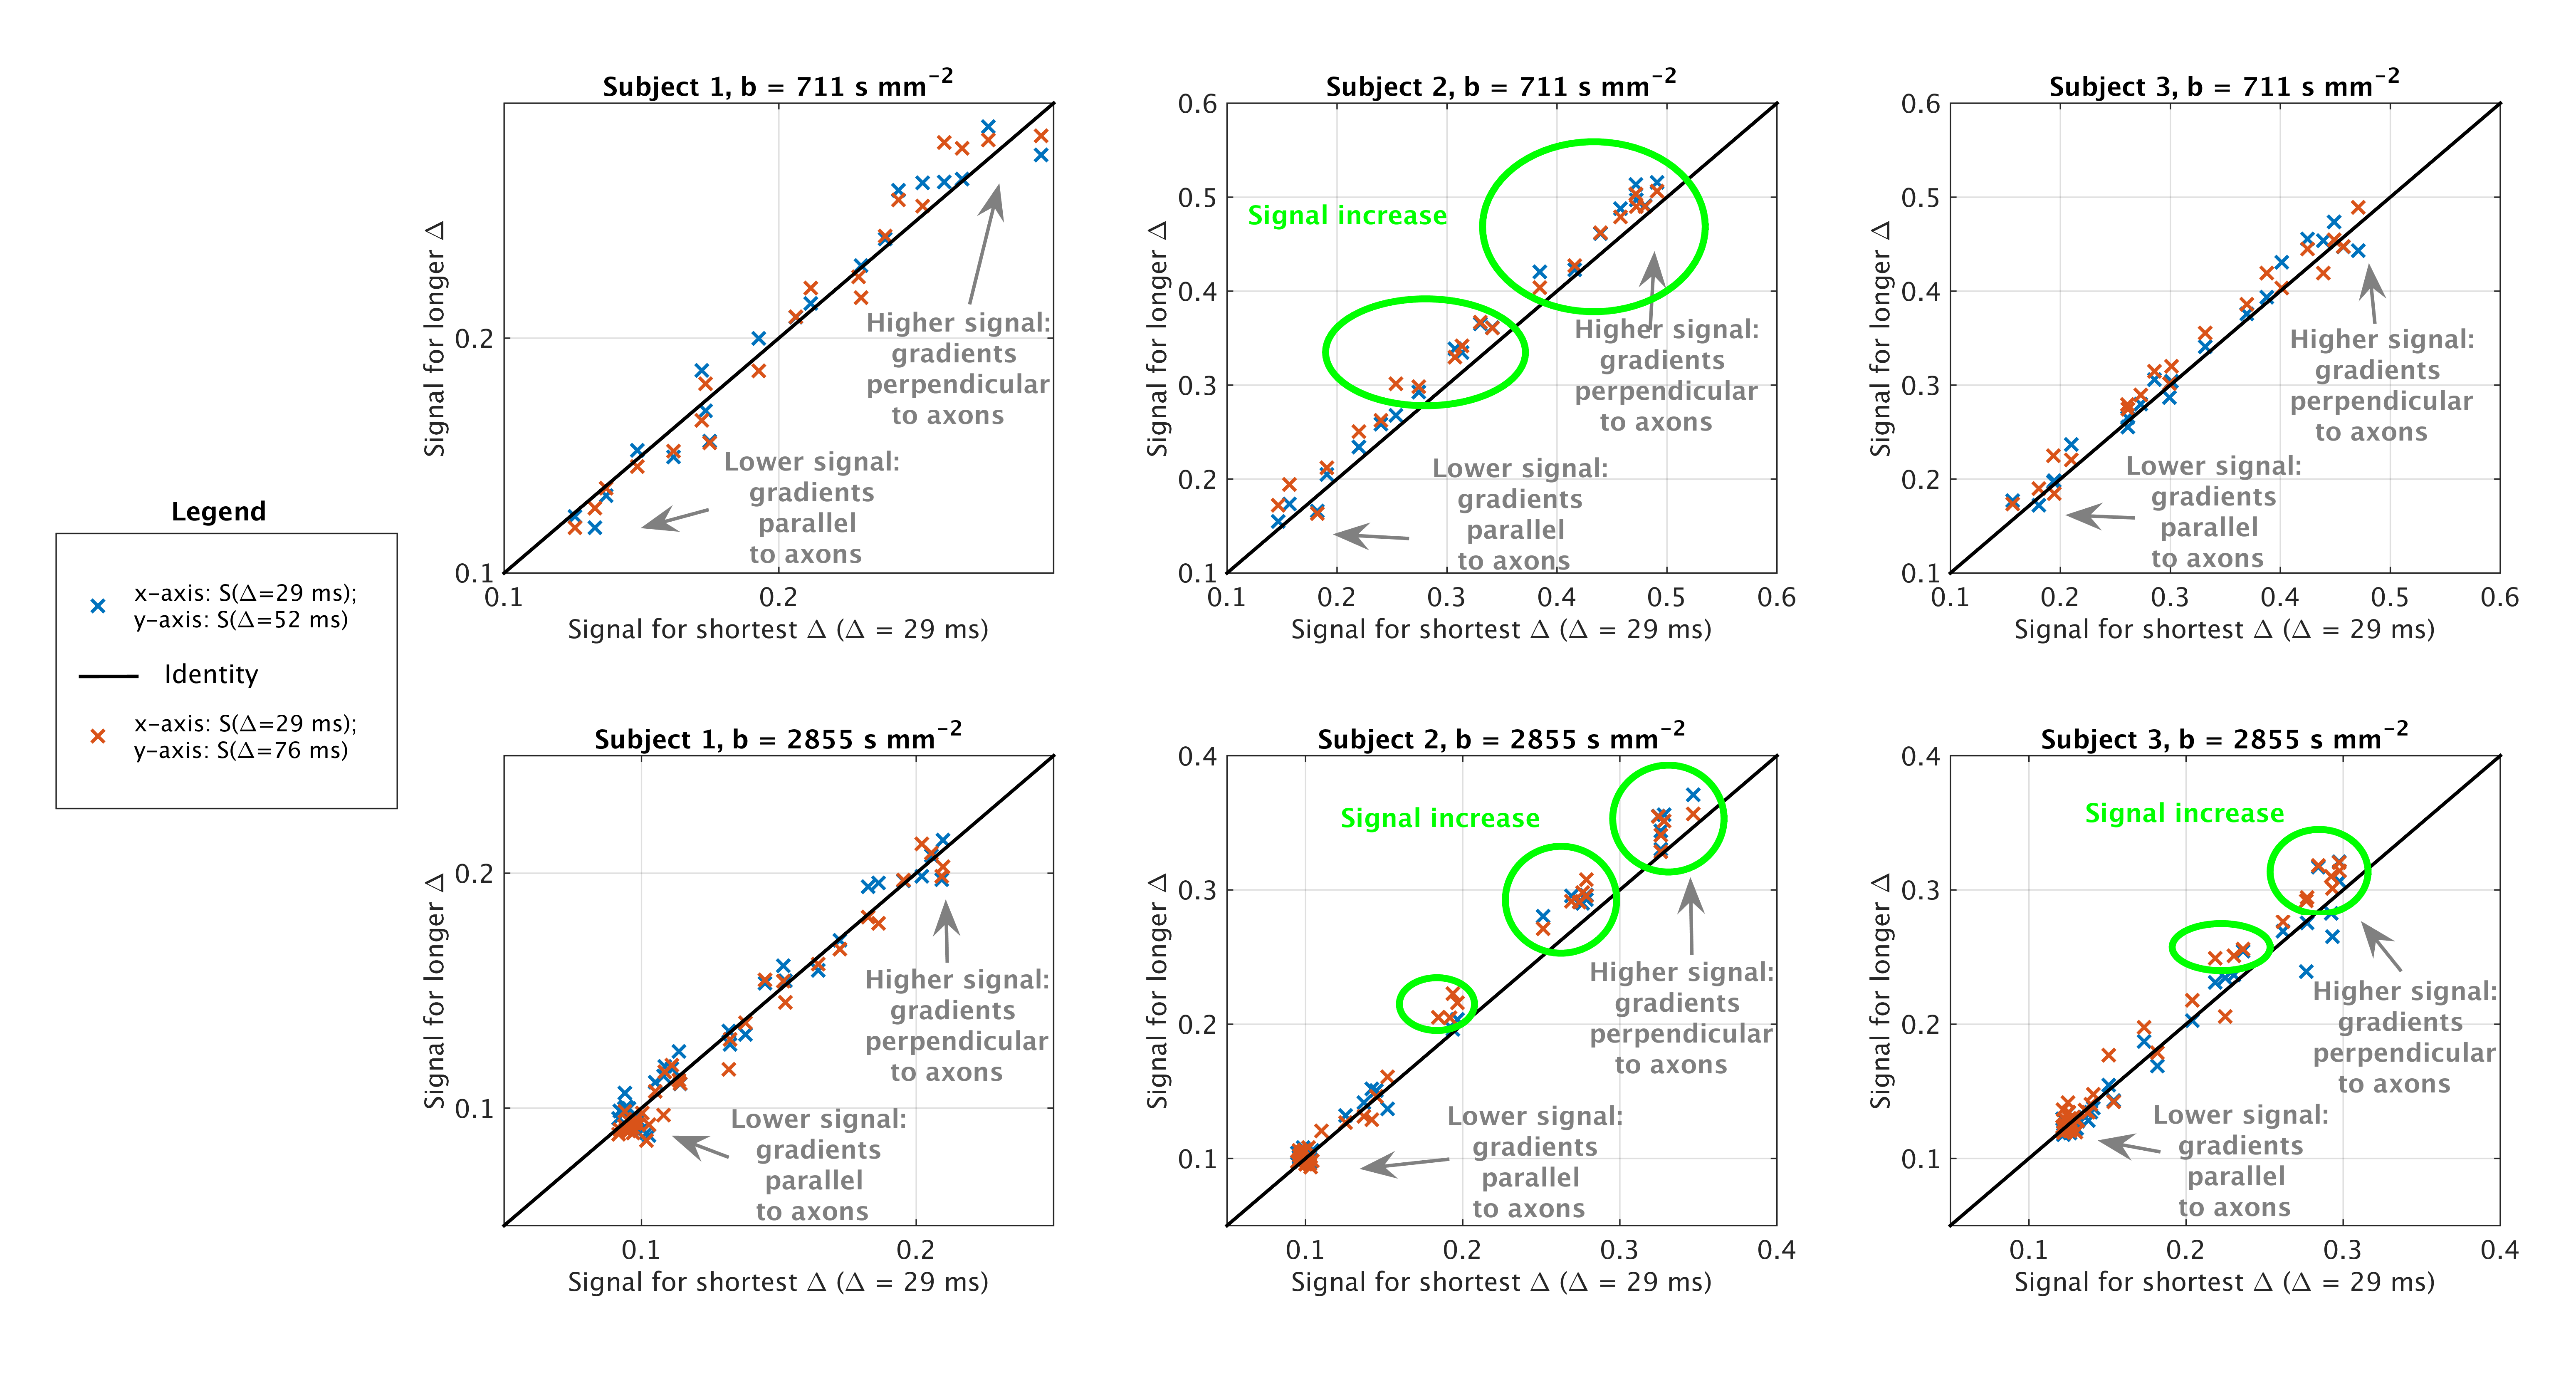
In vivo signals Figure 3 shows scatter plots of signals obtained at minimum Δ versus those obtained at higher Δ. At fixed b, we observe higher signal at high Δ compared to low Δ in subjects 2 and 3 for gradients perpendicular to axons.
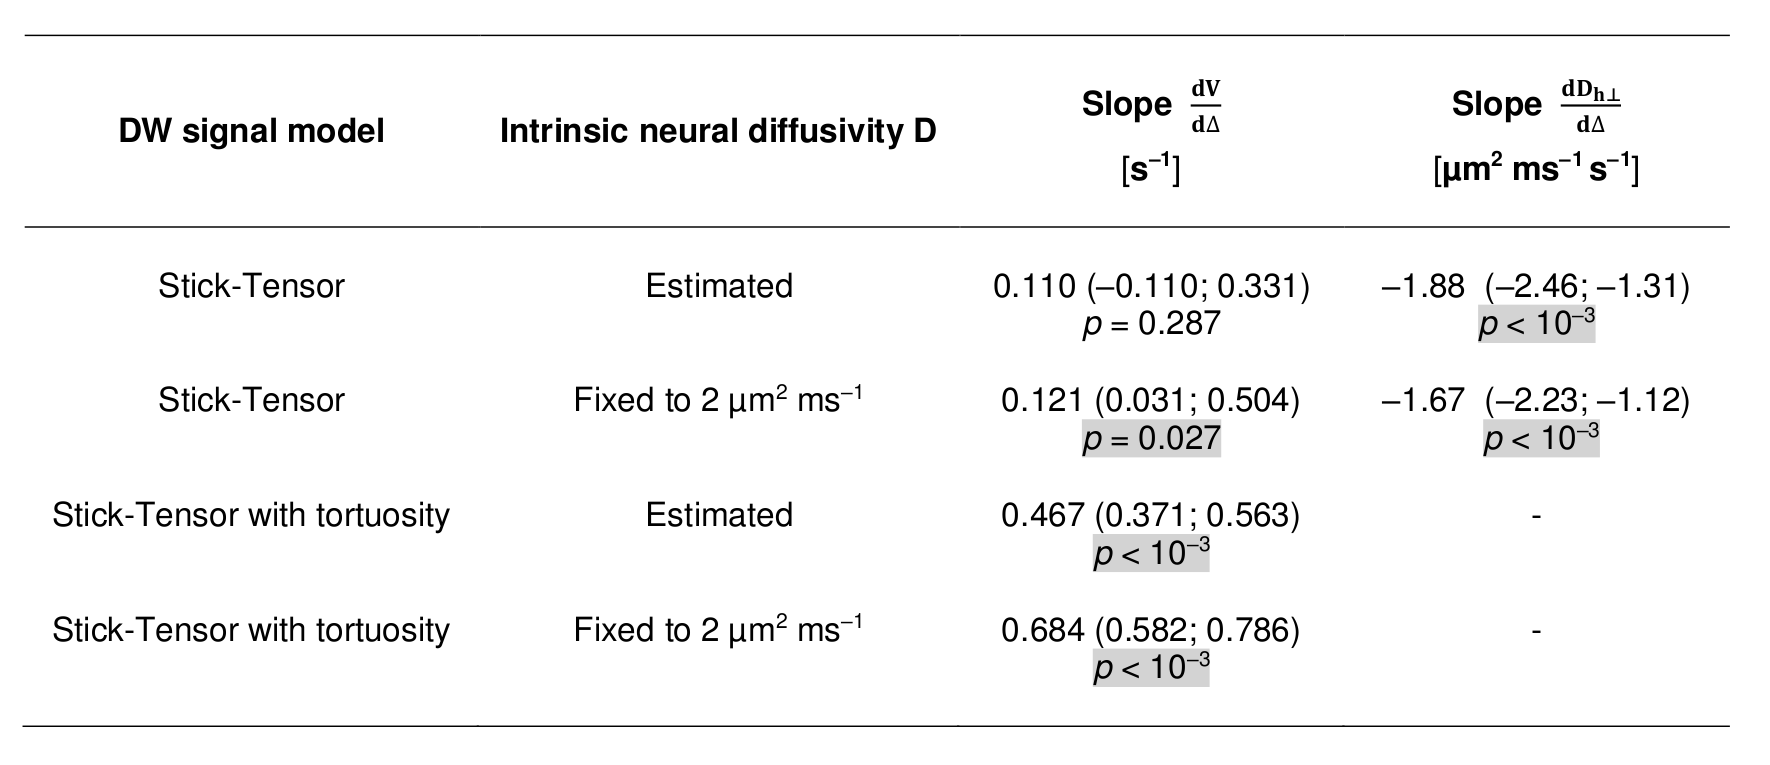
Statistical analysis Figure 4 reports the results of the statistical analysis. V increases significantly for increasing Δ when D is fixed, but only for the fitting with Dh⊥ fixed to the tortuosity limit when D is estimated. Dh⊥ always decreases significantly for increasing Δ.
Discussion
We have investigated the time dependence of the DW MR signal in the human spinal cord.
In vivo, at fixed b the DW signal increases as Δ increases, leading to significant decreases of Dh⊥ and increases of V (more evident when D is fixed, owing to ill-posed model inversion). This time dependence is likely to originate mostly in the intra-axonal space, as shown by our simulations, which also point towards negligible signal changes for smaller, callosal-like axons (a finding compatible with other studies1,2, where wider diffusion time ranges were considered).
The changes in V in vivo are stronger when the tortuosity approximation is employed, while they are weaker without, although still present and detectable. Results suggest that the lowest Δ used here is not sufficient for the perpendicular intra-axonal signal to reach its fully-restricted limit, and also implies that the changes of Dh⊥ may capture changes of the apparent intra-axonal perpendicular diffusivity.
Conclusion
We conclude that diffusion time dependence is relevant for imaging the spinal cord in clinical settings, but that it originates mostly from the intra-axonal space. Finally, we stress the importance of using long diffusion times to support stick-like models for axons in the spinal cord.Acknowledgements
The help of all volunteers. Horizon2020-EU.3.1 CDS-QUAMRI (ref: 634541). ISRT, WfL & CHNF (INSPIRED). UK MS Society. NIHR BRC UCLH/UCL High Impact Initiative (BW.MN.BRC10269). EPSRC (N018702, M020533, I027084, G007748, M507970, EP/H046410/1, EP/J020990/1, EP/K005278). MRC (MR/J01107X/1). 2015 postdoctoral research ECTRIMS Fellowships.References
[1] Burcaw LM, Fieremans E, Novikov DS. Mesoscopic structure of neuronal tracts from time-dependent diffusion. NeuroImage 2015; 114: 18-37.
[2] De Santis S, Jones DK, Roebroeck A. Including diffusion time dependence in the extra-axonal space improves in vivo estimates of axonal diameter and density in human white matter. NeuroImage 2016; 130: 91-103.
[3] Makino M, Mimatsu K, Saito H, et al. Morphometric study of myelinated fibers in human cervical spinal cord white matter. Spine 1996; 21: 1010-1016.
[4] Hall MG and Alexander DC. Convergence and parameter choice for Monte-Carlo simulations of diffusion MRI. IEEE T Med Imaging 2009; 28(9): 1354-1364.
[5] Alexander DC, Hubbard PL, Hall MG, et al. Orientationally invariant indices of axon diameter and density from diffusion MRI. NeuroImage 2010; 52(4):1374-1389.
[6] Veraart J, Novikov DS, Christiaens D, et al. Denoising of diffusion MRI using random matrix theory. NeuroImage 2016; 142: 394-406.
[7] Koay CG and Basser PJ. Analytically exact correction scheme for signal extraction from noisy magnitude MR signals. J Magn Reson 2006; 179(2): 317-322.
[8] Grussu F, Schneider T, Zhang H, et al. Neurite orientation dispersion and density imaging of the healthy cervical spinal cord in vivo. NeuroImage 2015; 111: 590-601.
[9] De Leneer B, Lévy S, Dupont SM, et al. SCT: spinal cord toolbox, an open source software for processing spinal cord MRI data. NeuroImage 2016 (in press).
[10] Drobnjak I, Zhang H, Ianus A, et al. PGSE, OGSE, and sensitivity to axon diameter in diffusion MRI: insight from a simulation study. Magn Reson Med 2016; 75(2): 688-700.
Figures