0840
Isotropic Diffusion Relaxometry Imaging (IDRI)1NIBIB, National Institutes of Health, Bethesda, MD, United States, 2NINDS, National Institutes of Health, Bethesda, MD, United States, 3NICHD, National Institutes of Health, Bethesda, MD, United States
Synopsis
We describe a model-free method to quantify the spectrum of water mobilities in fixed and live brain tissues. We eliminate confounds caused by anisotropic diffusion in brain tissues by measuring orientationally-averaged diffusion weighted images over a large range of b-values. Spectra of orientationally-averaged water diffusivities show clear distinctions between white matter, gray matter and cerebrospinal fluid, and could provide new biologically-specific clinical markers for studying and diagnosing ischemic stroke, tumors, and neurodegenerative disorders and diseases, including inflammation.
Purpose
We describe an efficient, model-free, whole-brain technique called isotropic diffusion relaxometry imaging (IDRI) for use in preclinical and clinical MRI applications. We eliminate confounds caused by anisotropic diffusion in brain tissues by measuring orientationally-averaged diffusion weighted images (DWIs) over a large range of b-values. We propose a novel processing, visualization and analysis pipeline for extracting biologically-specific microstructural information that could find a wide range of clinical applications in studying and diagnosing ischemic stroke, tumors, and neurodegenerative disorders and diseases, including inflammation.Methods
We acquired high-quality preclinical and clinical diffusion MRI data sets in fixed ferret brain (250x250x250µm3, TE/TR=36/700ms, bmax=13500mm2/s) and in vivo human brain (2.5x2.5x5mm3, TE/TR=93/7000ms, bmax=6000mm2/s), respectively, using 37 different b-values and diffusion gradient orientations applied along 13 directions to enable the computation of orientationally-averaged DWIs for each b-value1.
Diffusion datasets were processed with the TORTOISE software package2 to register all DWI volumes and correct image distortions due to eddy currents and field inhomogeneities. Orientationally-averaged (isotropic) diffusion signals were obtained by combining the 13 DWIs at each b-value.
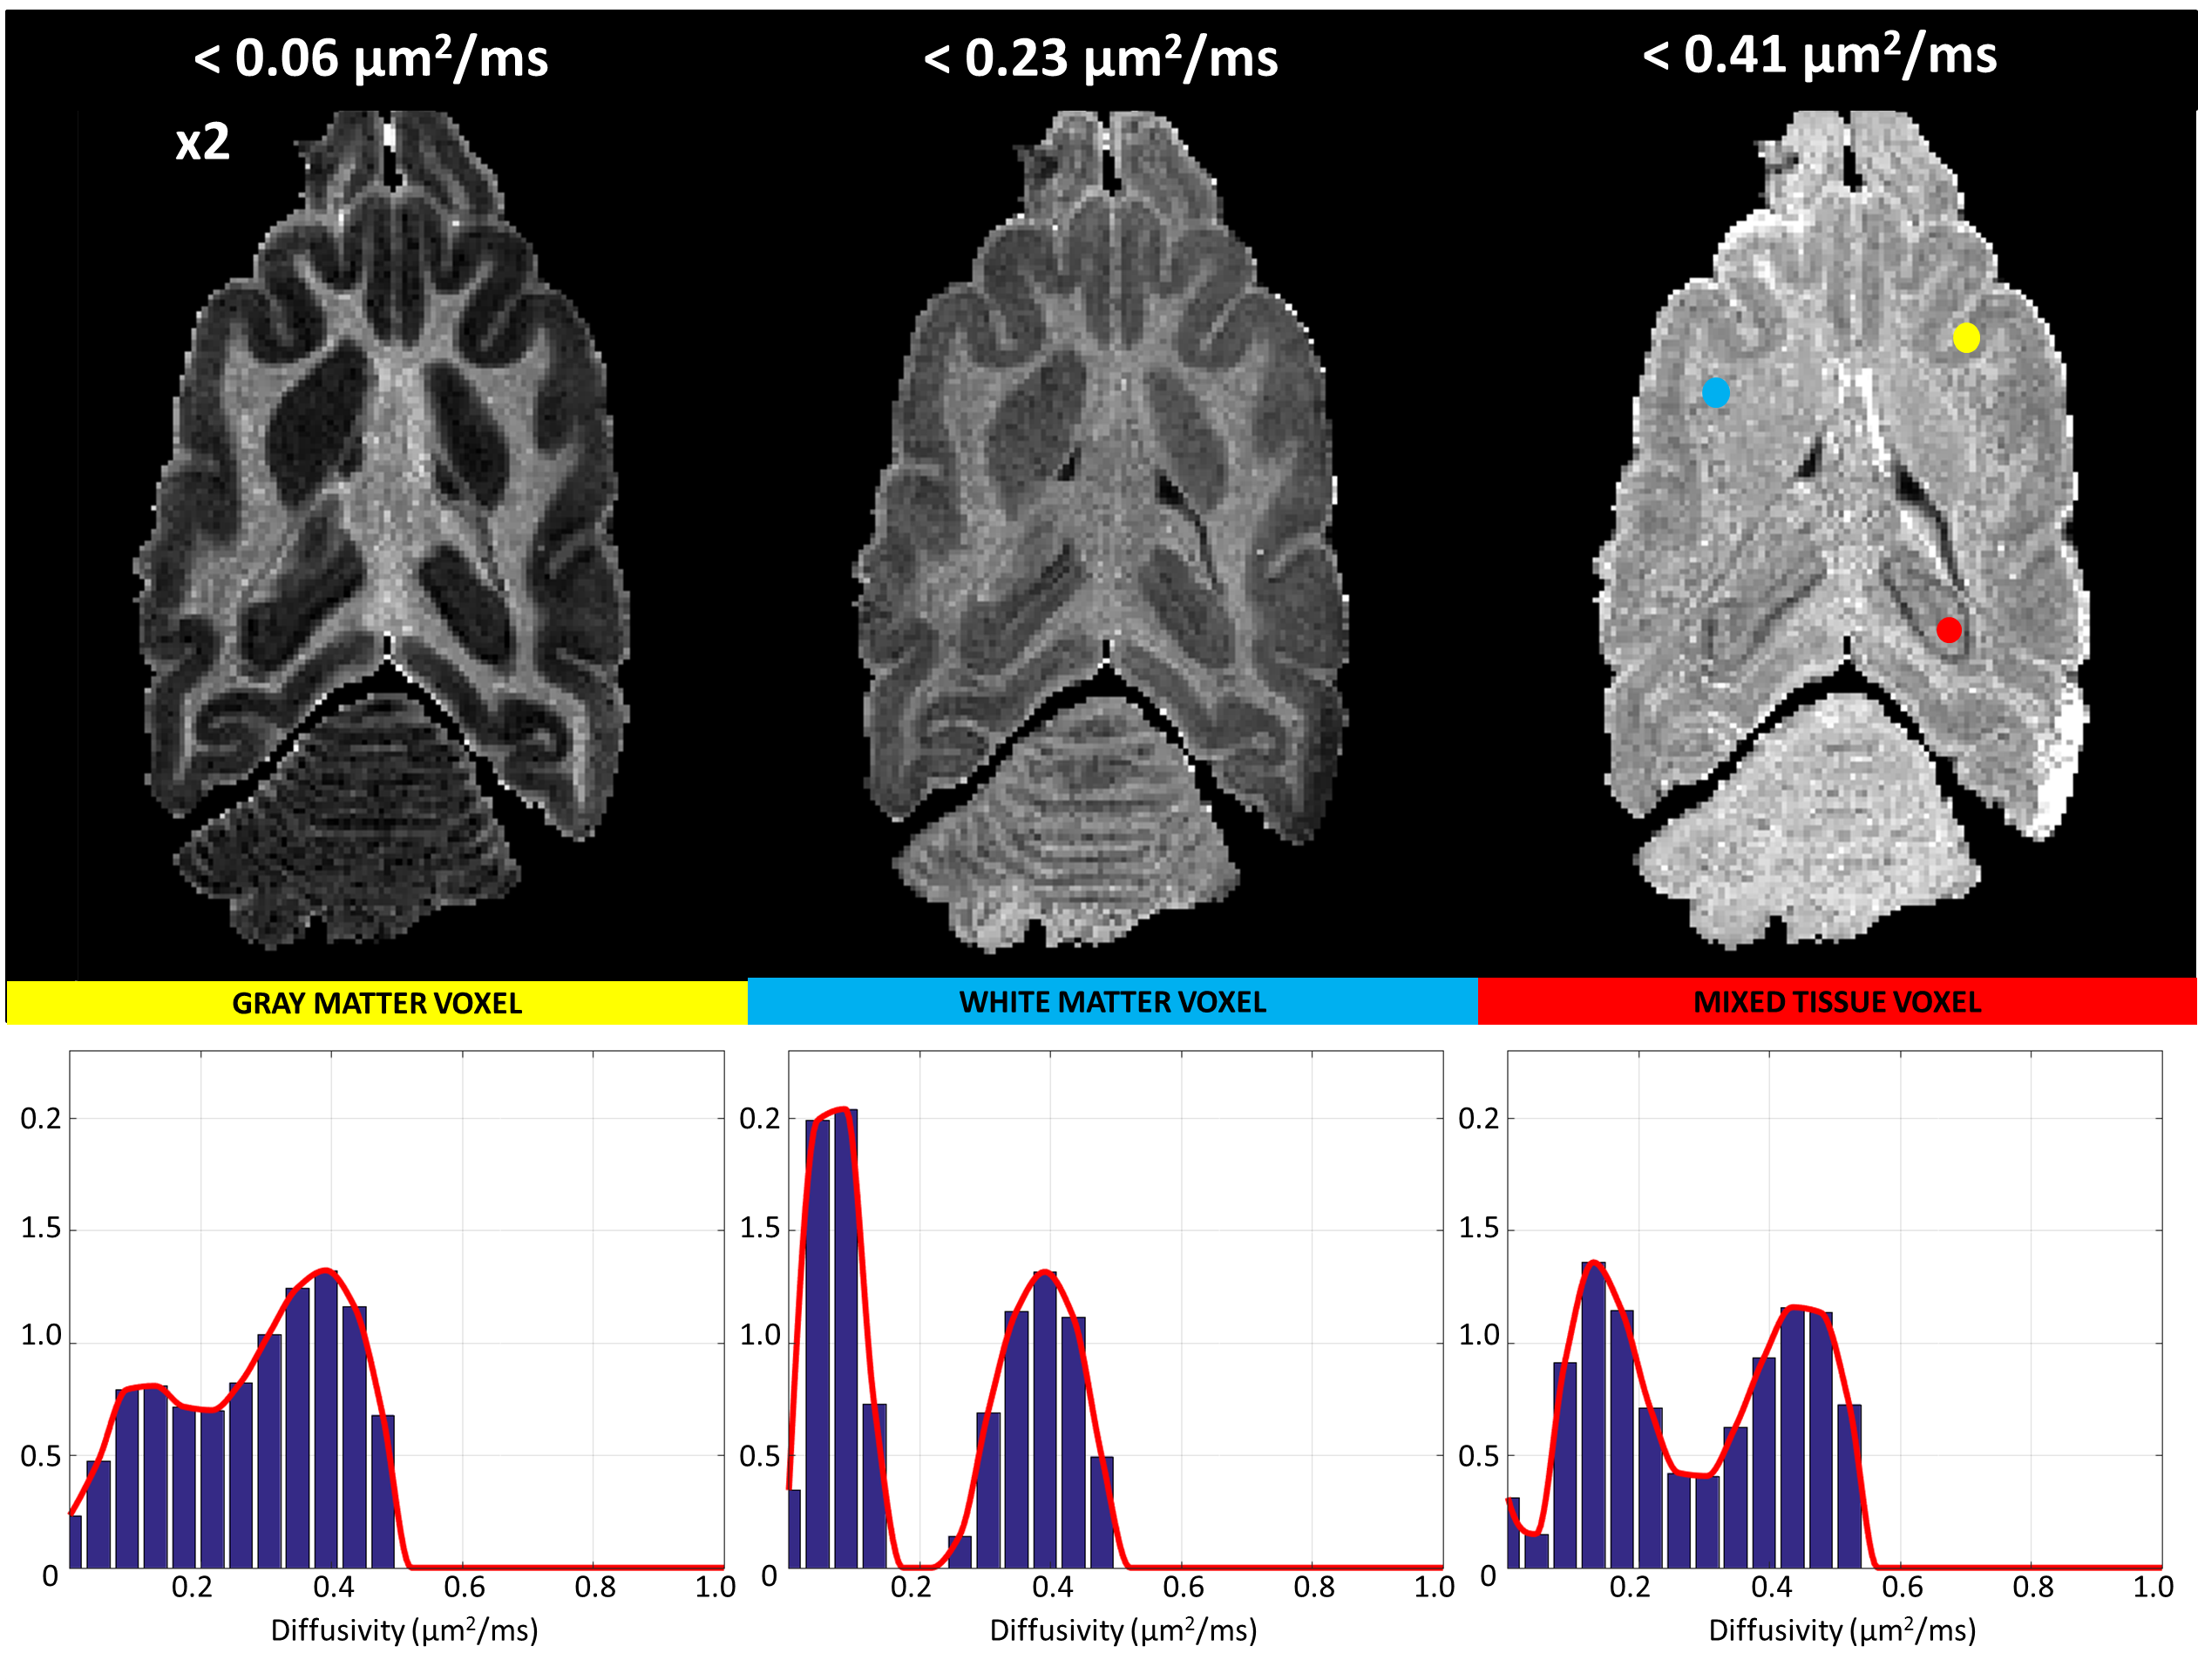
For each voxel, the 1-D spectrum (i.e., probability distribution) of intra-voxel diffusivities was computed by solving the L2 regularization problem with positivity constraints: $${\it{arg}}\min_{{\bf{p}}>0}({\parallel\bf{Mp-s}\parallel}_{2}+{\lambda\parallel{\bf{p}}\parallel}_{2})$$, where $$$\bf{p}$$$ contains the unknown spectral amplitudes at 18 different diffusivity components, or bins, ranging from 0.01 to 3.0 mm2/s, $$$\bf{s}$$$ s is the isotropic diffusion signal decay at the measured b-values, $$$\bf{M}$$$ is the encoding matrix $$$M_{ij}=\int_{D_{j}-\Delta{D}}^{D_{j}+\Delta{D}}e^{-b_{i}D}dD$$$ and $$$\lambda$$$ is a regularization parameter optimized for each voxel3. Computing and displaying the cumulative distribution functions (CDF) from the measured diffusivity spectra probability density function (PDF), $$$\bf{p}$$$, allowed one to intelligibly visualize the sparse 4D spatial-spectral IDRI whole-brain data.
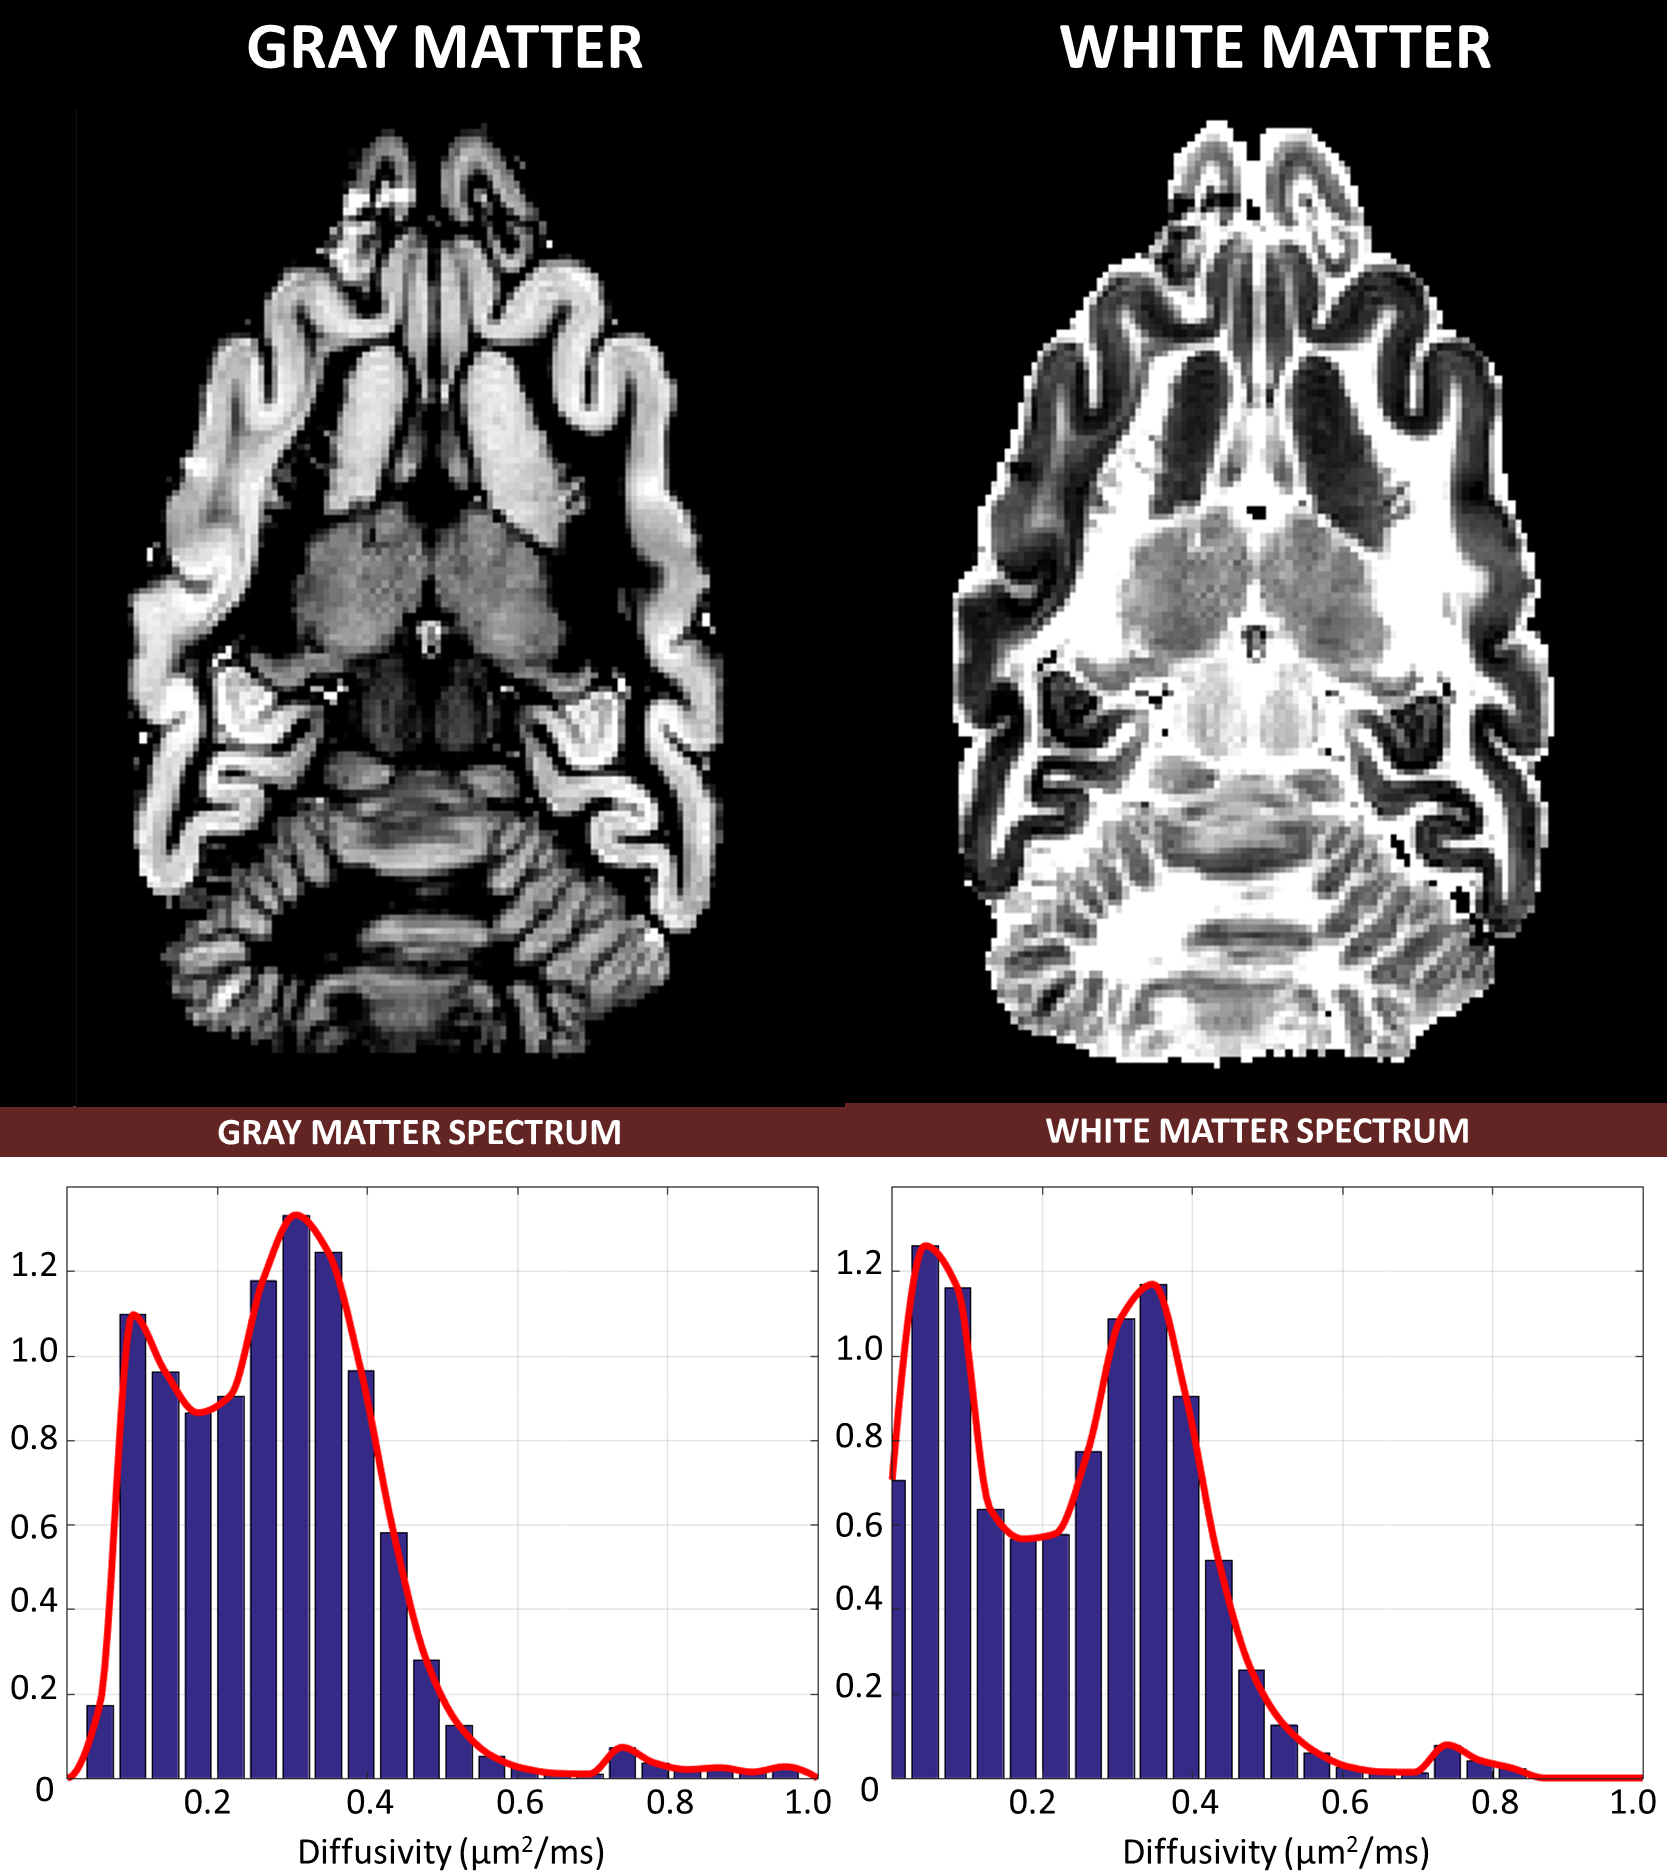
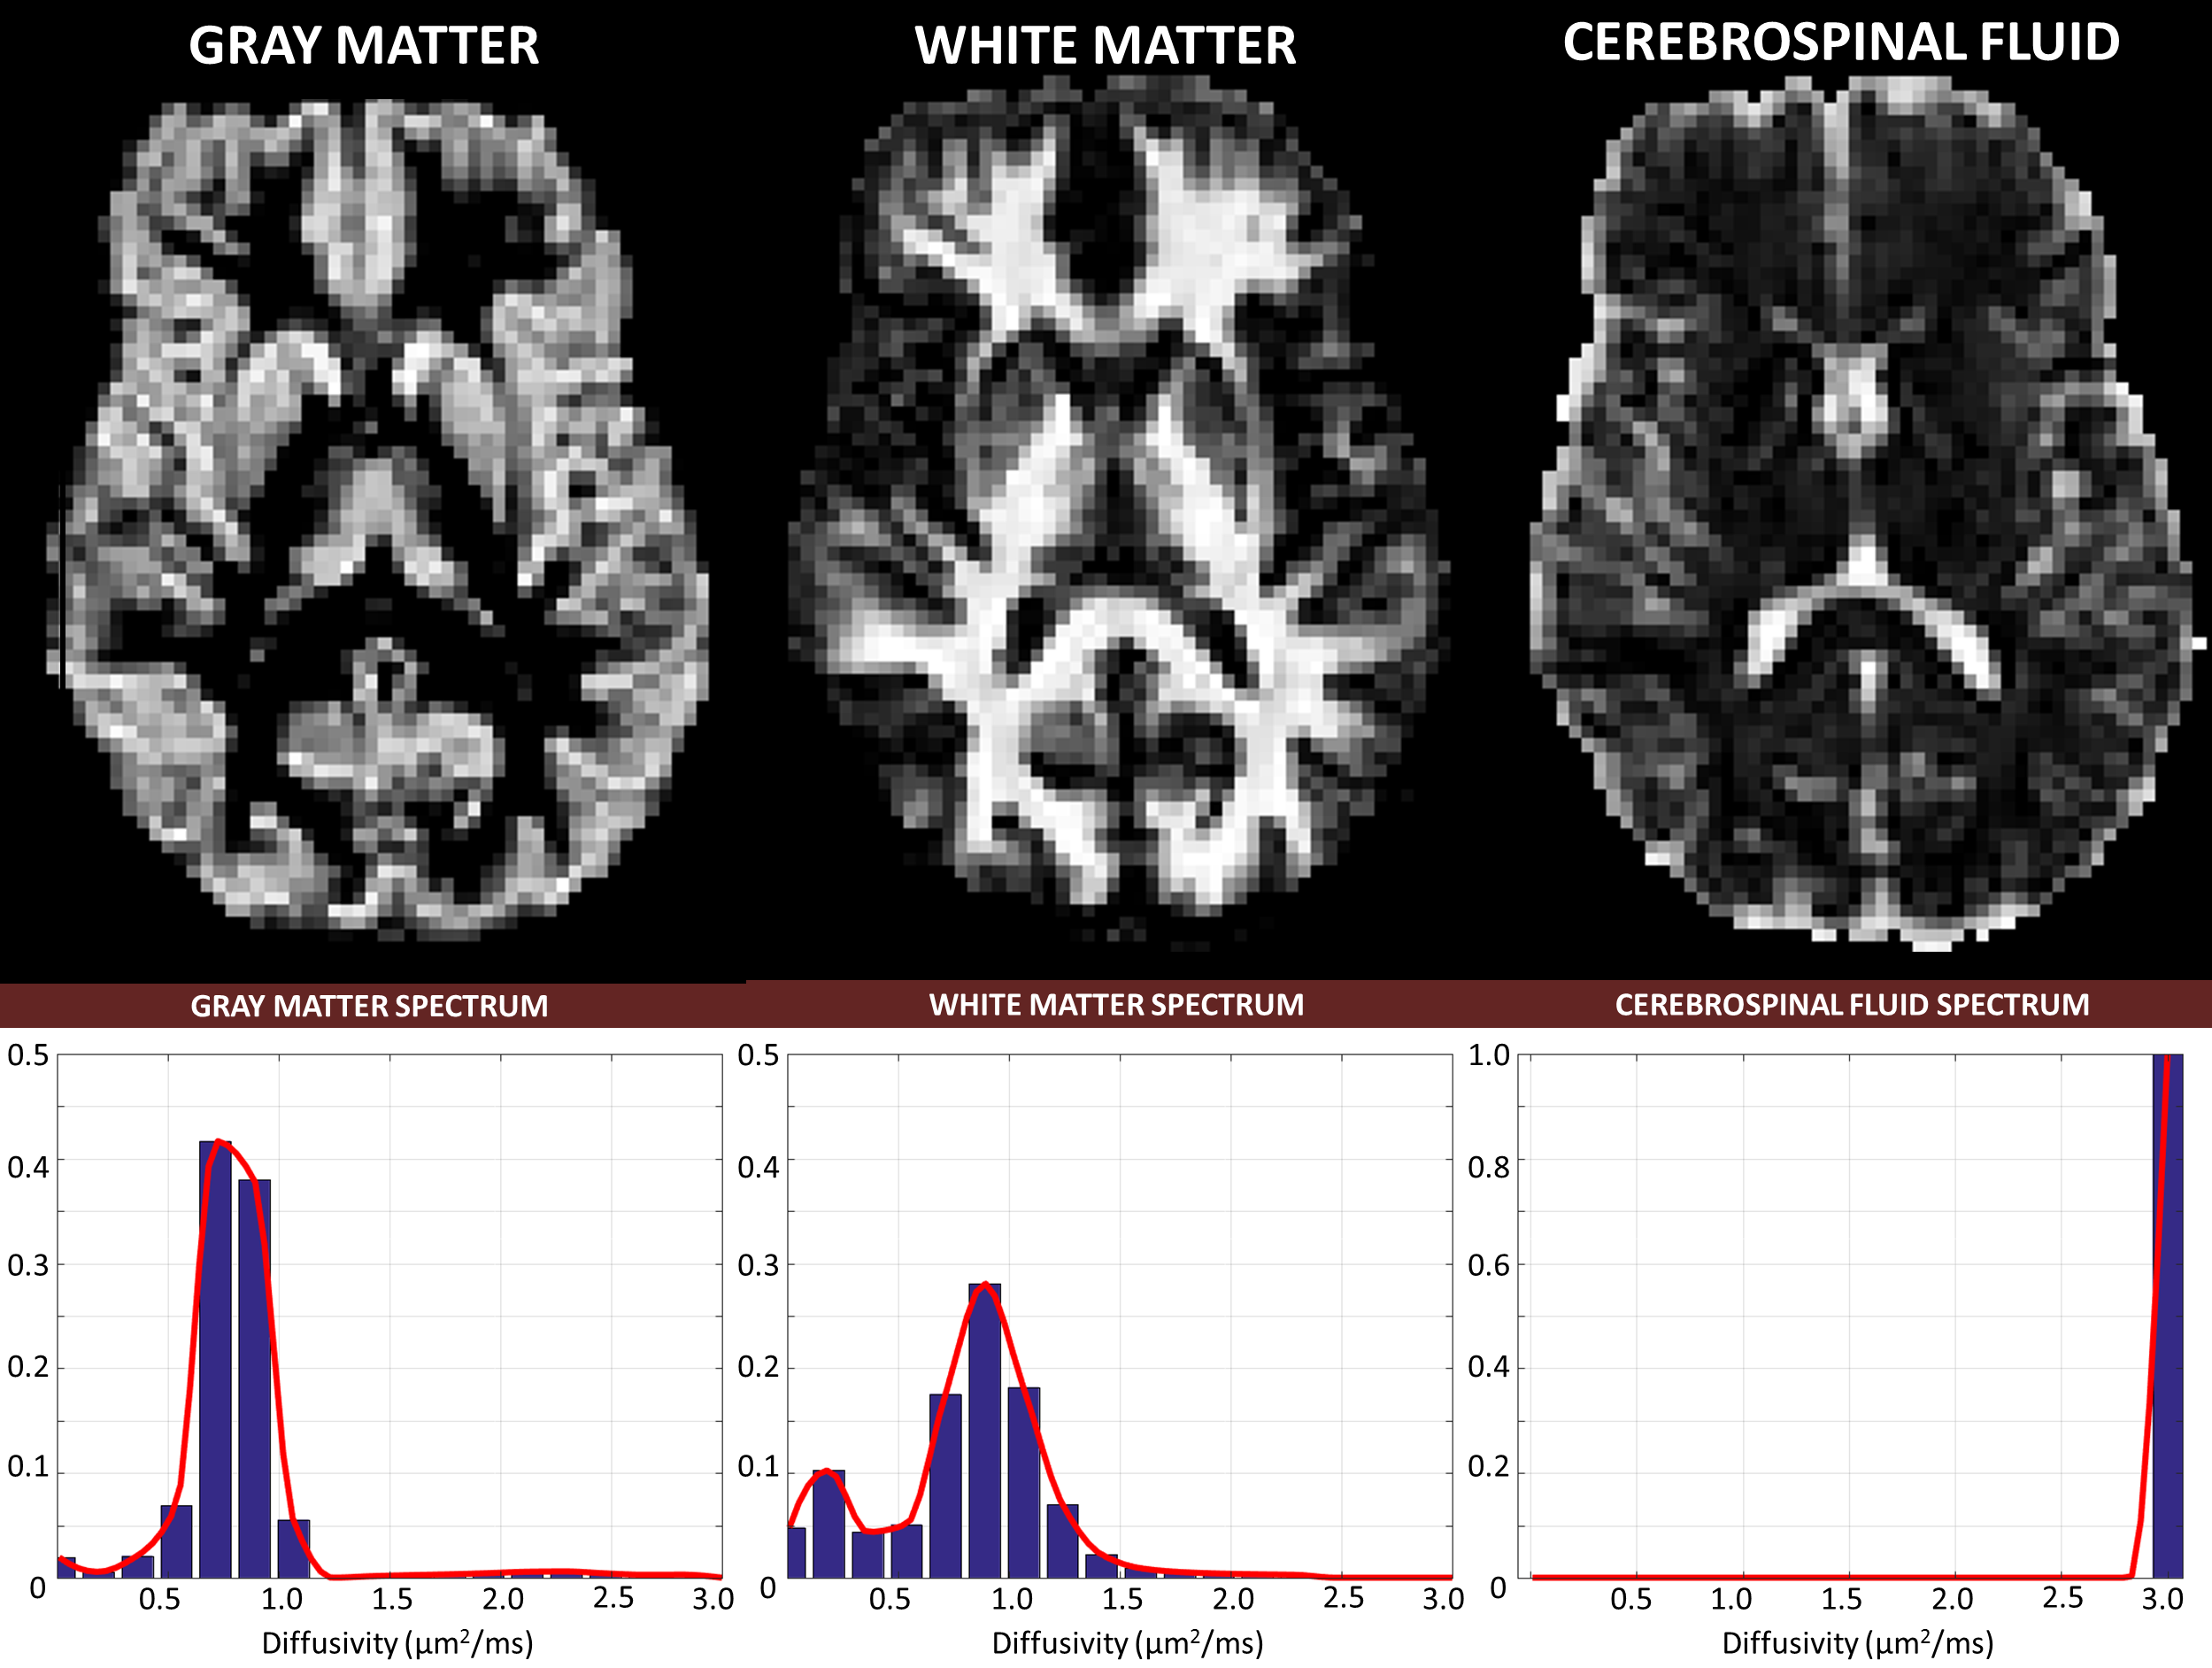
To improve the statistical power of our analysis, we generated regions-of-interest (ROIs) containing cerebrospinal fluid (CSF), white matter (WM), and gray matter (GM) and quantified the average diffusivity spectrum within each ROI: $$$\bf{p_{CSF}}$$$, $$$\bf{p_{WM}}$$$, and $$$\bf{p_{GM}}$$$, respectively. Finally, we reanalyzed the DWI data to compute signal fractions of these “pure” tissue spectra by solving a well-conditioned problem: $${\it{arg}}\min_{{\bf{f}}>0}({\parallel\bf{Tf-s}\parallel}_{2})$$, where $$$\bf{f}$$$ contains the 3 unknown signal fractions associated with pure spectra $$$\bf{p_{j}}$$$, (j=CSF,WM,GM), and matrix $$$\bf{T}$$$ is defined by $$$T_{ij}=\int_{0}^{\infty}e^{-b_{i}D}{\bf{p_{j}}}(D)dD$$$.
Results
The temporal signal-to-noise ratio (SNR) of 1000:1, achieved in our experiment, was sufficient for reliable reconstruction of voxel-wise diffusion spectra with Eq.1 based on numerical Monte-Carlo simulations.
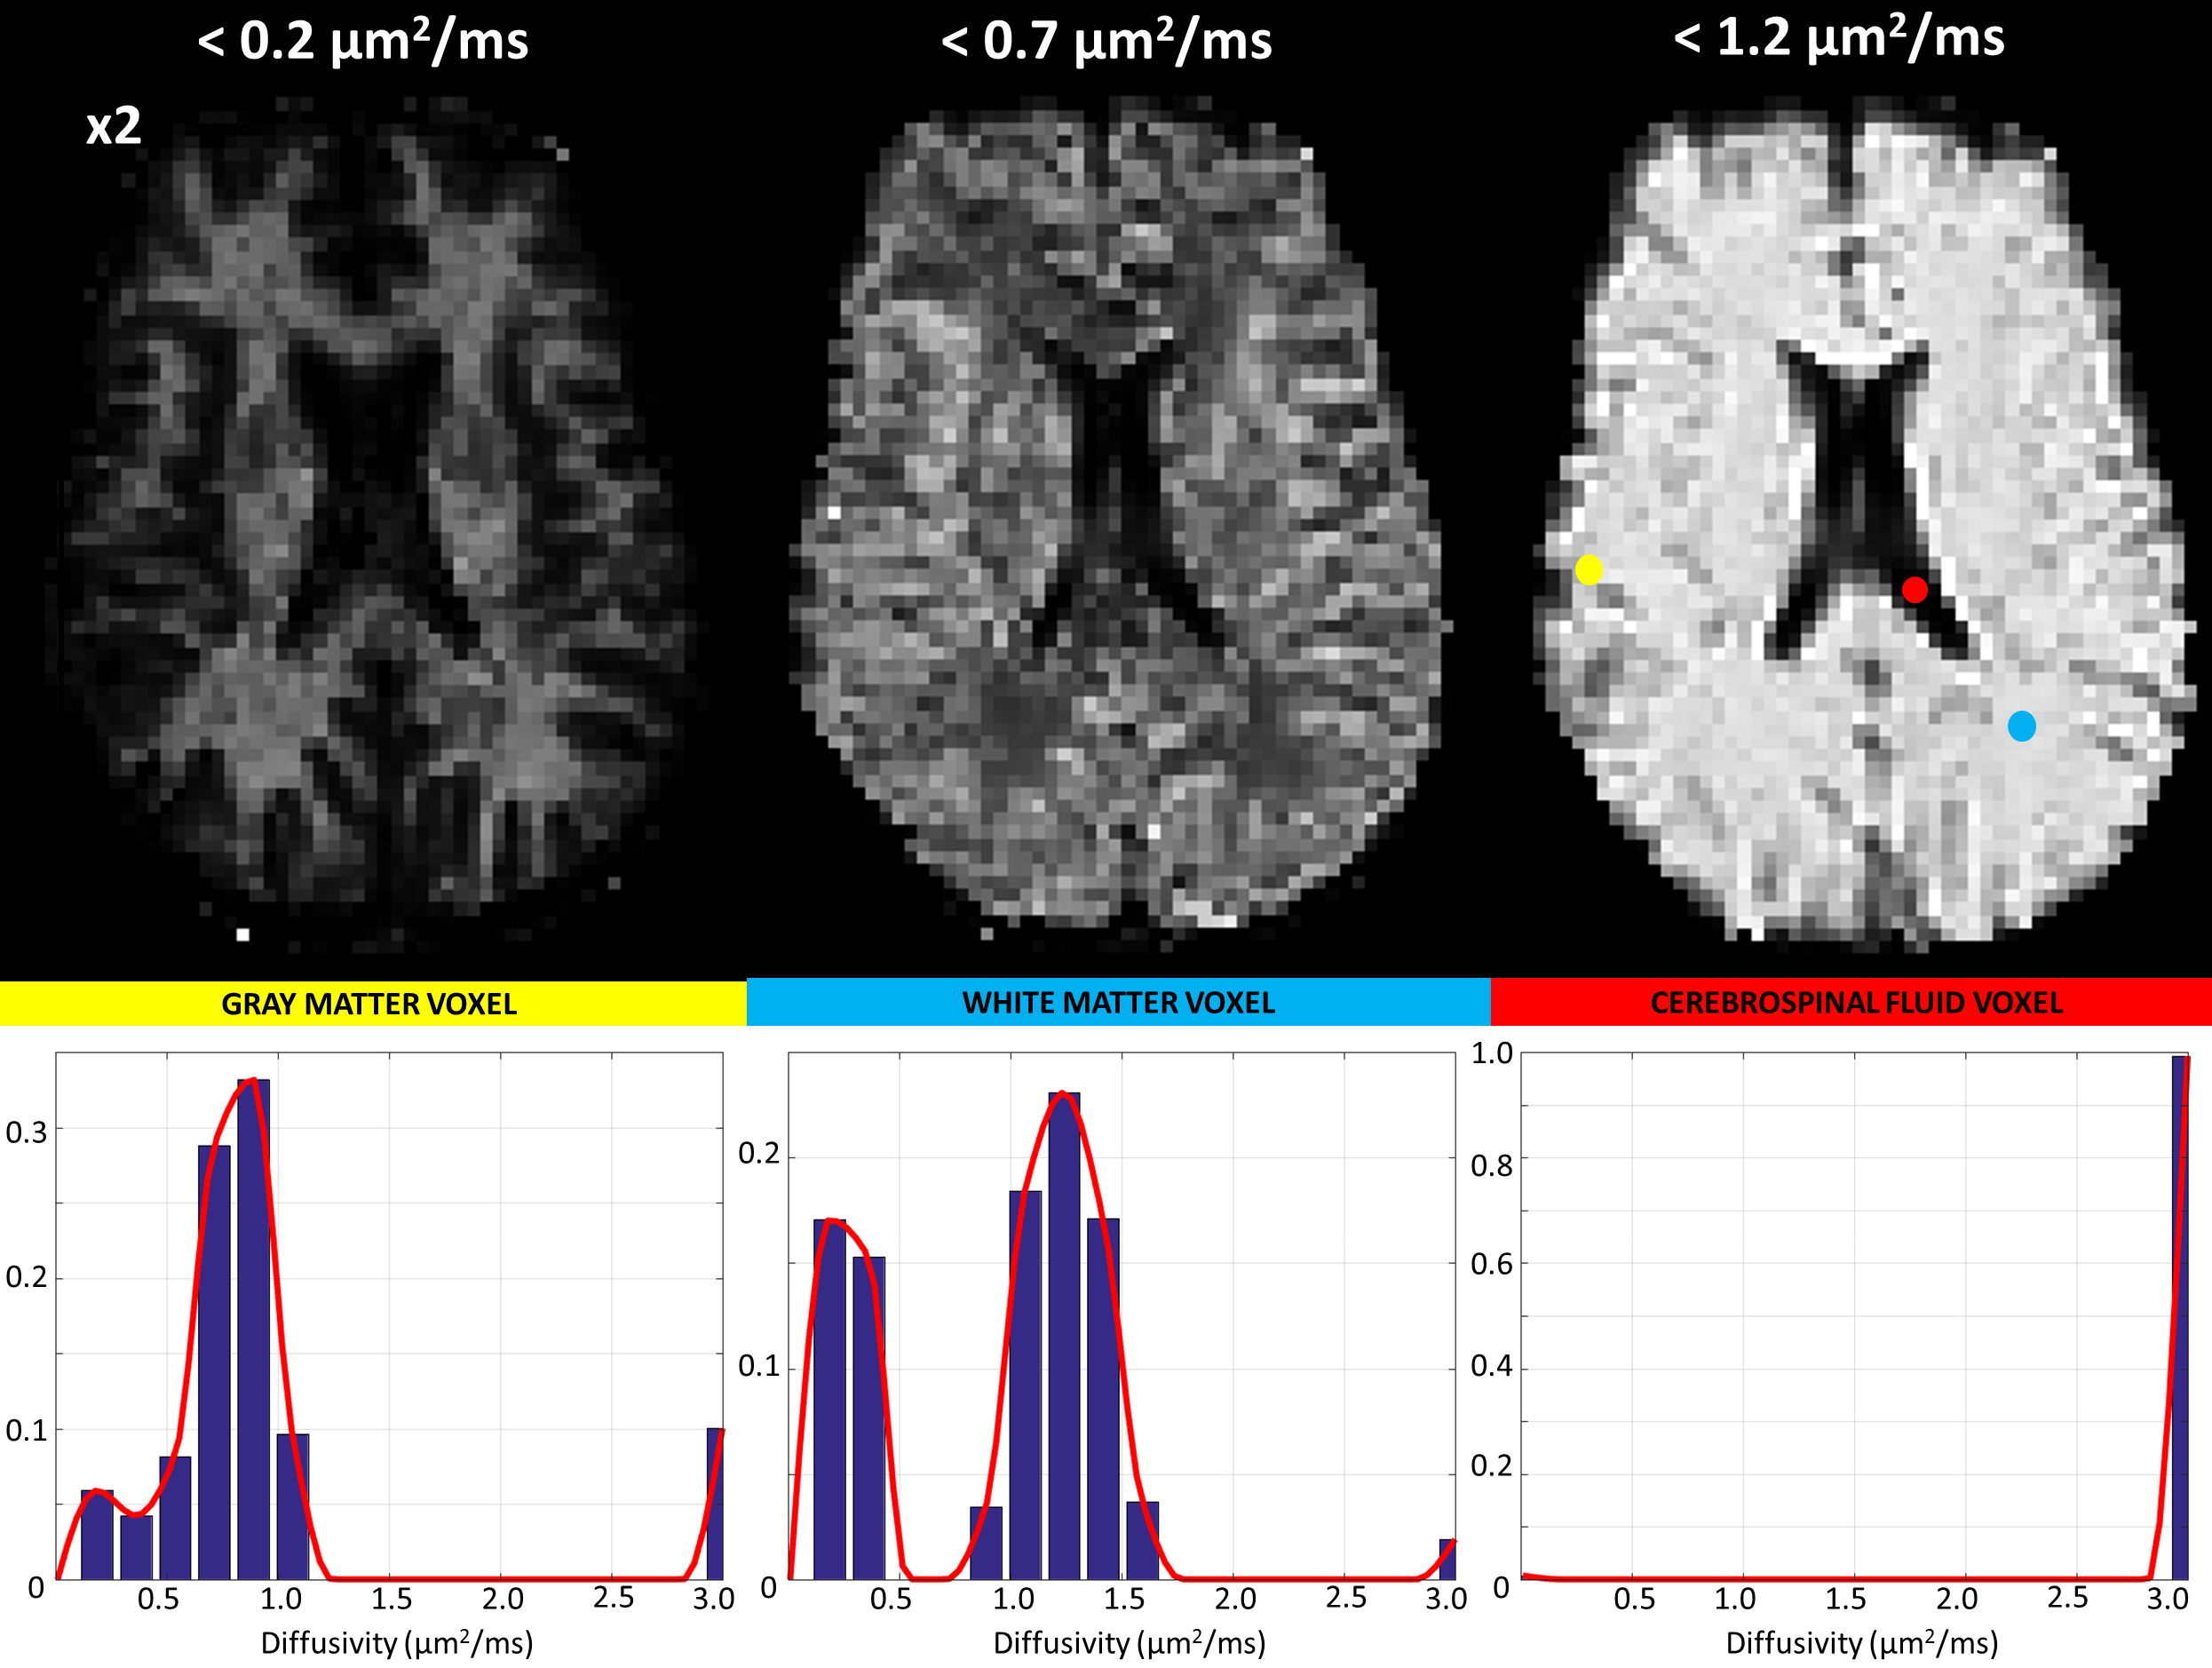
The fixed brain dataset analysis revealed bimodal intra-voxel diffusivity spectra in both GM and WM (Fig.1 and Fig.3). Clinical scans on the other hand, showed a unimodal (single-peak) spectrum in GM and a two-peak distribution in WM (Fig.2 and Fig.4), consistent with previous studies with in vivo animal experiments4,5. Differences between fixed-brain ex vivo and in vivo results may be attributed to disruption of microstructure due to tissue fixation, and/or the absence of active physiological water exchange and transport processes.
The bimodal distributions observed in live WM tissue may reflect the effect of restrictions and/or the presence of distinct cellular/tissue compartments in slow exchange such as between intra- and extra-cellular water. Meanwhile the single broad peak in the GM spectrum may reflect a heterogeneous cell/restriction size distribution, or faster exchange between distinct water pools.
Discussion
While voxel-wise relaxometry estimates (Eq.1) are inherently ill-conditioned, the ROI-averaged relaxometry spectra (Fig.3 and Fig.4) were very robust and reproducible with little dependence on the optimization/regularization strategies. Consequently, the tissue signal fractions derived from re-fitting the DWI data using the ROI-averaged spectra (Eq.2) showed also little dependence on the voxel-wise fitting method. These tissue signal fractions quantify important biologically-specific information indicative of populations with different water mobilities, and could provide new clinical markers for studying and assessing storke, edema, cancer, neurodegenerative disorders, and diseases where water microdynamics would be expected to change.
It should be noted that, especially for clinical studies, additional signal instabilities may arise from patient/physiological motion, Nyquist ghosting, and Gibbs ringing, and may degrade the high SNR. Future studies will address these possible confounds and artifacts, and will quantify the reliability and reproducibility of IDRI in healthy human subjects.
Conclusions
Our findings are consistent with the existing literature on quantifying the orientationally-averaged, or mean apparent diffusion coefficient (mADC)6,7 – one of the most sensitive and eloquent clinical markers – but extends this measurement to provide a comprehensive and quantitative assessment of intra-voxel water mobilities5. The tissue signal fractions generated solely based on orientationally-averaged (isotropic) water diffusion properties may provide biologically-specific clinical and preclinical markers in studying and diagnosing ischemic stroke, tumors and neurodegenerative diseases.Acknowledgements
This work was supported by the Intramural Research Programs of the Eunice Kennedy Shriver National Institute of Child Health and Human Development (NICHD) and the National Institutes of Biomedical Imaging and Bioengineering (NIBIB).
References
1. Avram, A. V., Sarlls, J. E., Hutchinson, E. B. & Basser, P. J. Isotropic-Diffusion Weighted MRI (IDWI) – a novel, efficient clinical method for quantifying orientationally-averaged features of water diffusion in tissues. Magn Reson Med (under review) (2016).
2 Pierpaoli, C. et al. in ISMRM 18th Annual Meeting. 1597.
3 Mitchell, J., Chandrasekera, T. C. & Gladden, L. F. Numerical estimation of relaxation and diffusion distributions in two dimensions. Progress in Nuclear Magnetic Resonance Spectroscopy 62, 34-50, doi:10.1016/j.pnmrs.2011.07.002 (2012).
4 Ronen, I., Moeller, S., Ugurbil, K. & Kim, D.-S. Investigation of multicomponent diffusion in cat brain using a combined MTC-DWI approach. Magn Reson Imaging 24, 425-431, doi:10.1016/j.mri.2005.12.022 (2006).
5 Pfeuffer, J., Provencher, S. W. & Gruetter, R. Water diffusion in rat brain in vivo as detected at very large b values is multicompartmental. Magn Reson Mater Phy 8, 98-108 (1999).
6 Basser, P. J., Mattiello, J. & LeBihan, D. MR diffusion tensor spectroscopy and imaging. Biophys J 66, 259-267, doi:10.1016/S0006-3495(94)80775-1 (1994).
7 Pierpaoli, C., Jezzard, P., Basser, P. J., Barnett, A. & Di Chiro, G. Diffusion tensor MR imaging of the human brain. Radiology 201, 637-648 (1996).
Figures