0838
Disentangling in two dimensions in the living human brain: Feasbilty of relaxometry-diffusometry using ultra-strong gradients1CUBRIC, Cardiff University, Cardiff, United Kingdom, 2MGH/HST Martinos Center for Biomedical Imaging, Harvard Medical School, Boston, MA, United States
Synopsis
Combining multiple, complementary contrasts into one analysis will yield deeper understanding of white matter physiology than using diffusion MRI (dMRI) alone. Varying TE in a PGSE sequence would allow for the exploration of D-T2 spectra in tissue. However, typical hardware and time constraints render the acquisition of such diffusion/relaxation spectra in the living human impractical. In this work, we explore how 300 mT/m gradients of a Connectom scanner could help in further investigating 1) the reported TE dependency of DTI parameters and 2) D-T2 spectra in the living human brain.
Purpose
An emerging zeitgeist in microstructural imaging, as evidenced by discussion at the recent ISMRM diffusion workshop, is that combining multiple, complementary contrasts (e.g. axon and myelin metrics) into one analysis will yield deeper understanding of white matter physiology than using diffusion MRI (dMRI) alone. Where typically only gradient direction and strength are varied in microstructural dMRI experiments, resolving different tissue components is likely facilitated by studying the signal attenuation as a function of more experimental variables. Varying TE would allow for the exploration of D-T2 spectra in tissue1,2,3.
Recently, a TE-dependence of DTI parameters was observed in monkey brain, invoking explanations of compartment-specific T24. However, a similar pattern was not seen in the rat brain5 – bringing into question whether this is a global phenomenon of neural tissue, whether it would consistently be seen in the human brain6, and whether other mechanisms might be at play (e.g. SNR effects and water exchange). However, typical hardware and time constraints render the acquisition of such diffusion/relaxation spectra in the living human impractical: the long diffusion pulses limit the shortest TE and largest b-value that can be used while maintaining sufficient SNR. In this work, we explore how 300 mT/m gradients of a Connectom scanner could help in further investigating 1) the observed TE dependency of DTI parameters and 2) D-T2 spectra in the living human brain.
Methods
In vivo human data:
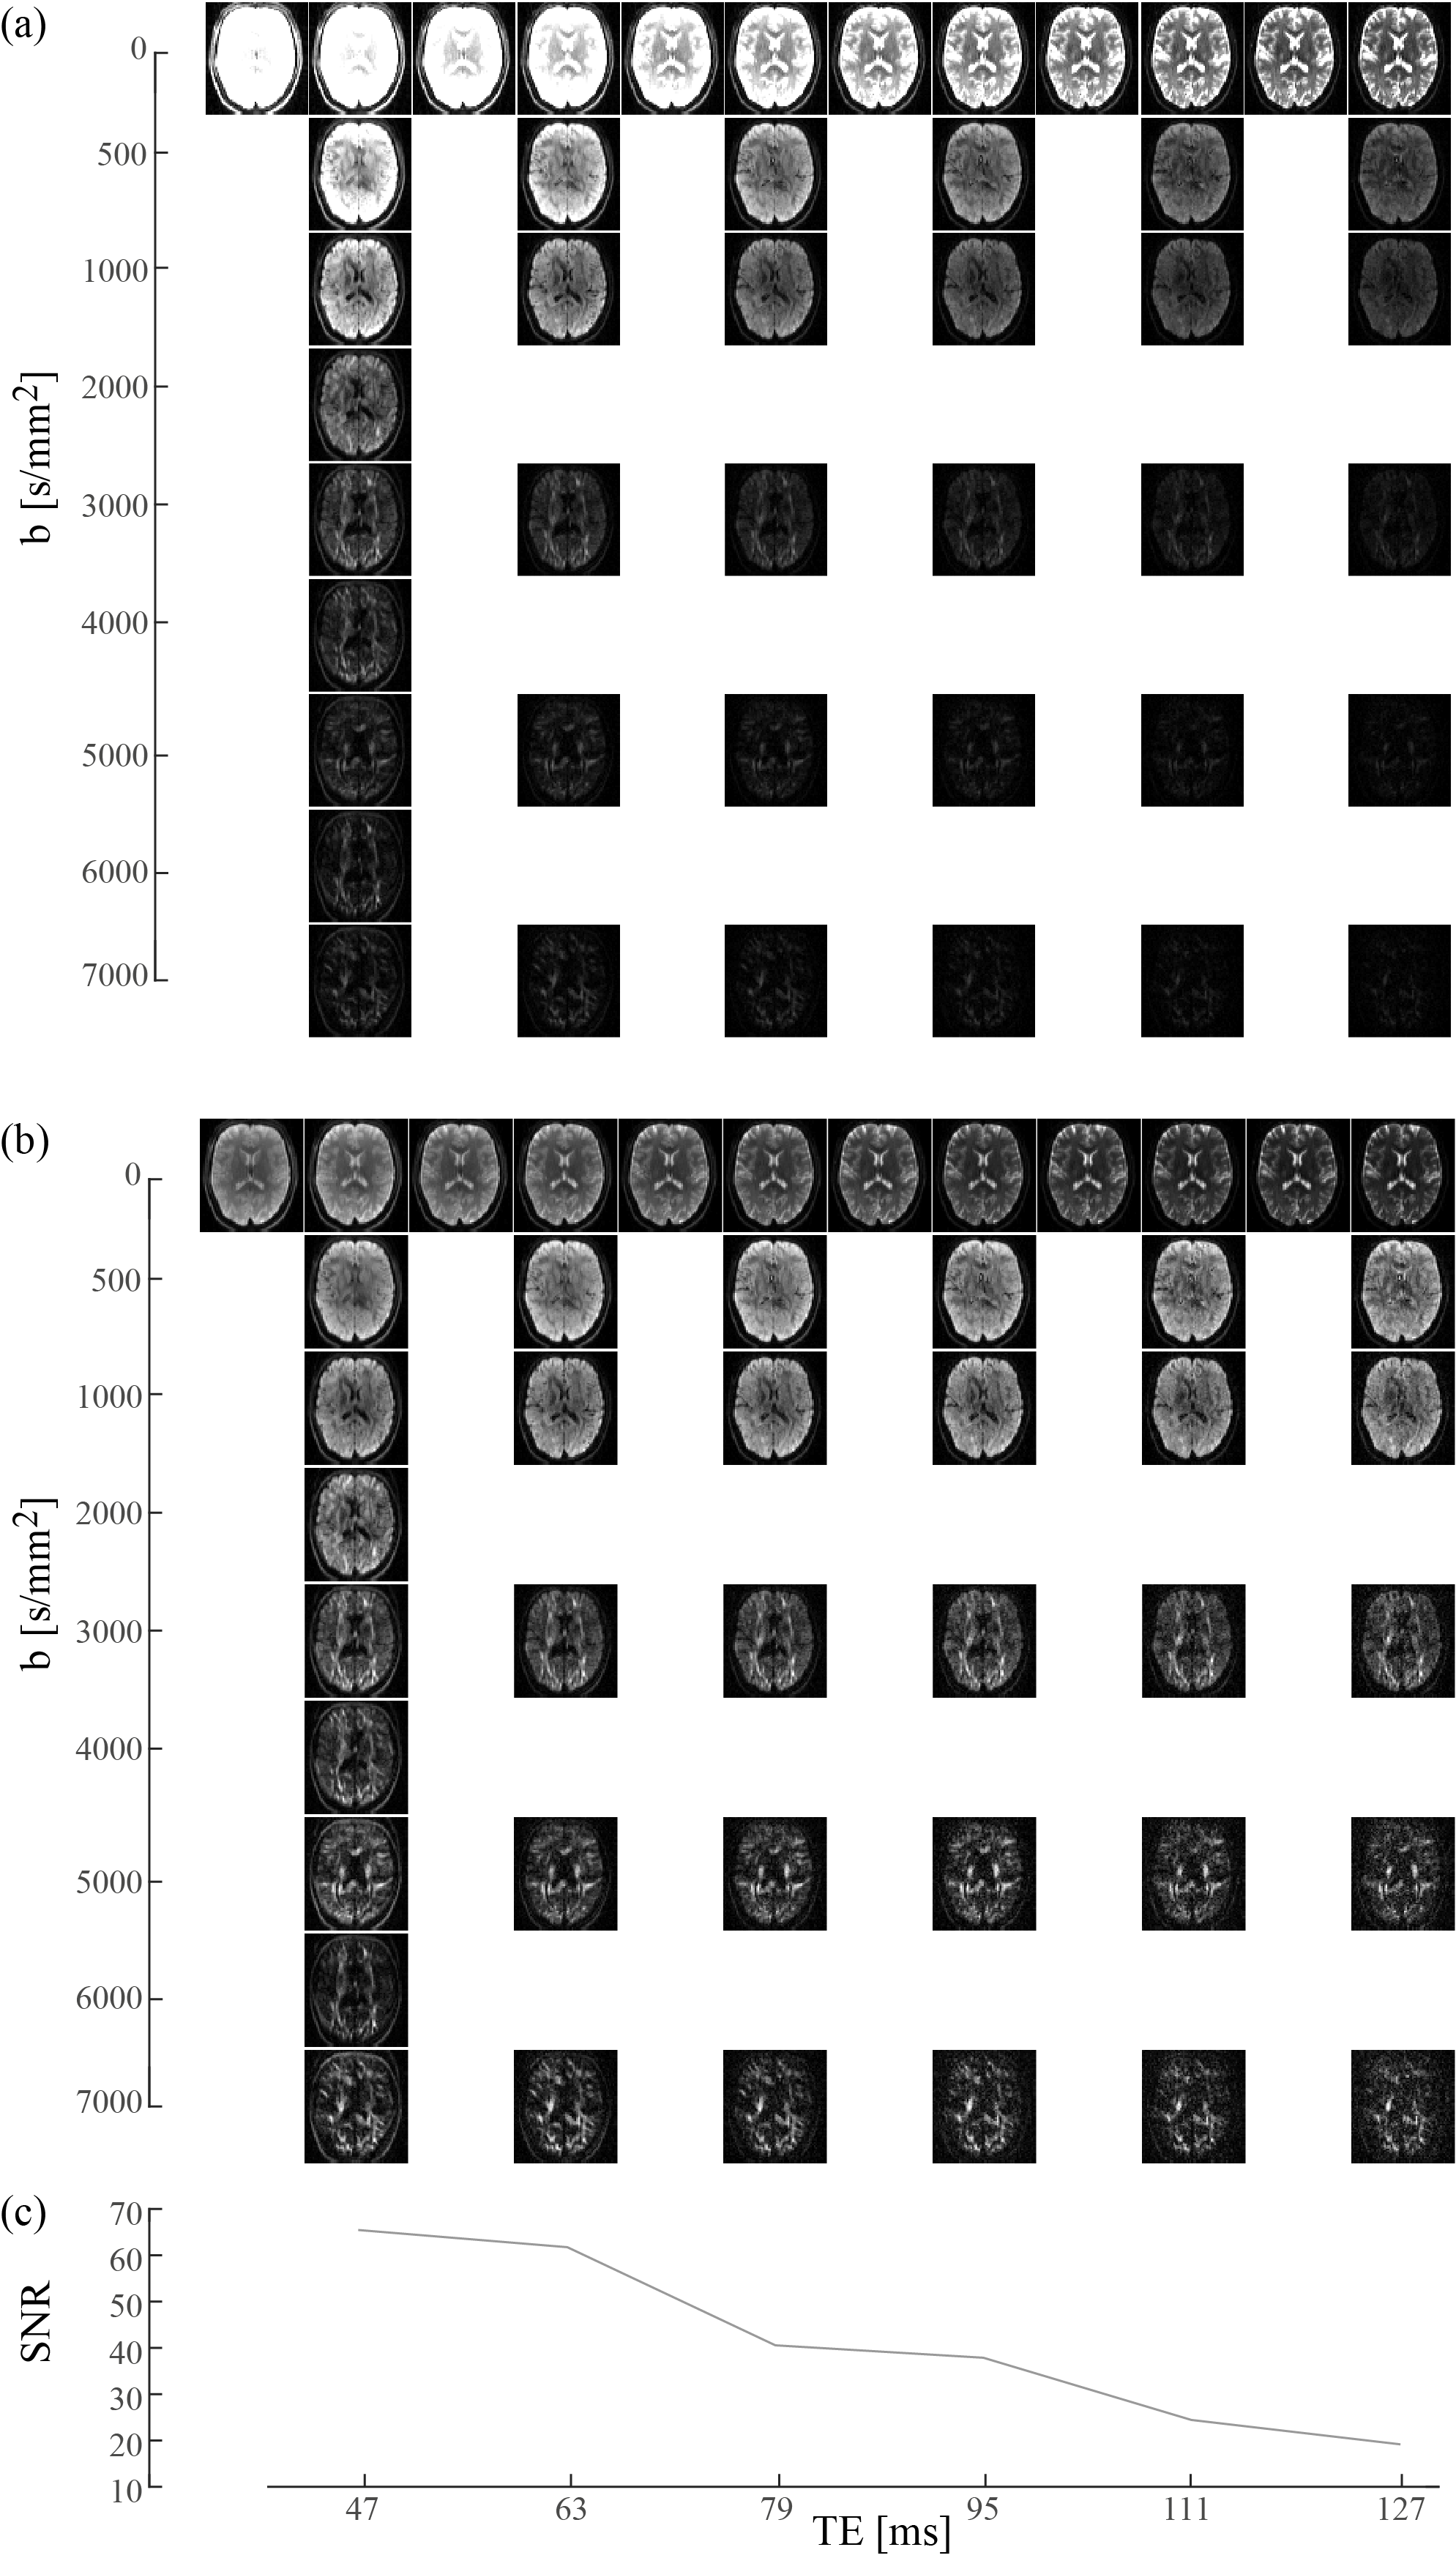
A dataset was acquired with 30 directions and one b0 image per shell (Delta=22ms, delta=8ms); b=[500,1000,2000,3000,4000,5000,6000,7000]s/mm2 for the lowest TE possible (47ms with multiband=2) and b=[500,1000,3000,5000,7000]s/mm2 until maxTE=127ms in steps of 16ms. Additional b0 images were acquired with minTE=39ms (Fig.1).
Simulations:
1) Dependency of DTI on TE: To investigate whether TE dependency could be caused by noise, WM signal was simulated from an FA=0.7 tensor (b=[500,1000]s/mm2) and T2 =70ms. Rician noise was added with SNR defined on the b0 image with the shortest TE.
2) Feasibility of estimating D-T2 spectra: subsets of the b-TE space were simulated for a configuration mimicking the diffusion process perpendicular to fibers: non-exchanging compartments with T2=[80,80,15]ms, D=[0.08,0.9,0.1]$$$\mu$$$m2/ms, volume fraction=[0.35,0.45,0.2] representing intra-axonal, extra-axonal, and myelin components respectively6,7. Noise was added as in 1).
Processing:
Real data were corrected for subject motion and distortions using FSL eddy8.
1) To investigate TE dependency, DTI was fitted for every TE using WLLS on the b=[500,1000]s/mm2 shells9.
2) To investigate the feasibility of reconstructing D-T2 spectra, the mean signal in the plane spanned by the second and third eigenvector (estimated from the fit in 1)) was extracted for each b-value in an ROI containing the posterior limb of internal capsule (PLIC). This mean signal can be written as Fredholm integral of the first kind:
$$M(TE,b)=\int \int F(T2,D)K1(TE,T2)K2(b,D)dT2 dD$$
with kernels $$$K1(TE,T2)=exp(-TE/T2)$$$ and $$$K2(b,D)=exp(-bD)$$$, discretized to $$$M=KF$$$ where vector $$$M$$$ contains the signal, $$$K$$$ is the dictionary with 50 diffusivities and 50 T2-values and $$$F$$$ is a vector representing the spectrum1,2,11. Elastic net regularization with positivity constraint was used to estimate F, i.e. $$$min_{F>=0} 0.5||M-KF||_2^2+ \lambda 1||F||_1+0.5 \lambda 2||F||_2^2$$$10.
Results
Fig. 1 shows an overview of the acquisitions, there is still signal present at the highest b-value and TE.
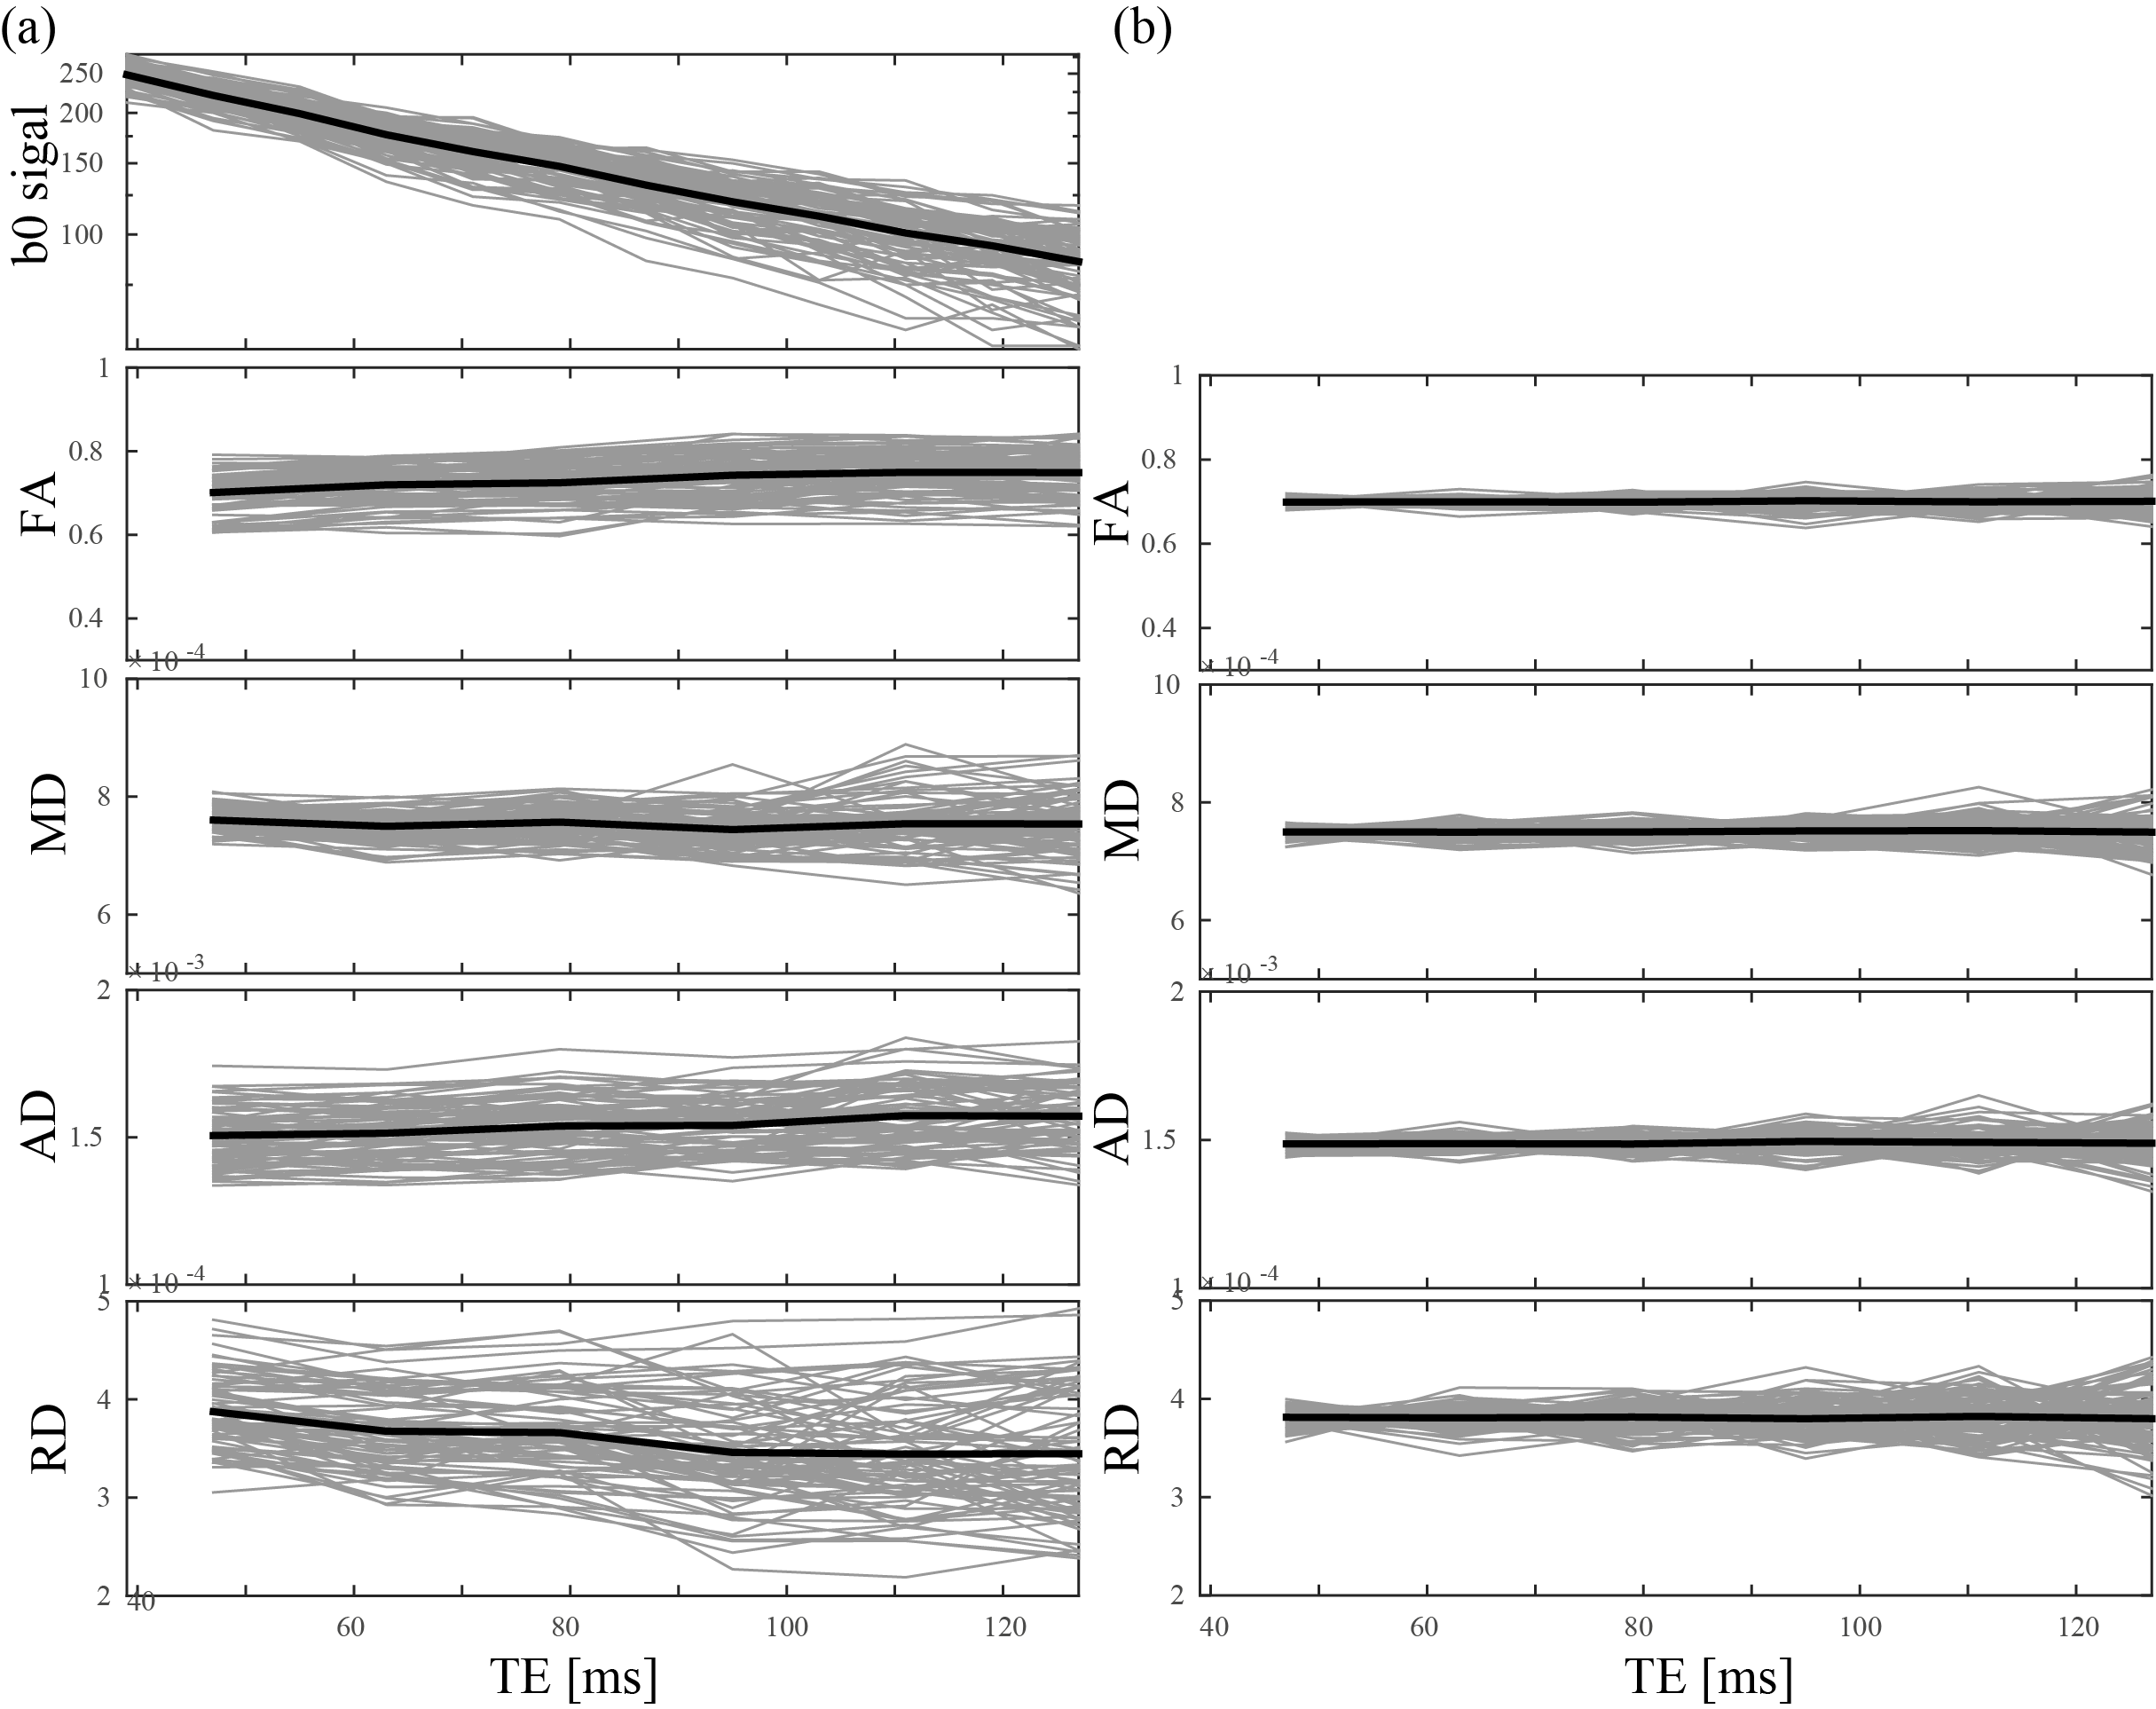
Fig. 2a shows a dependency of estimated DTI features in the PLIC as function of TE in real data. A paired t-test was used to compare FA, AD, RD, and MD differences at minTE and maxTE revealing a highly significant effect of TE for the former three. (p<[10-23,10-12,10-13 respectively). For the simulations looking solely at noise (Fig. 2b) the trend is not evident and all differences are not significant (p>0.77).
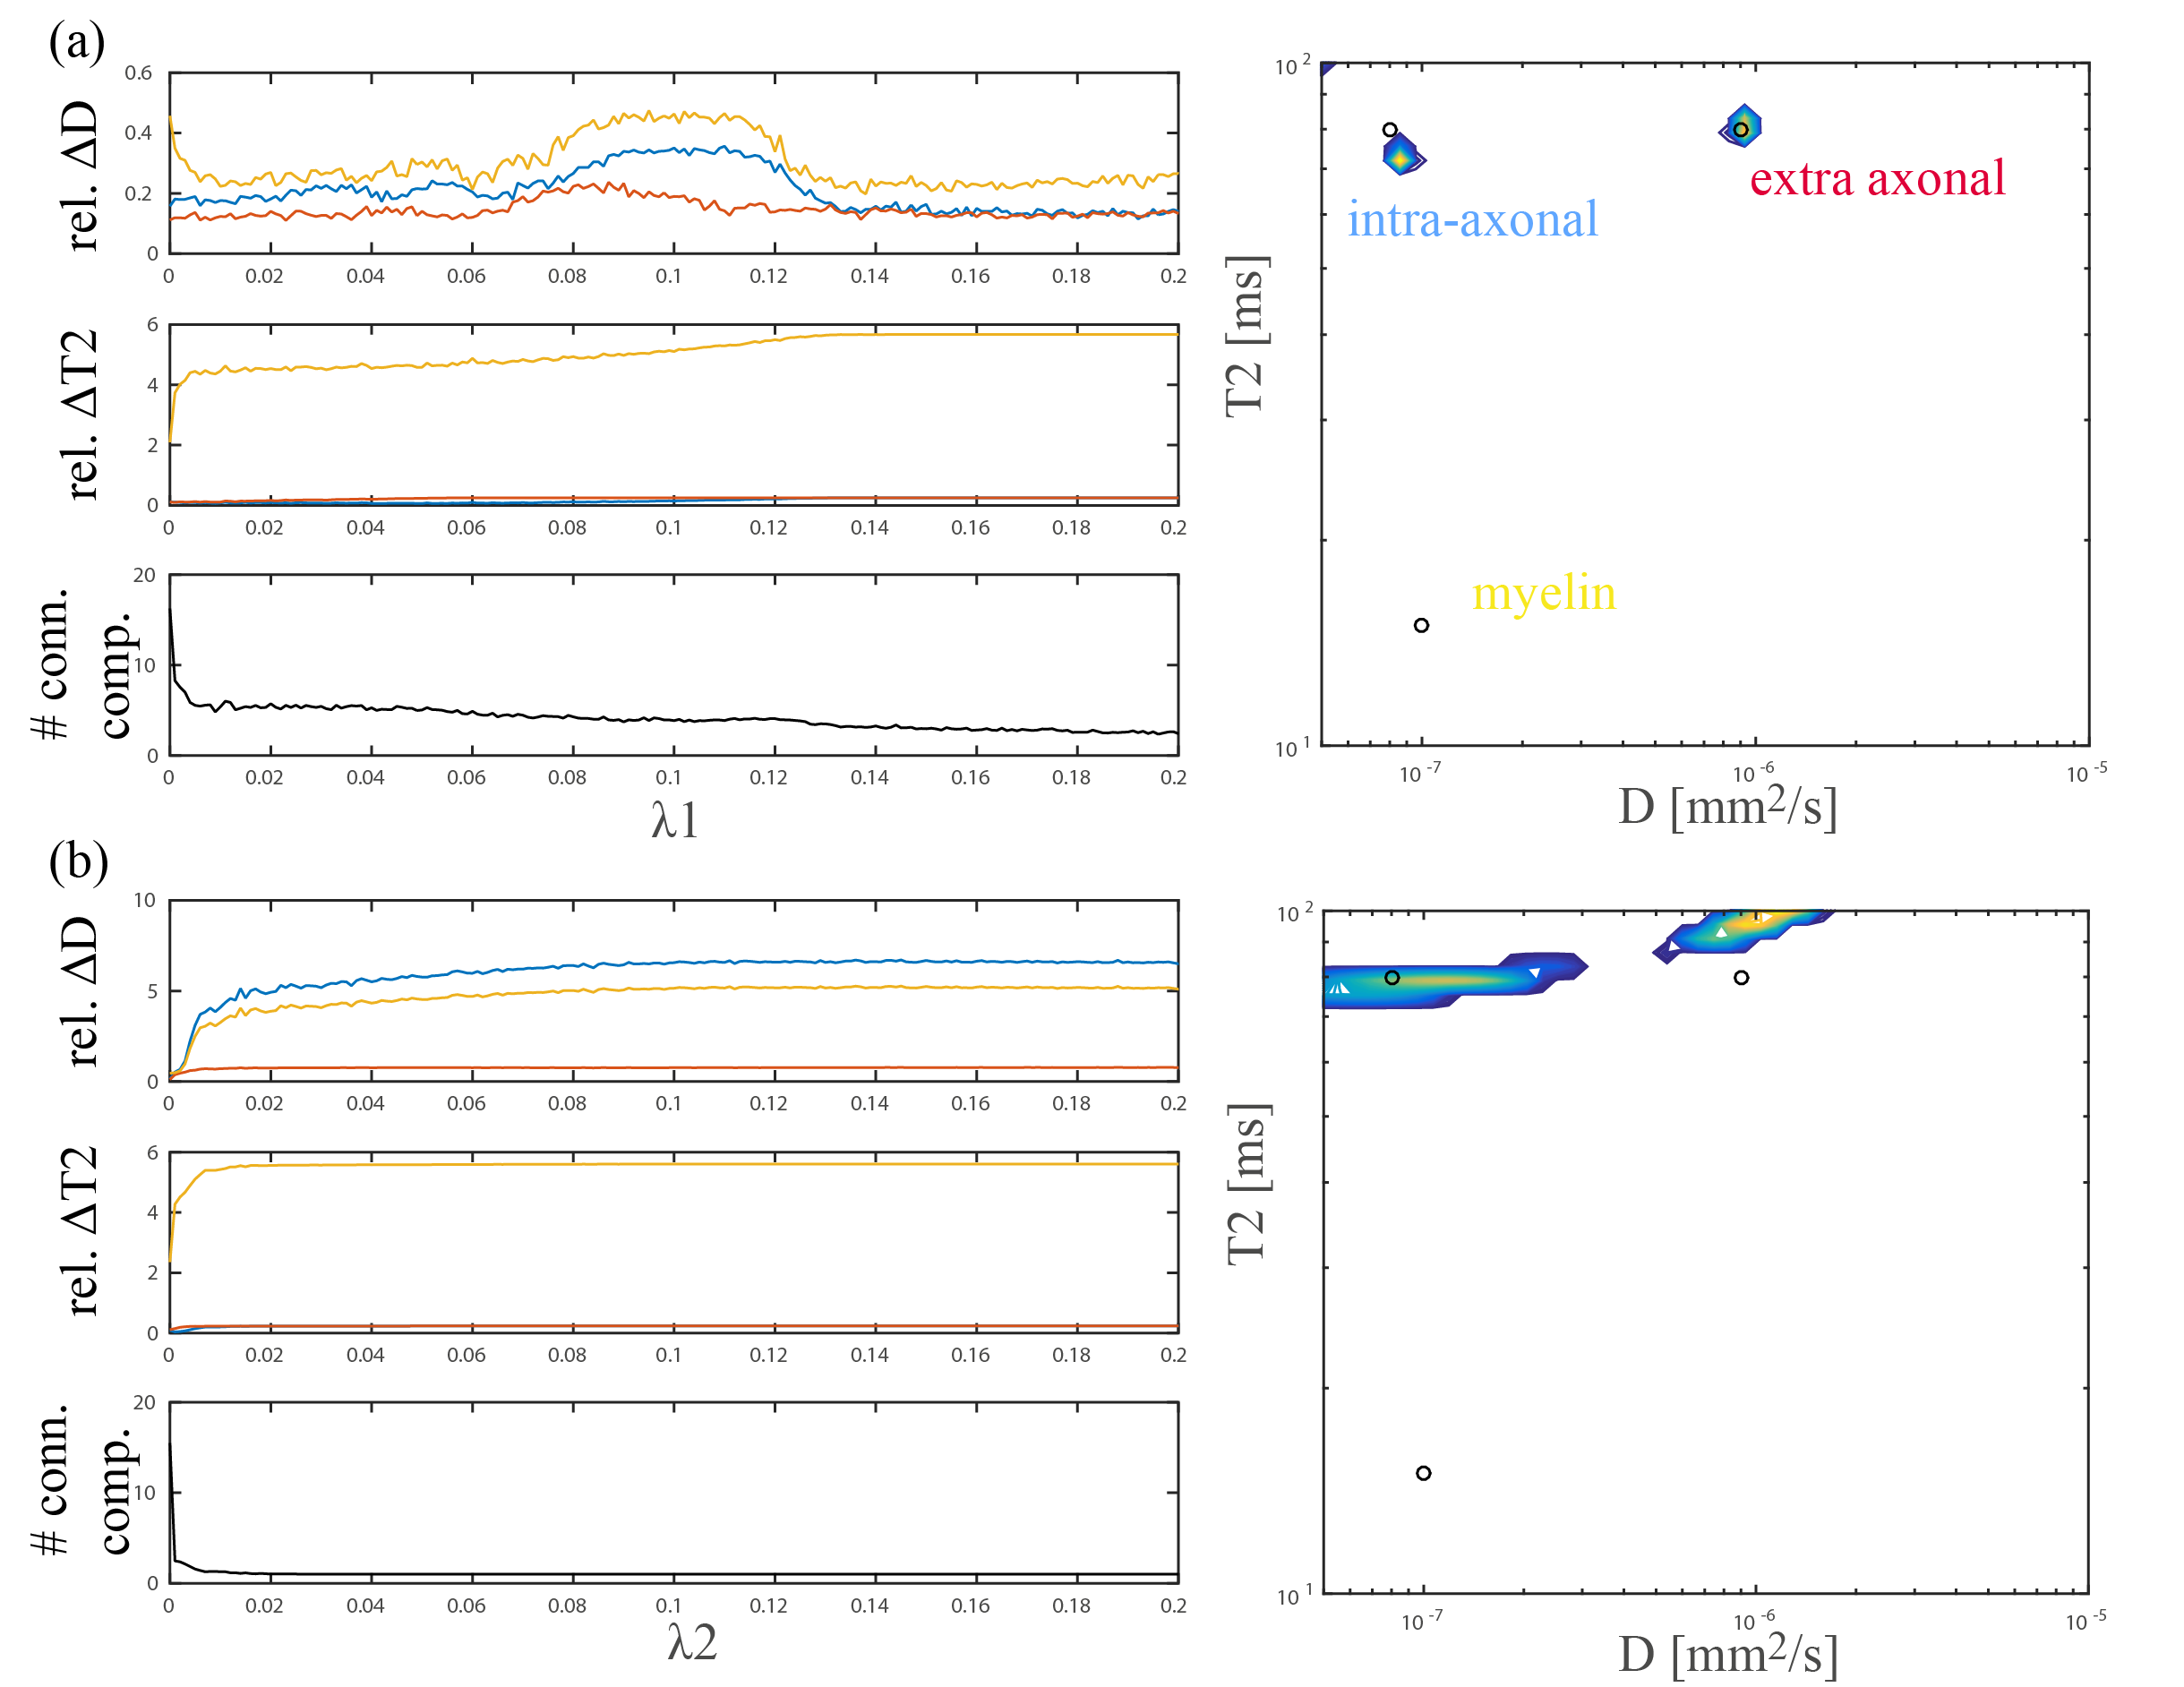
Fig. 3 shows the mean relative error of D-T2 estimates for each compartment as function of the regularization parameters (100 noise iterations). Based on this we choose l1 regularization with $$$\lambda 1$$$ = 0.003 for further analysis. While detecting the intra and extra axonal component seems feasible (spectra on the right), myelin is challenging.
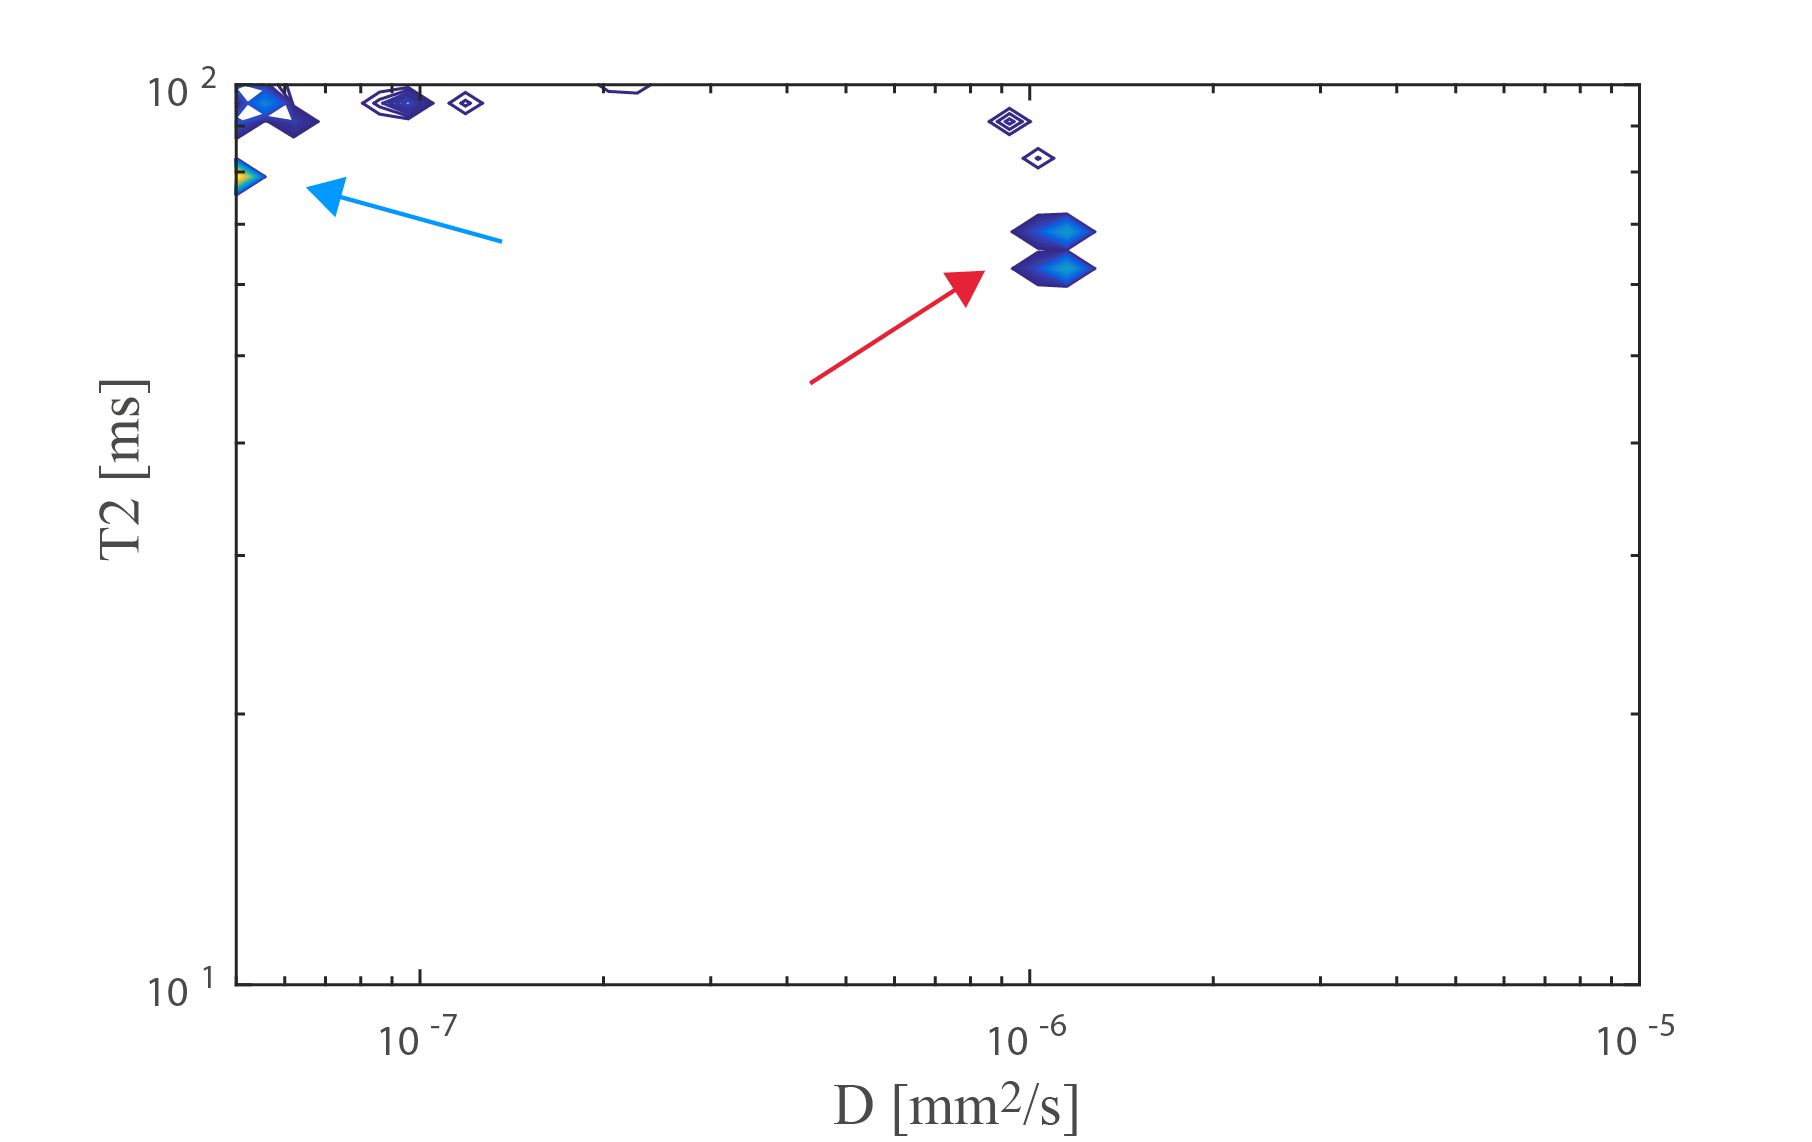
Fig. 4 shows an estimated D-T2 spectrum in the PLIC perpendicular to the estimated fiber direction, revealing one compartment with [T2,D]≈[80ms,0$$$\mu$$$m2/ms] and one with [T2,D]≈[65ms,1$$$\mu$$$m2/ms], potentially corresponding to the two compartments also estimated in Fig. 3a.
Discussion
While these results are preliminary, the highly significant differences seen in Fig. 2 between minTE and maxTE and the spectrum in Fig. 5 show promise for resolving D-T2 spectra in the living human brain, even when using a standard diffusion-weighted PGSE sequence. The data will be made publicly available. Ongoing work will explore the utility of alternative sequences (e.g. diffusion-weighted STEAM), optimized fitting procedures11, and alternative kernels and parameter spaces (e.g. diffusion time).Acknowledgements
No acknowledgement found.References
[1] Callaghan, P. T., Godefroy, S., & Ryland, B. N. (2003). Use of the second dimension in PGSE NMR studies of porous media. Magnetic resonance imaging, 21(3), 243-248.
[2] Venkataramanan, L., Song, Y. Q., & Hurlimann, M. D. (2002). Solving Fredholm integrals of the first kind with tensor product structure in 2 and 2.5 dimensions. IEEE Transactions on Signal Processing, 50(5), 1017-1026.
[3] Kim, D., Kim, J. H., & Haldar J. P. (2016) Diffusion-Relaxation Correlation Spectroscopic Imaging (DR-CSI): An Enhanced Approach to Imaging Microstructure. ISMRM, 0660.
[4] Qin, W., Shui Yu, C., Zhang, F., Du, X. Y., Jiang, H., Xia Yan, Y., & Cheng Li, K. (2009). Effects of echo time on diffusion quantification of brain white matter at 1.5 T and 3.0 T. Magnetic resonance in medicine, 61(4), 755-760.
[5] De Santis, S., Assaf, Y., and Jones, D.K. (2016) The influence of T2 relaxation in measuring the restricted volume fraction in diffusion MRI. ISMRM, 1998.
[6] Lin, M., Tong, Q., Ding, Q., Yan, X., Feiweier, T., He, H., & Zhong J. (2016). TE-Dependence of DTI-Derived Parameters in Human Brains and Elucidation with Monte Carlo Simulation. ISMRM diffusion workshop.
[7] Jelescu, I. O., Zurek, M., Winters, K. V., Veraart, J., Rajaratnam, A., Kim, N. S., ... & Fieremans, E. (2016). In vivo quantification of demyelination and recovery using compartment-specific diffusion MRI metrics validated by electron microscopy. Neuroimage, 132, 104-114.
[8] Andersson, J. L., & Sotiropoulos, S. N. (2016). An integrated approach to correction for off-resonance effects and subject movement in diffusion MR imaging. Neuroimage, 125, 1063-1078.
[9] Veraart, J., Sijbers, J., Sunaert, S., Leemans, A., & Jeurissen, B. (2013). Weighted linear least squares estimation of diffusion MRI parameters: strengths, limitations, and pitfalls. NeuroImage, 81, 335-346.
[10] Beck, A., & Teboulle, M. (2009). A fast iterative shrinkage-thresholding algorithm for linear inverse problems. SIAM journal on imaging sciences, 2(1), 183-202.
[11] Benjamini, D., & Basser, P.J. Use of marginal distributions constrained optimization (MADCO) for accelerated 2D MRI relaxometry and diffusometry
[12] Dietrich, O., Raya, J. G., Reeder, S. B., Reiser, M. F., & Schoenberg, S. O. (2007). Measurement of signal-to-noise ratios in MR images: Influence of multichannel coils, parallel imaging, and reconstruction filters. Journal of Magnetic Resonance Imaging, 26(2), 375-385.
Figures