0834
A new COPD phenotype characterized by hyperpolarized xenon-129 MRIKun Qing1, Sahar Mansoor1, John P. Mugler, III1, Talissa A. Altes2, Nicholas J. Tustison1, Kai Ruppert3, Jaime F. Mata1, G.Wilson Miller1, Iulian C. Ruset4, F.William Hersman4,5, Joanne M. Cassani2, and Yun Michael Shim1
1University of Virginia, Charlottesville, VA, United States, 2University of Missouri School of Medicine, Columbia, MO, United States, 3University of Pennsylvania, Philadelphia, PA, United States, 4Xemed, LLC, Durham, NH, United States, 5University of New Hampshire, Durham, NH, United States
Synopsis
Existing literature describes two distinctive phenotypes of chronic obstructive pulmonary disease (COPD): airway-predominant chronic bronchitis and alveolar-predominant emphysema. In this study, based on results from pulmonary function tests and computed tomography, we found a new mixed phenotype of COPD. This mixed phenotype showed minimal emphysematous tissue destruction, but low diffusion lung capacity (DLCO). Subsequent hyperpolarized xenon-129 MRI results indicated that gas exchange to the pulmonary blood in lungs for this mixed phenotype was significantly impaired as compared to controls and the classic COPD phenotypes.
Introduction
Existing literature indicates that cigarette smoking results in two distinctive phenotypes of chronic obstructive pulmonary disease (COPD): airway-predominant chronic bronchitis (CB) and alveolar-predominant emphysema (EM) [1]. Routine clinical tools, including pulmonary function tests (PFT) and computed tomography (CT) have their limitations for characterizing COPD. Hyperpolarized xenon-129 (Xe129) MRI, as a novel imaging technique, provides a new way to measure lung physiology and characterize COPD [2].Purpose
The purpose of this study was to characterize COPD phenotypes and the associated pulmonary physiology using hyperpolarized xenon-129 (Xe129) MRI, and compare the results with established clinical measurements.Methods
Thirteen healthy and thirty-three COPD subjects were recruited for this study, and underwent PFT and CT. COPD patients were phenotyped into three groups by percent diffusion lung capacity (%DLCO) and CT: 1) emphysema (EM): low %DLCO and high % of EM lung tissue on CT; 2) chronic bronchitis (CB): high %DLCO and low % of EM lung tissue on CT; and 3) mixed indeterminate (IND) phenotype: low %DLCO suggestive of EM but low EM lung tissue on CT. Xe129 MRI, including ventilation imaging [3] and dissolved-phase imaging [2], was subsequently performed to determine airflow limitation by measuring dead space ventilation (%VD) [4] and alveolar gas exchange by measuring Xe129 gas diffused into interstitial tissue (tissue/gas ratio) or into red blood cells (RBC; RBC/tissue ratio) normalized by Xe129 gas in the airspaces [2]. One way ANOVA with Bonferroni subgroup analysis was performed to compare the four groups of subjects. In addition, to evaluate pulmonary perfusion in CB patients, two CB patients underwent 3-D dynamic contrast enhanced (DCE) MRI. Maps of quantitative perfusion parameters were extracted as described in [5], and compared with RBC/tissue ratios.Results and Discussion
Moderately negative correlation was found between the %DLCO and % of EM lung tissue obtained by CT (R= -0.41, P= 0.017). Based on PFT and CT (Figure 1), patients were classified into three phenotypes: 18% (6/33) EM phenotype; 21% (7/33) CB phenotype; and 61% (20/33) IND phenotype with low %DLCO, but minimal emphysematous lung by CT. Airflow limitation (%FEV1 and Xe129 %VD) was worse in the EM phenotype as compared to all other groups (p<0.05) (Figure 2a, b). The IND phenotype group had %FEV1 substantially overlapped with the CB group (p>0.05, Figure 2a), and did not show significantly higher %VD than the control group (p>0.05, Figure 2b). Similarly, no statistical differences were found in Xe129 tissue/gas ratios among the control, CB and the IND groups (p>0.05). Only the EM group appeared to have lower tissue/gas ratios than all other groups (p<0.05) (Figure 2c). However, the RBC/tissue ratios, measuring gas transfer from the interstitium to the blood stream, were much lower in the IND phenotype as compared to both EM and CB groups (p<0.05) (Figure 2d). Further, DCE MRI results from two patients of the IND group (results from one patient shown in Figure 3) showed relatively normal or high pulmonary blood flow/volume in regions with low RBC/tissue ratios (white arrows, Figure 3). These results strongly support that the Xe129 gas was able to diffuse into the interstitium but was unable to further transfer into the RBCs in the IND group.Conclusion
In a mixed phenotype of COPD (minimal emphysematous tissue destruction and impaired gas exchange) as identified by PFT and CT, Xe129 MRI found that gas transfer from the tissue to the blood was impaired but gas transfer from the airspaces to the tissue was intact. Further investigation of this group is needed to identify whether it represents pre-EM COPD patients at risk, or an entirely different phenotype with tissue remodeling of the vasculature.Acknowledgements
This work was supported by NIH R01 HL109618 and R21 HL129112.References
[1] Izquierdo-Alonso, J.L. et al. Respir Med 107, 724-731. [2] Qing, K., et al. J Magn Reson Imaging, 2014. 39(2): p. 346-59. [3] Qing K et al. Proc of ISMRM 23 (2015): 1494. [4] Tustison N.J., et al. J Magn Reson Imaging, 2011. 34(4): p. 831-41 [5] Ohno, Y., et al. J Magn Reson Imaging, 2004. 20(3): 353-365.Figures
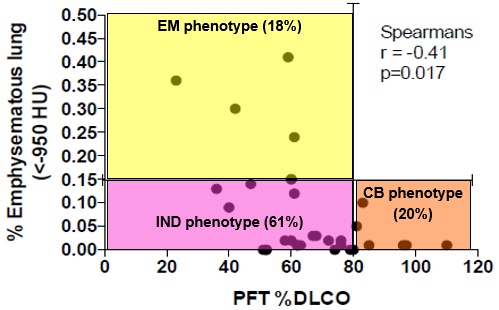
Figure 1. Phenotypes of 33 COPD subjects were
determined using %DLCO and % of emphysematous lung tissue defined as CT HU <
-950. The % of lung tissue with HU < -950 is plotted on the y-axis. The
%DLCO from PFT is plotted on the x-axis. EM predominant (18% of patients) =
greater than 15% of the lung tissue with HU<-950 AND less than 80% DLCO.
Chronic-bronchitis predominant (21% of patients) = less than 15% of the lung
tissue with HU<-950 AND greater than 80% DLCO. Newly identified mixed
phenotype (61% of patients) = less than 15% of the lung tissue with HU<-950
AND less than 80% DLCO.
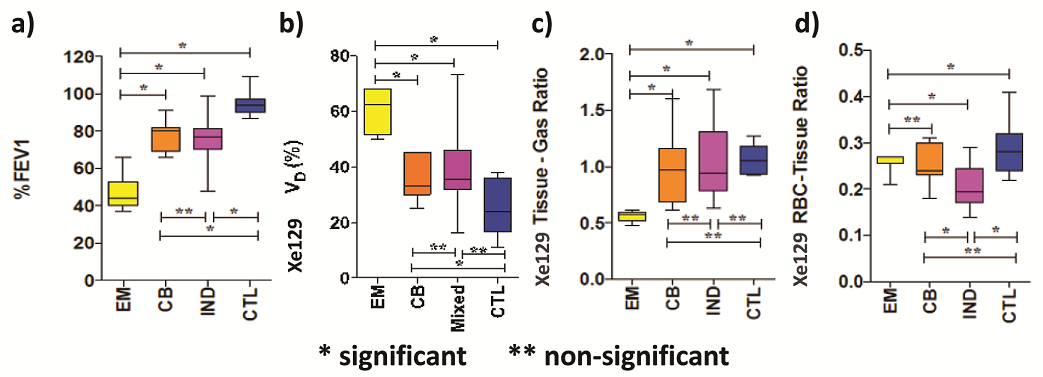
Figure 2. Three COPD phenotypes identified in Figure 1 and healthy controls were compared to each other using one way ANOVA with Bonferonni corrected subgroup comparison. All four comparisons have significant one way ANOVA p < 0.05. * means P<0.05. ** means not significant. EM = COPD with low %DLCO and high % emphysematous lung on CT. CB = COPD with high %DLCO and low % emphysematous lung on CT. IND = COPD with low %DLCO and low % emphysematous lung on CT. Control (CTL) = healthy control without smoking history and normal PFT.
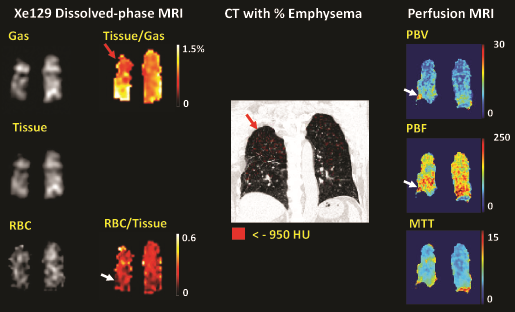
Figure
3. Xe129
dissolved-phase MR images and ratio maps, CT %emphysema map (<-950 HU marked
in red) overlaid on CT, and color-coded perfusion parameter maps from a COPD
patient (66, female). Regions with low tissue-to-gas ratios corresponded well
with regions with high emphysema (e.g. red arrows). However, in the lung
regions with lower RBC-to-tissue ratios, we did not observe low PBV or PBF. In
contrast, some areas (white arrows) had relatively higher PBV and PBF compared
to other regions of the lung from the same coronal slice. PBV, PBF and MTT are in
ml/100ml, ml/100ml/min,
and seconds.