0830
Multi-parametric Response Map Using Hyperpolarized Gas MR Imaging to Retain Regionality: Making Hyperpolarized Gas Imaging Great Again1Radiology, University of Pennsylvania, Philadelphia, PA, United States, 2Anesthesiology and Critical Care, University of Pennsylvania, Philadelphia, PA, United States
Synopsis
By establishing multi-parametric response map (mPRM) of Gas MRI, we suggested a multifaceted regional combination of the imaged mPRM that best explain lung function deterioration while had a meaningful representation of each subject lung function condition.
Introduction
Hyperpolarized (HP) gas MRI provides maps of lung function and structure. In addition to the apparent diffusion coefficient (ADC), which is a measurement of alveolar sizes, HP imaging measures regional specific ventilation (SV)(1), alveolar oxygen tension (PAO2)(2), oxygen uptake (R)—all of which can be accurately quantified at an acinar resolution, and have been shown to be sensitive for early detection of smoking-induced alterations (3). However, meaningful studies of the regional interrelation between these functional parameters have not been performed. We hypothesize that simultaneously plotting all the aspects of lung function and structure in a voxel-wise manner will produce a comprehensive lung function map capable of significantly enhancing our understanding of different lung pathologies and their treatments. For example, interventions that restore ventilation to a region of the lung with permanently low perfusion are likely to further exacerbate morbidity due to increased V/Q mismatch. A multifaceted regional map that could distinguish between these different regions would provide a more effective diagnosis and improved treatment trajectory for COPD.Methods
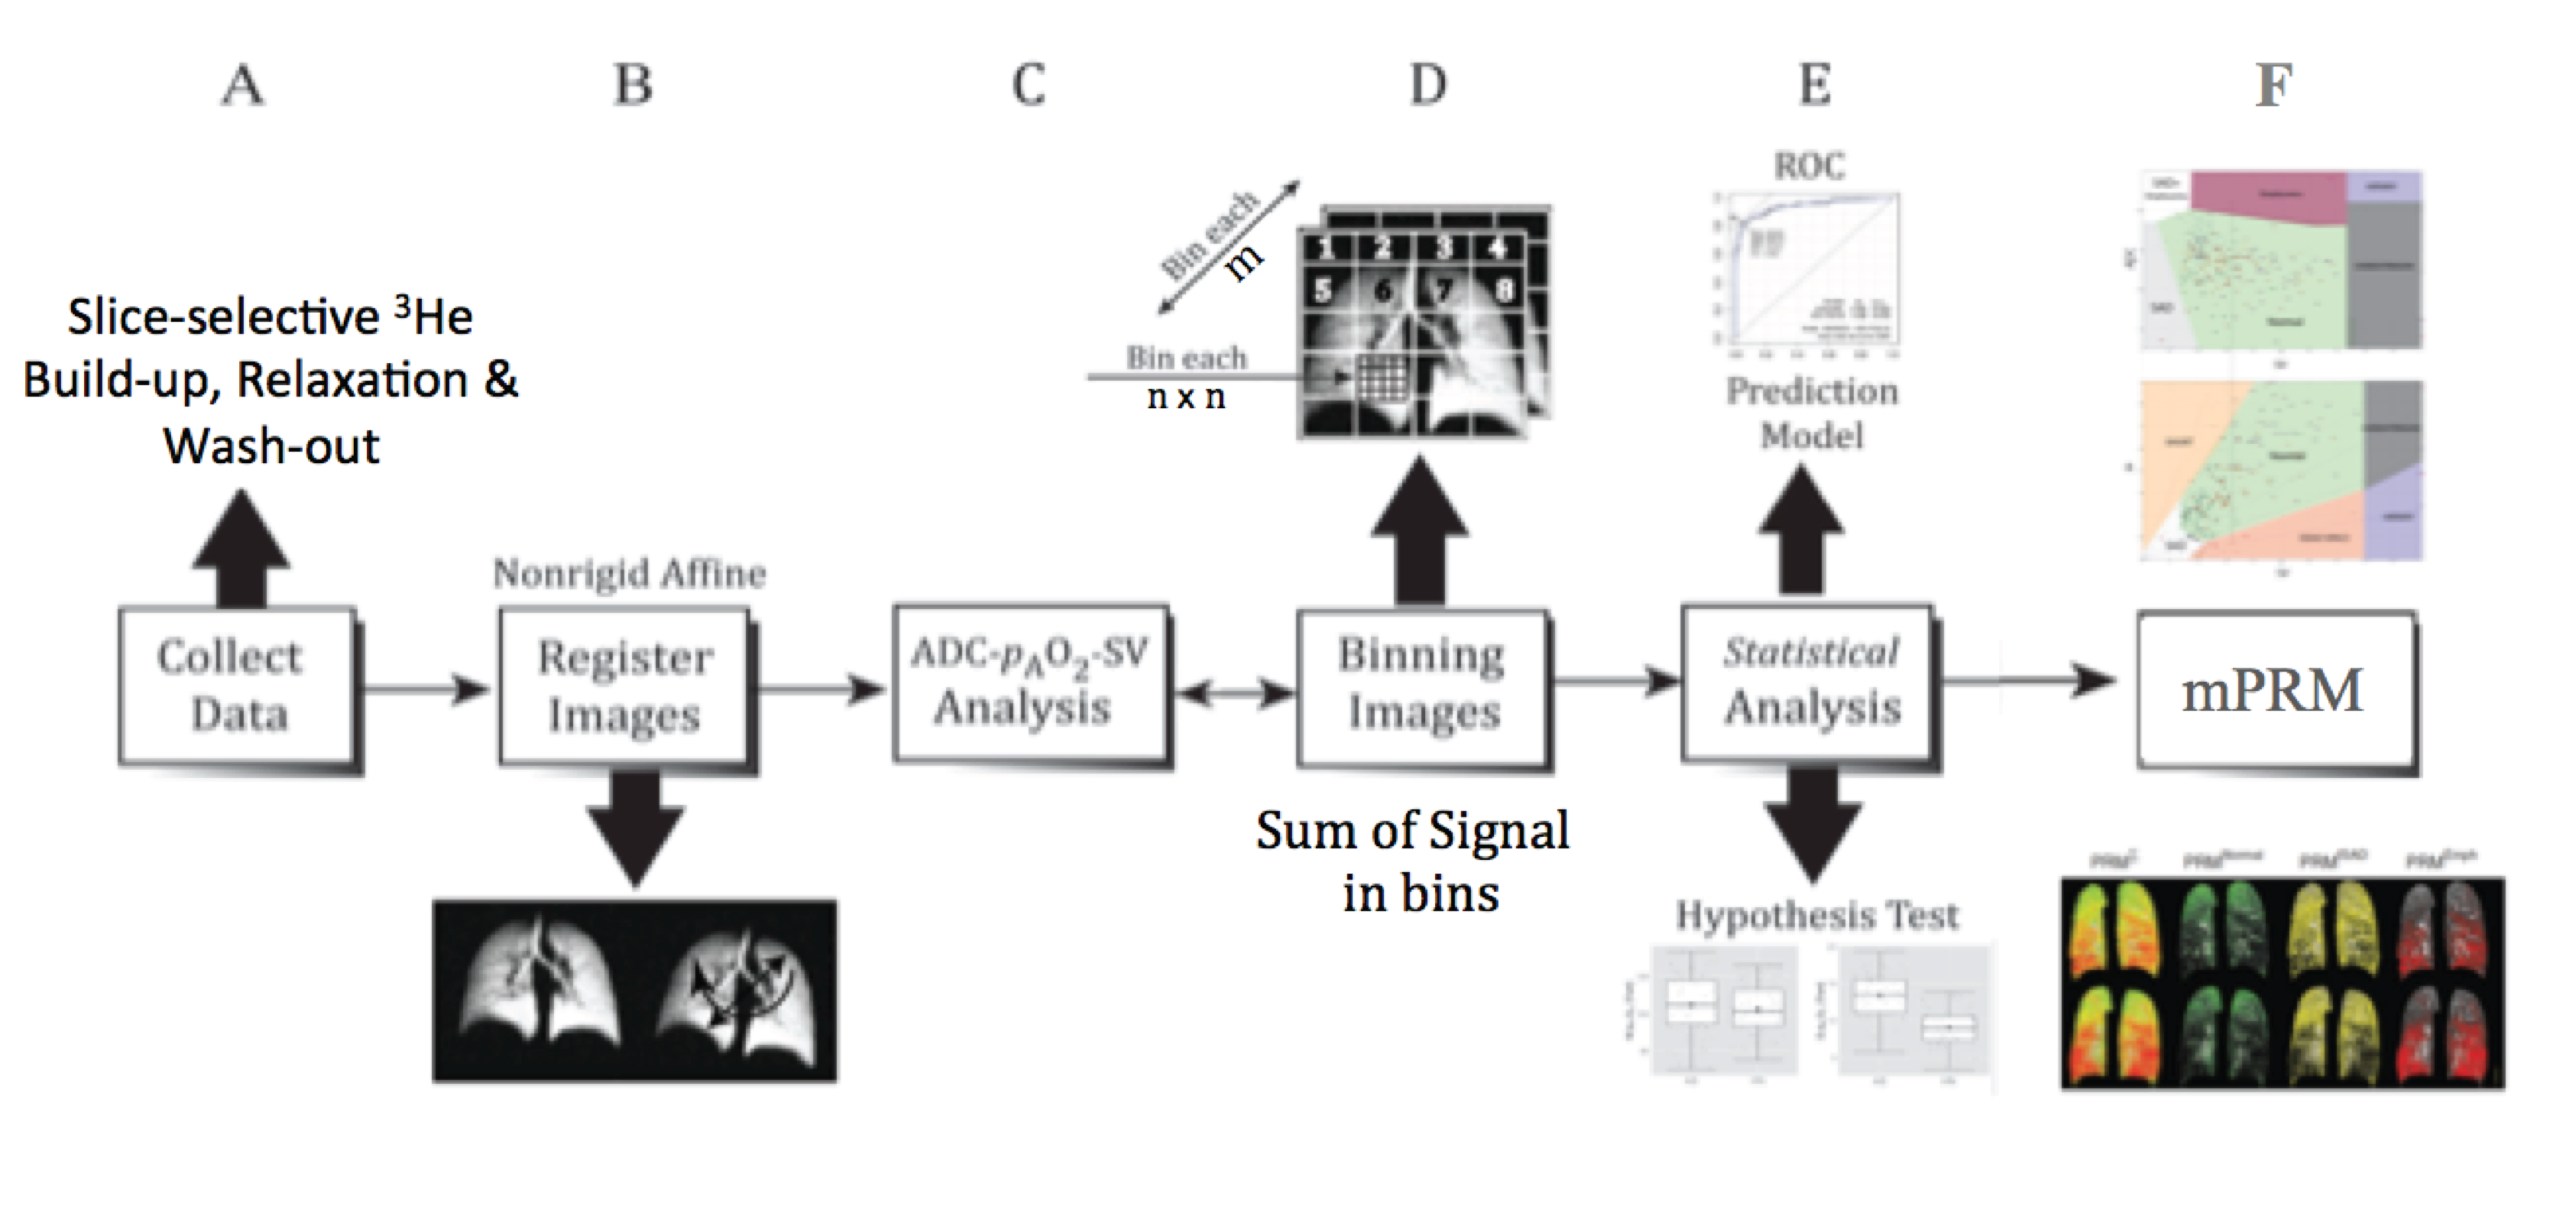
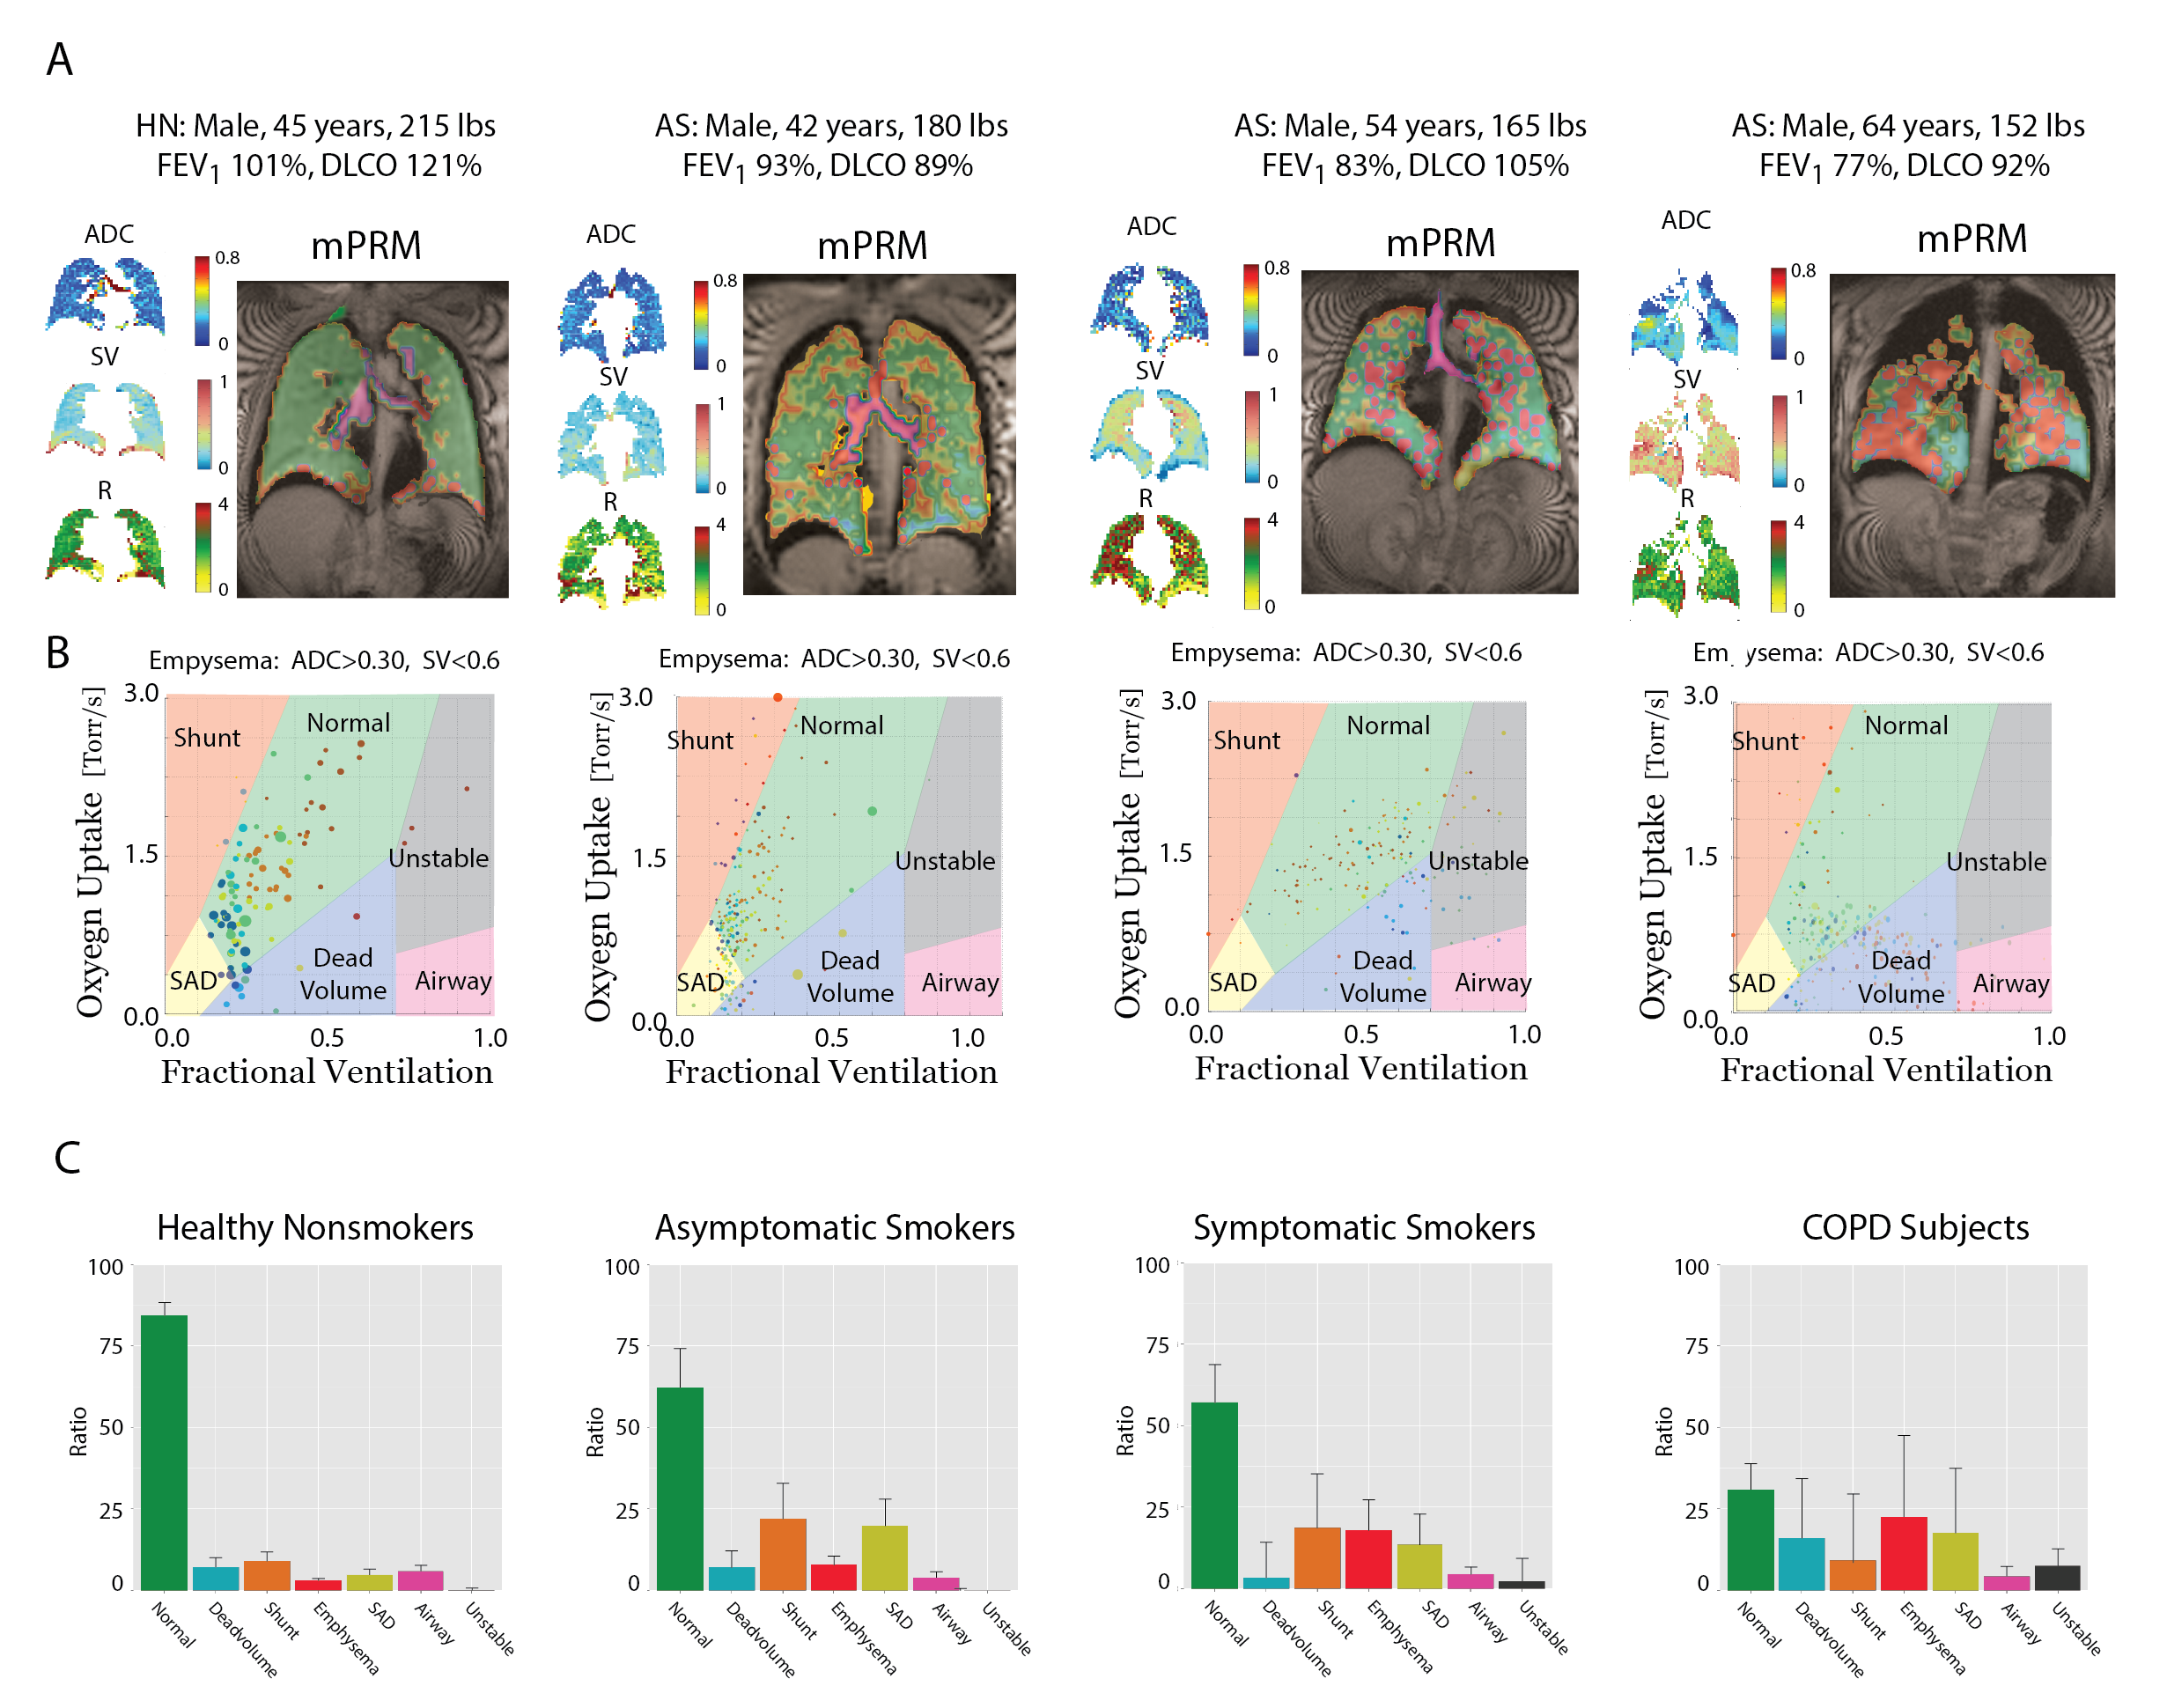
We present a gas MR-based technique adopted from parametric response mapping methodology (4), suitable for voxel-wise analysis of multiple simultaneous parameters of HP gas imaging to produce diagnostic and predictive lung function maps. We used a multibreath hybrid imaging protocol that provides all the parameters (ADC,SV,PAO2 and R) in HP 3He MRI (5). Imaging was performed in a whole body 1.5-T MRI system (Siemens MAGNETOM) using a flexible 8-channel (2´4 phased array) chest coil (Rapid Biomedical). We employed a 2D multi-slice GRE image set with 6 ~25mm coronal slices (adjusted to cover the whole lung with a 20% inter-slice gap), MS=6´64´48 (~6´6 mm2 planar resolution), FOV=40´30cm2, alpha=6°, TR/TE=7.0/3.3ms. Imaging acceleration was performed using GRAPPA (~2´). The SV image series consists of 6 normoxic breaths (3He:N2:O2 ~1:3:1) at 5.5s intervals, followed by a combined PAO2 /ADC series, including the accelerated, interleaved ADC image pair. Total imaging time was approximately 70 seconds, including 2-4 practice breaths containing 4He and one 10-second breath-hold. For analysis on the same basis for statistical comparison, an atlas of the lung was generated by summing all the existing data and applying a smoothing Gaussian filter and a non-rigid affine-based co-registration was performed on spin density maps from all seven time points before the fitting process. Analysis was performed from top (whole-lung analysis) to bottom (full resolution) as shown in Figure 1; whole-lung and slice ADC, R and SV values were calculated based on the signals summed over the subject’s whole lung and slice at each time point. Comparisons was also performed in bins of n×n×m voxels to maintain regionality while minimizing error due to limited signal-to-noise in individual voxels. This analysis yielded a quantitative determination of three interrelated parameters of lung function and structure (ventilation SV, perfusion R, and microstructural sizes ADC) on a multi-parametric response map (mPRM), thus comprehensively describing regional pulmonary function via the production of different mPRM regions: Normal, Airway, Emphysema, Dead Space, Shunt and Small Airway Disease (Figure 2). HP 3He MR Data from 52 subjects were submitted to a clustering analysis (centroid model) to produce the mPRM boundaries. The centers for each resolution were initially chosen from whole-lung analysis, then from slice analysis, and then in each bin level from the lower resolution. The ratios of voxels in each region of mPRM were used to compare cohorts and assess correlations with clinical tests.Results and Discussion
Subjects were divided into cohorts of nonsmokers (HN:12 subjects,27-63 years), asymptomatic smokers (AS:22 subjects,40-63 years), symptomatic smokers (SS:12 subjects,40-63 years), and COPD (COPD:6 subjects,45-69 years). Figure 2 shows the HP gas MR maps (ADC,SV and R) and resulting mPRM maps in representative subjects, and the mPRM distribution in each cohort. HN had higher Normal voxels compared to all cohorts (PAS=0.011,PSS=0.019 and PCOPD<0.001). AS and SS subjects had significantly higher Mismatch voxels (sum of Dead Volume and Shunt) than HN subjects (PAS-HN=0.003 and PSS-HN=0.007). SS had significantly higher ratio of Emphysema (PAS-SS=0.044) than AS, which correlated with SGRQ scores (rp=0.64). COPD subjects had higher Emphysema compared to asymptomatic subjects (PHN=0.027 and PAS=0.039). Smokers with normal PFT who suffered from symptoms (based on SGRQ scores) showed more Emphysema voxels, while asymptomatic smokers showed higher Small Airway Disease compared to healthy subjects (PAS-HN=0.001).Conclusion
In establishing the clusters of a three-dimensional multi-parametric response map for HP gas MRI based on specific ventilation, oxygen uptake and apparent diffusion coefficient, we showed that a multifaceted regional combination of the imaged mPRM offers a meaningful representation of functional lung condition, and one especially suited to explaining deteriorating lung function.Acknowledgements
No acknowledgement found.References
1- Hamedani, Hooman, et al. "Regional Fractional Ventilation by Using Multibreath Wash-in 3He MR Imaging." Radiology 279.3 (2016): 917-924.
2- Clapp, Justin, et al. "Multibreath alveolar oxygen tension imaging." Magnetic resonance in medicine (2015).
3- Hamedani, Hooman, et al. "Alterations of Regional Alveolar Oxygen Tension in Asymptomatic Current Smokers: Assessment with Hyperpolarized 3He MR Imaging." Radiology 274.2 (2014): 585-596.
4- Galbán, Craig J., et al. "Computed tomography-based biomarker provides unique signature for diagnosis of COPD phenotypes and disease progression." Nature medicine 18.11 (2012): 1711-1715.
5- Hamedani, Hooman, et al. "A hybrid multibreath wash-in wash-out lung function quantification scheme in human subjects using hyperpolarized 3He MRI for simultaneous assessment of specific ventilation, alveolar oxygen tension, oxygen uptake, and air trapping." Magnetic Resonance in Medicine(2016).
Figures