0828
Cardiopulmonary MRI as a diagnostic tool in Pulmonary Hypertension1Academic Radiology, The University of Sheffield, Sheffield, United Kingdom, 2Pulmonary Vascular Disease Unit, Sheffield Teaching Hospitals, United Kingdom, 3Insigneo, Institute of In-Vivo Medicine
Synopsis
Pulmonary hypertension has a poor prognosis. Invasive right heart catheter measured mean pulmonary artery pressure (RHC-MPAP) is the gold standard for clinical diagnosis. Here we present a parametric model derived from cardio-pulmonary MRI for the prediction of pulmonary hypertension with a strong correlation with RHC-MPAP and a high diagnostic accuracy. In certain patients, right heart catheterisation may be avoided due to high specificity of this cardio-pulmonary MR model.
Purpose:
Pulmonary hypertension (PH) is a condition defined by a resting mean pulmonary artery pressure (mPAP) ≥ 25mmHg, measured at right-heart-catheterisation (RHC) (1). There are multiple causes of PH, but they all cause increased right ventricular load, with eventual remodelling, failure and death. Cardio-pulmonary-vascular MRI techniques have potential sensitivity to the cause and effect of PH. RHC is an invasive test with 1% serious complication rate (2). The aim of this study was to derive and assess a regression model for estimation of mPAP using MRI.Methods:
All consecutive patients with suspected PH referred to a specialist PH centre (3) from 2012 to 2016 were reviewed. Only patients with MRI and RHC within 2 days were included. Biventricular volumes, mass and function and pulmonary artery flow measurements were recorded. The first half were used as a derivation cohort, the second as a validation cohort. In the derivation cohort, any cardiac MRI metrics with statistically significant correlations with mPAP were included in the regression algorithm. ROC curve analysis in the derivation cohort was used to assess for a suitable diagnostic threshold and it’s diagnostic performance was assessed in the validation cohort.Results:
2151 MRI scans were identified from the ASPIRE registry. Within this registry there are 1146 incident cases with suspected PH. Of these patients 816 had RHC and MRI within 2 days so were included, giving 408 patients in the derivation and validation cohorts. Cardio-pulmonary MRI derived measures of right ventricular and pulmonary arterial structure and function, particularly right ventricular end systolic volume index, right ventricular ejection fraction, left ventricular end-diastolic volume index, right ventricular mass (and hence ventricular mass index), log10 interventricular septal angle and pulmonary artery diastolic area showed statistically significant correlations with RHC-mPAP and were included in the regression calculation. Scatter plots for each variable against RHC-mPAP were used to assess for a linear relationship, interventricular septal angle and ventricular mass index showed a logarithmic relationship. The result of the regression analysis was:
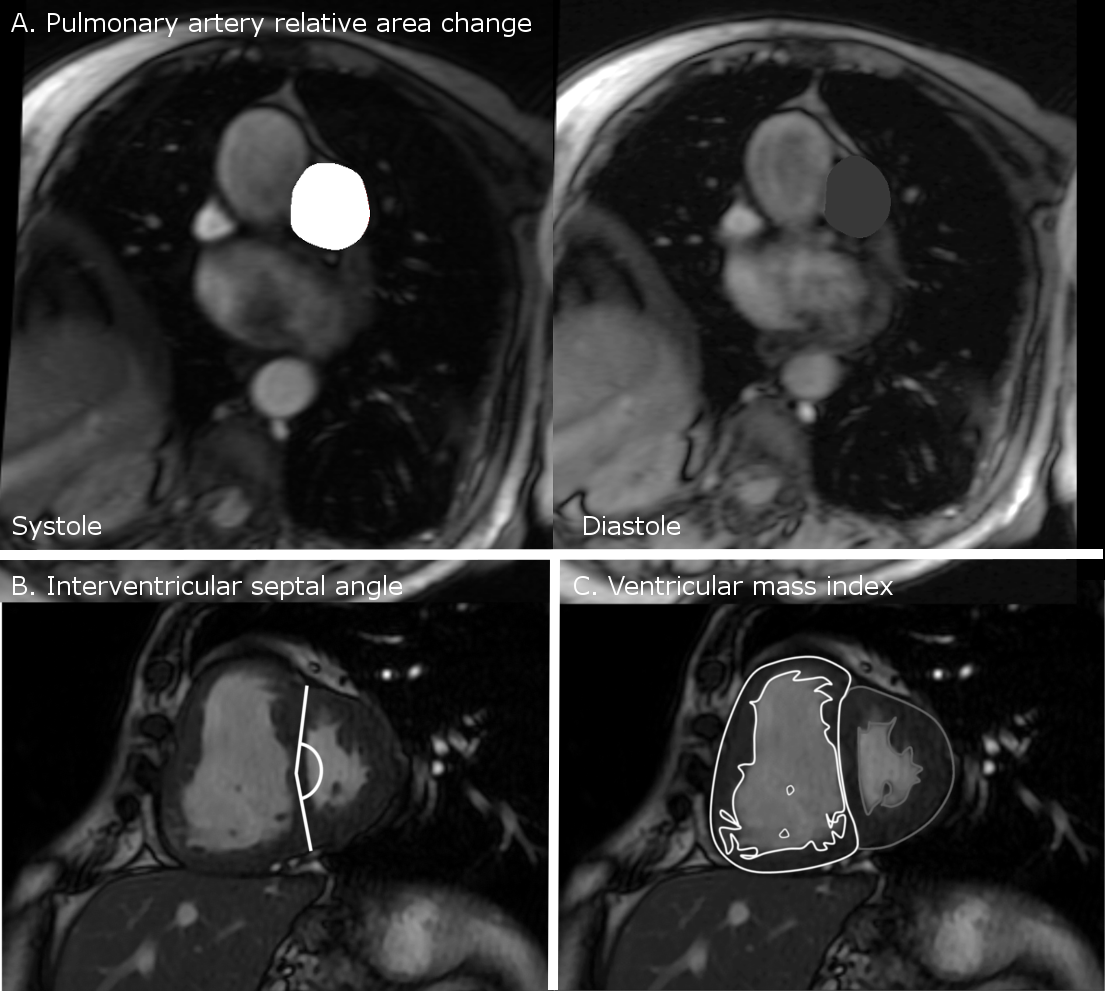
MPAPmri = -171.769 + (43.517 x log10 interventricular septal angle) + (6.282 x log10 ventricular mass index) + (-0.917 x Average pulmonary artery velocity) + (-0.178 x pulmonary artery relative area change) + (0.007 x Diastolic pulmonary arterial area). (Figure 4)
A threshold of 37 was identified as a diagnostic cut-off as it was 100% specific threshold for PH.
Diagnostic accuracy for Validation cohort.
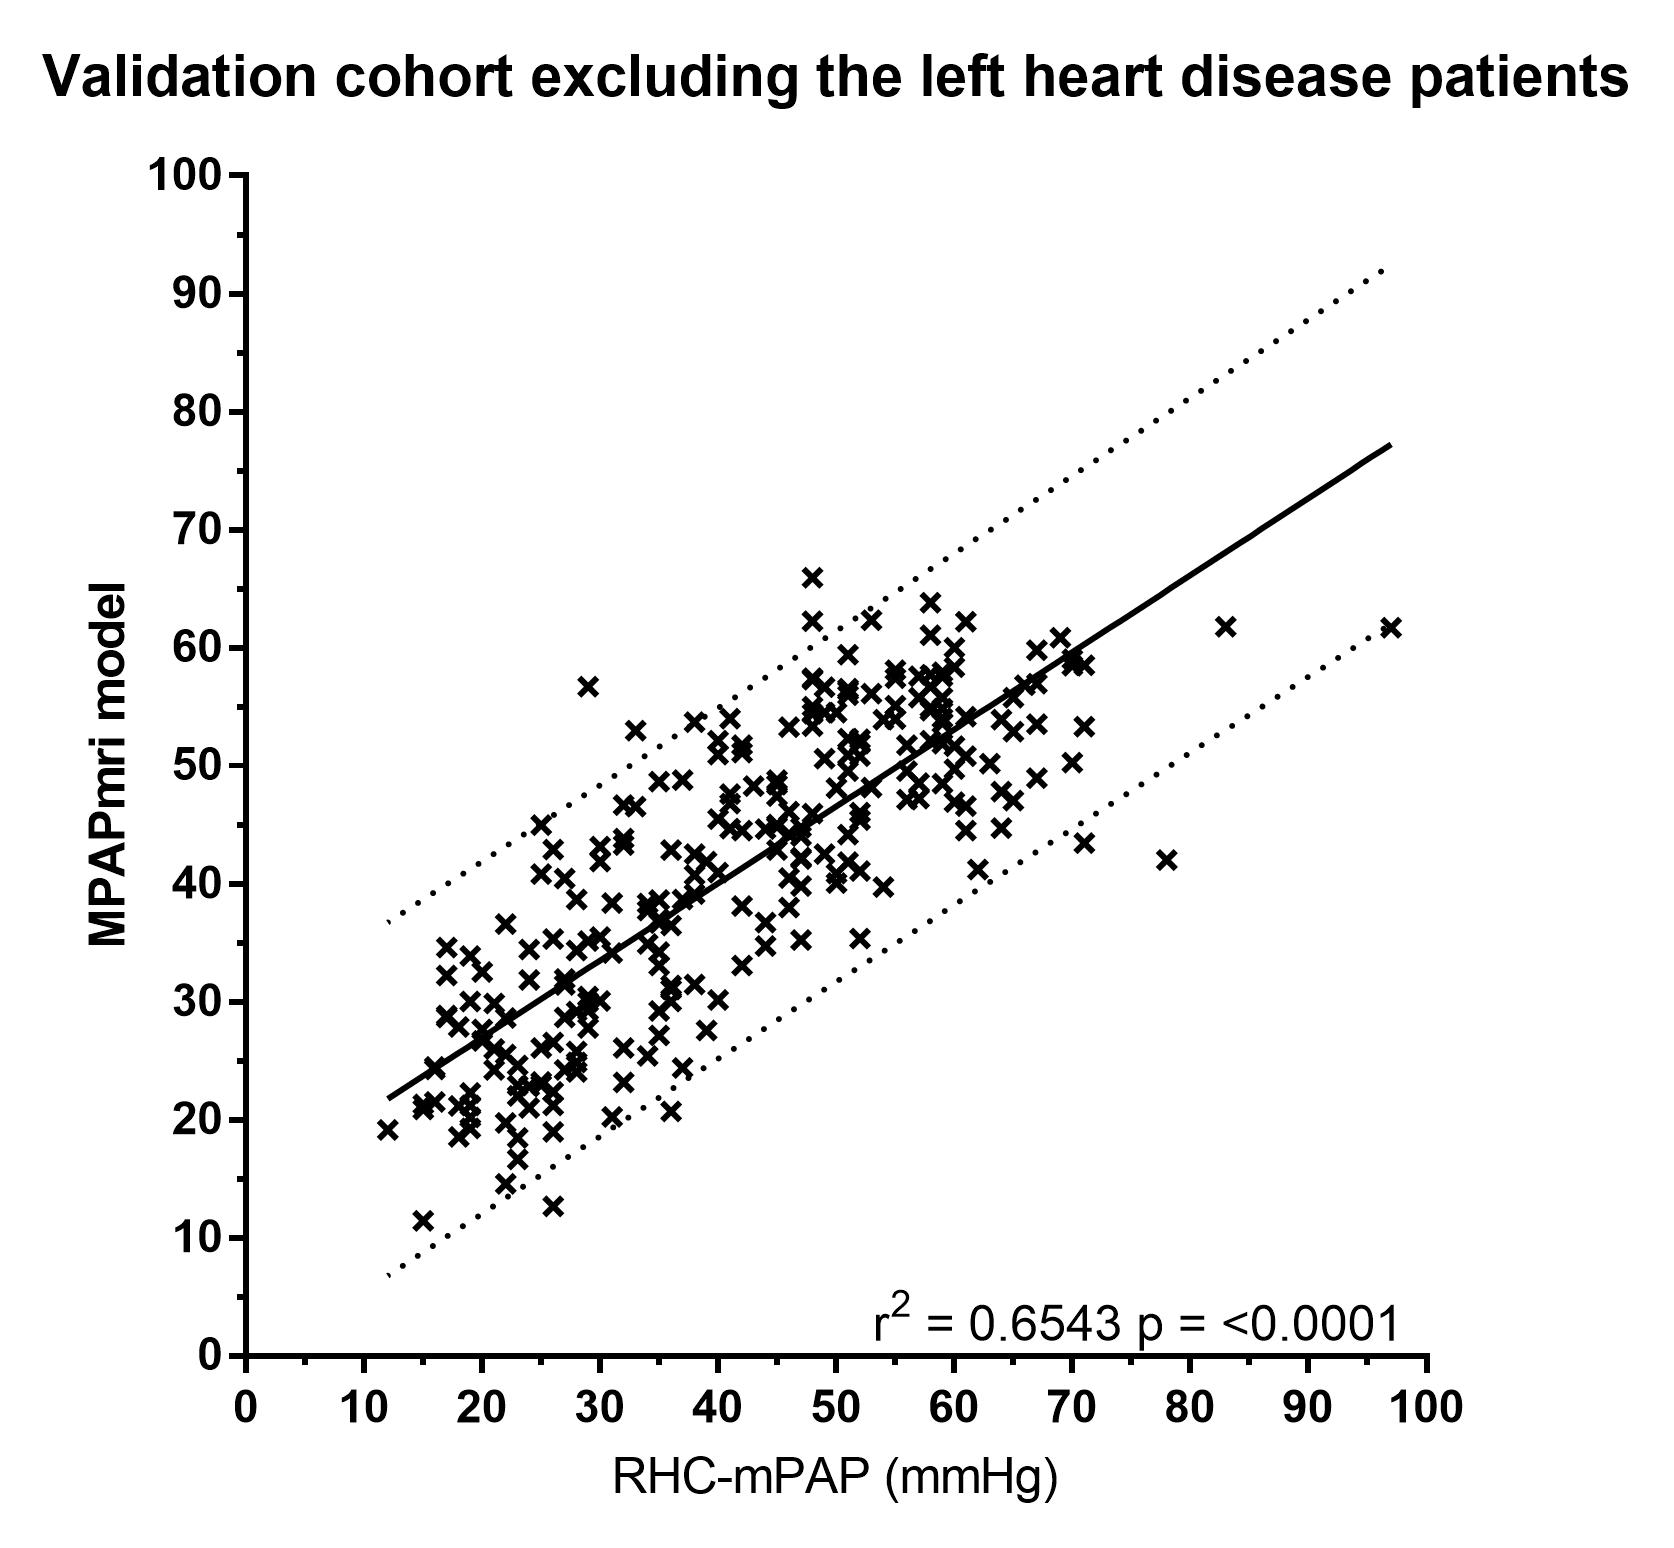
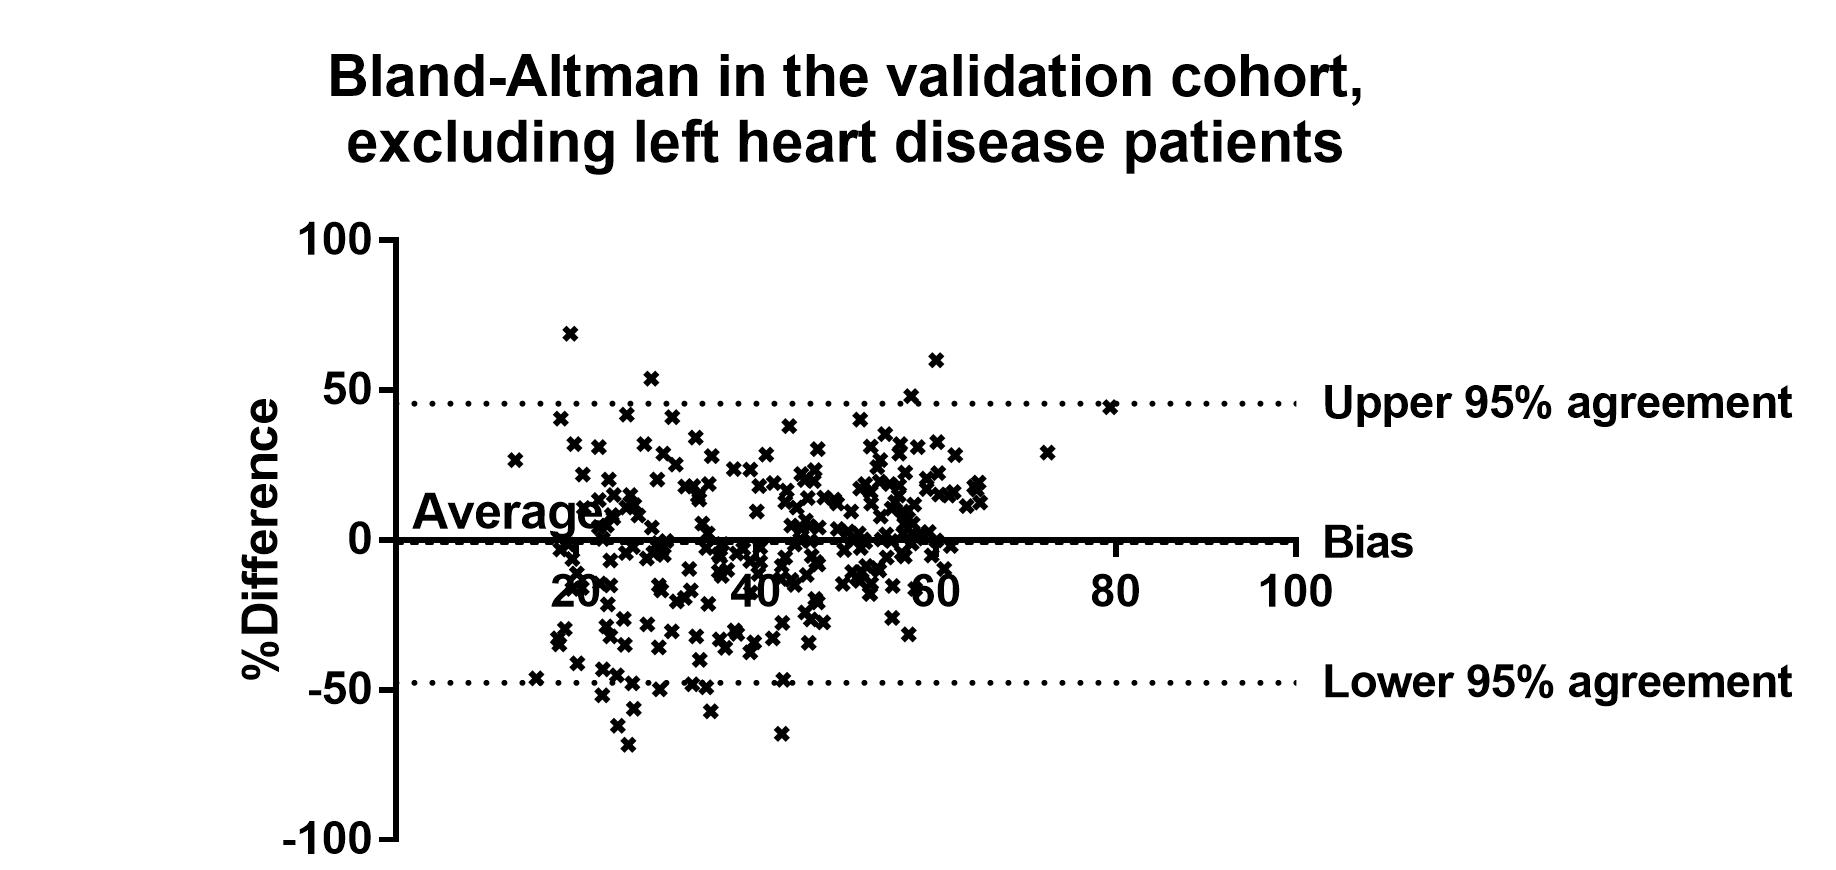
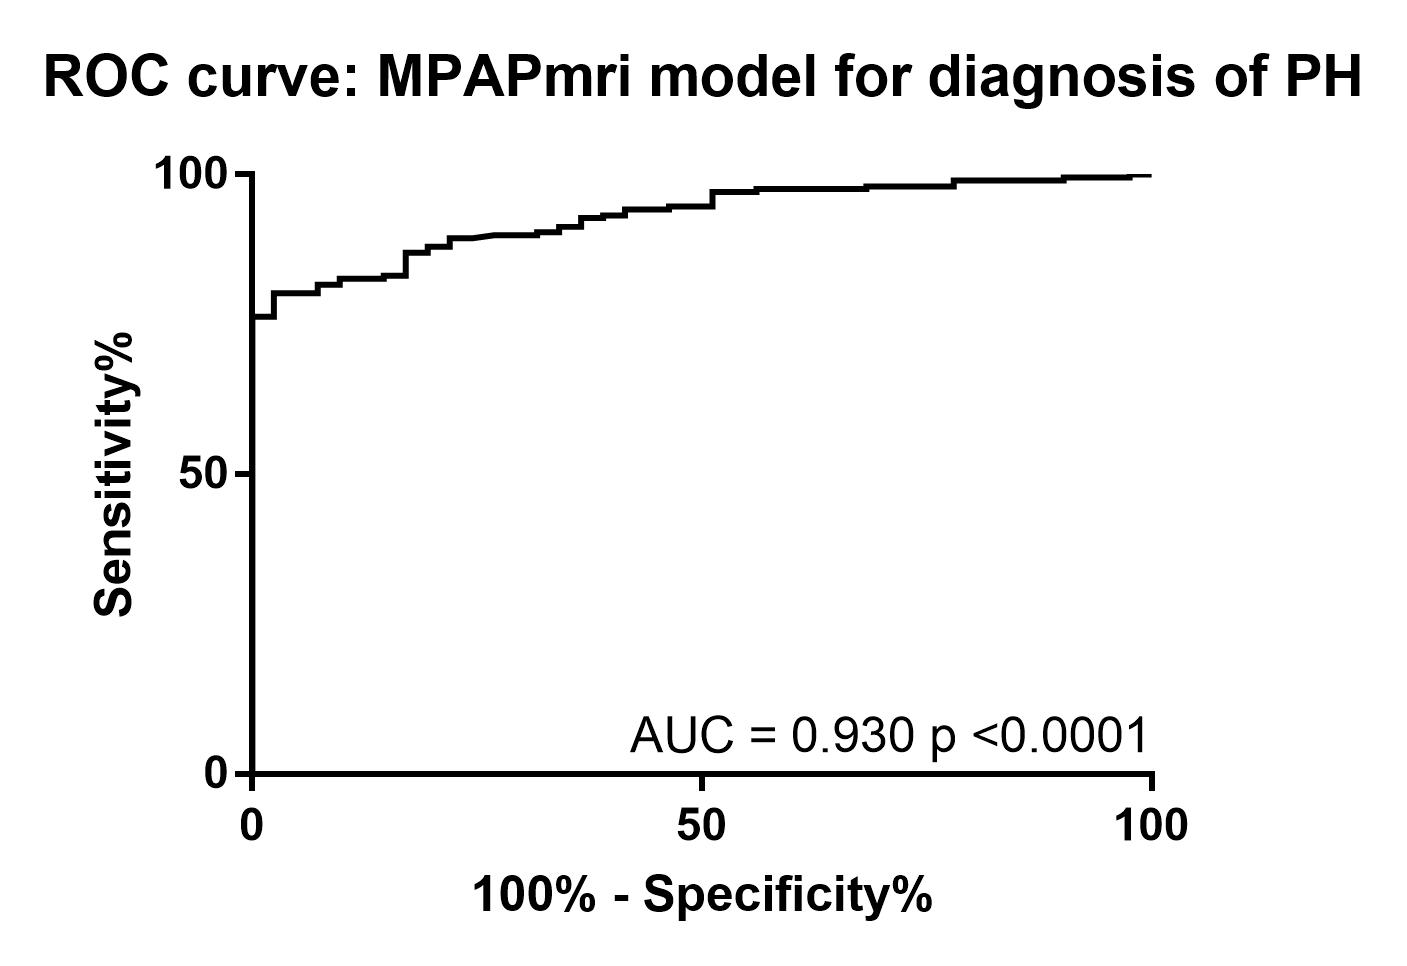
The accuracy of this model was assessed in the 408 patients in the validation cohort. There was a strong correlation between RHC-mPAP and MR predicted mPAP (r2=0.55 p<0.0001). ROC curve analysis showed an area under the curve of 0.883, the threshold of 37 had 97% specificity and 45% sensitivity (p<0.0001). The accuracy of the model was also assessed after exclusion of patients with MRI evidence of left heart disease, defined by a left atrial volume index of ≥41 (4). There were 238 patients with left atrial volume index of <41, 39 without PH and 199 with PH. Removing the patients with dilated left atrial volumes from the analysis increased the correlation between MR predicted mPAP and RHC measured mPAP (r2=0.6543, p=<0.0001) (figure 1). Bland-Altman analysis showed a tiny bias (-1.0%) and close 95% agreement (upper and lower boundaries of agreement were 45.62% and-47.65%) (figure 2). ROC curve analysis gave an area under the curve of 0.930 (p=<0.0001) (figure 3). Using a threshold of 37, gave a specificity of 100% (95% CI 92-100%) with a sensitivity of 73% (66-78%) (p=<0.0001). Using a threshold of 25 (mirrors the RHC threshold) gave 90% sensitivity (95%CI 86-94%) and 61% specificity (95%CI 47-74%) (p=<0.0001).
Discussion:
A newly derived parametric regression model for mPAP estimation shows a strong correlation and high accuracy with RHC-mPAP in a large cohort of patients with suspected PH and normal left atrial volume index. The exclusion of left heart disease patients, using an MRI defined measure, was expected to improve the accuracy of the model as left heart disease patients have increased left ventricular pressures, increasing left ventricular mass and reducing the interventricular septal angle. Further work will concentrate on the derivation of a model which is effective in the group of patients with dilated left atria. We will also assess the performance of the model in the subgroups of PH for deeper phenotyping.CONCLUSION:
We have shown that using a cardio-pulmonary-vascular model for mPAP prediction we can accurately predict the presence of PH. By using a threshold of 37 on the model, in the presence of normal left atrial volume index, we can potentially avoid right heart catheterisation with 100% specificity for the disease.Acknowledgements
This work presents independent research funded by the National Institute for Health Research (NIHR) and the MRC. The views expressed are those of the authors and not necessarily those of the NHS, the NIHR or the Department of Health.References
1. Galiè N, Humbert M, Vachiery J-L, Gibbs S, Lang I, Torbicki A, et al. 2015 ESC/ERS Guidelines for the diagnosis and treatment of pulmonary hypertension. Eur Heart J [Internet]. 2016 Jan 1;37(1):67–119. Available from: http://erj.ersjournals.com/lookup/doi/10.1183/13993003.01032-2015
2. Hoeper MM, Lee SH, Voswinckel R, Palazzini M, Jais X, Marinelli A, et al. Complications of Right Heart Catheterization Procedures in Patients With Pulmonary Hypertension in Experienced Centers. J Am Coll Cardiol [Internet]. 2006 Dec;48(12):2546–52. Available from: http://linkinghub.elsevier.com/retrieve/pii/S0735109706023382
3. Hurdman J, Condliffe R, Elliot CA, Davies C, Hill C, Wild JM, et al. ASPIRE registry: Assessing the Spectrum of Pulmonary hypertension Identified at a REferral centre. Eur Respir J [Internet]. 2012 Apr;39(4):945–55. Available from: http://erj.ersjournals.com/lookup/doi/10.1183/09031936.00078411
4. Aune E, Baekkevar M, Roislien J, Rodevand O, Otterstad JE. Normal reference ranges for left and right atrial volume indexes and ejection fractions obtained with real-time three-dimensional echocardiography. Eur J Echocardiogr. 2009;10(6):738–44.
Figures