0825
Comparison of BOLD-contrast imaging and DW imaging for early prediction of renal damage after microemboli-induced acute kidney injury in animal model1Academy for Advanced Interdisciplinary Studies, Peking University, Beijing, People's Republic of China, 2College of Engineering, Peking University, Beijing, People's Republic of China, 3Department of Radiology, Peking University First Hospital, Beijing, People's Republic of China, 4Philips Healthcare, Suzhou, People's Republic of China, 5Renal Division, Peking University First Hospital, Beijing, People's Republic of China, 6Institute of Science and Technology for Brain-Inspired Intelligence, Fudan University, Shanghai, People's Republic of China
Synopsis
Atheroembolic renal disease (AERD) is an important yet under-diagnosed kidney diseases associated with atherosclerosis. This study investigates the utility of BOLD and DWI in the assessment of microemboli-induced AKI, and compares the performances of both techniques for early prediction of renal damage. AKI was induced by injection of microspheres into the right kidney. The results indicate that both techniques can serve as reliable indicators to focal severe regional ischemia before renal damage occurs, while BOLD imaging seems to be more sensitive in early detection of moderate ischemia.
Introduction
Atheroembolic renal disease (AERD) is an important yet under-diagnosed kidney diseases associated with atherosclerosis and remains an unexplored field of nephrology research1-3. Functional MRI techniques such as blood-oxygen-level-dependent (BOLD) imaging and diffusion-weighted imaging (DWI) seem to be of considerable value in the evaluation for intra-renal oxygenation and microcirculation.Purpose
To investigate the utility of BOLD and DWI in the assessment of microemboli-induced acute kidney injure (AKI), and compare the performances of both techniques for early prediction of renal damage.Materials and Methods
Animal models:
Animal experiments were performed in accordance with guidelines and approval of the Animal Care and Use Institutional Committee. A total of Twenty-four New Zealand White rabbits (weight range 2.5-3.5 kg) were included in this study. All animals were anesthetized with isoflurane (inhaled, 3% induction, and 1.5% maintenance) during surgery and MRI scans. AKI was induced by injection of microspheres (40 to 120 um in diameter) suspended in 2.0 ml of physiological saline into the right kidney. Animals were divided into 3 groups according to the number of injected microspheres: severe AKI group (group A, approximately 5 × 10⁴, n = 8), moderate AKI group (group B, approximately 2.5 × 10⁴, n = 8) and control group (group C, n = 8). Blood samples were obtained from auricular veins for the evaluation of plasma creatinine and blood glucose levels. Both kidneys of all AKI rabbits were removed and sectioned longitudinally for microscopic analysis. Microsections (2-3 um thick) were obtained, stained with hematoxylin-eosin-saffron (HES), and analyzed by an experienced renal pathologist.
MR imaging:
All the MRI experiments were performed on a 3-telsa whole body scanner (Philips Medical Systems, Best, The Netherlands). MRI scans were executed repeatedly on Day 0, Day 1, Week 1 and Week 4 following microspheres injection. BOLD images were obtained with multi-echo gradient-echo (GE) sequence: TR = 500 ms, TEs = 4.6, 9.2, 13.8, 18.4, 23.0, 27.6, 32.2, 36.8 ms, flip angle = 25°, FOV = 150 × 150 mm2, matrix size = 135 × 135, voxel size = 1.12 × 1.12 mm2, NEX = 1. DW imaging was performed with a spin echo echo-planar imaging (SE-EPI) sequence: TR = 3000 ms, TE = 65 ms, FOV = 150 × 150 mm2, matrix size = 128 × 128, NEX = 2. The diffusion gradient b values of 0 and 1000 s/mm2 were used.
Imaging analysis:
The BOLD and DW images were analyzed off-line on a workstation using in-house software written in Matlab (MathWorks, Natick, MA). Parameter maps of R2* (=1/T2*) and apparent diffusion coefficient (ADC) were calculated using a mono-exponential fit.
Statistical analysis:
Regions of interest (ROIs) were delineated on T2w images and then automatically mapped to R2* and ADC parametric maps. The statistical significance of differences was evaluated with ANOVA for comparisons between groups, and paired t-test for tests within the same group. P < 0.05 was considered as statistically significant.
Results
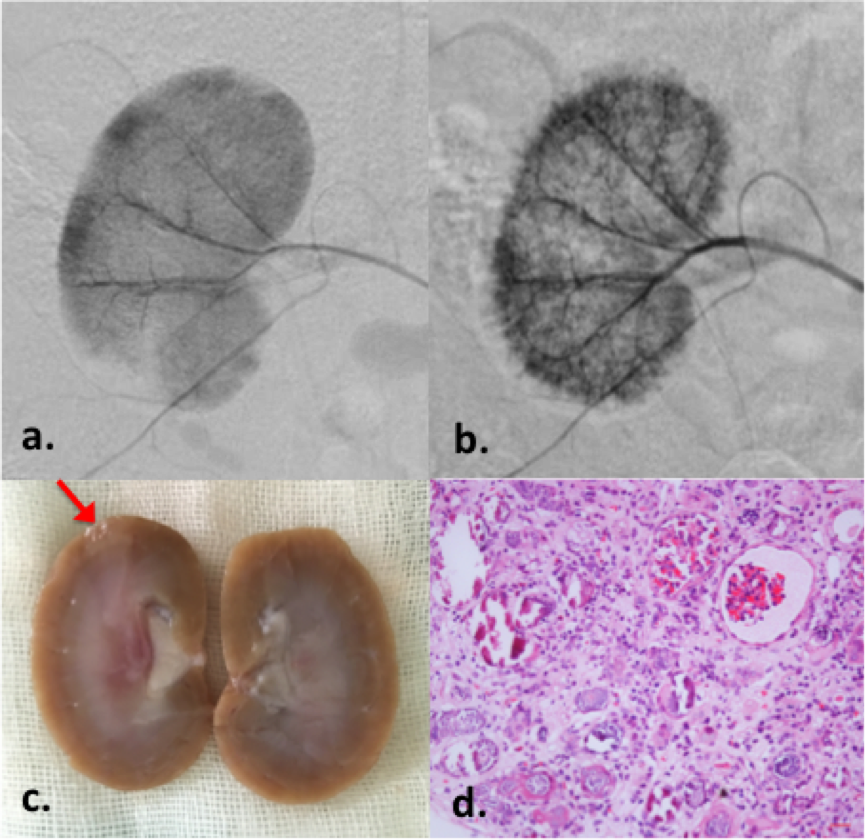
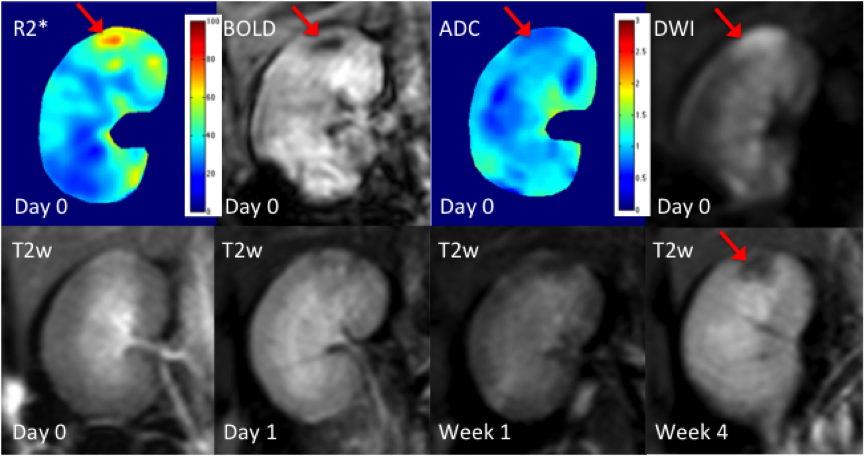
Representative digital subtraction angiography (DSA) and pathological results of a rabbit with severe microemboli-induced AKI are shown in Fig.1. The resected specimen clearly reveals the renal damage (Fig.1c, red arrow). Under microscopic examination (Fig.1d), the glomeruli shows ischemic and wrinkled features with dilated change of Bowman’s capsule. The corresponding MR images are shown in Fig.2. Increased R2* and reduced ADC appeared immediately after AKI (Day 0).
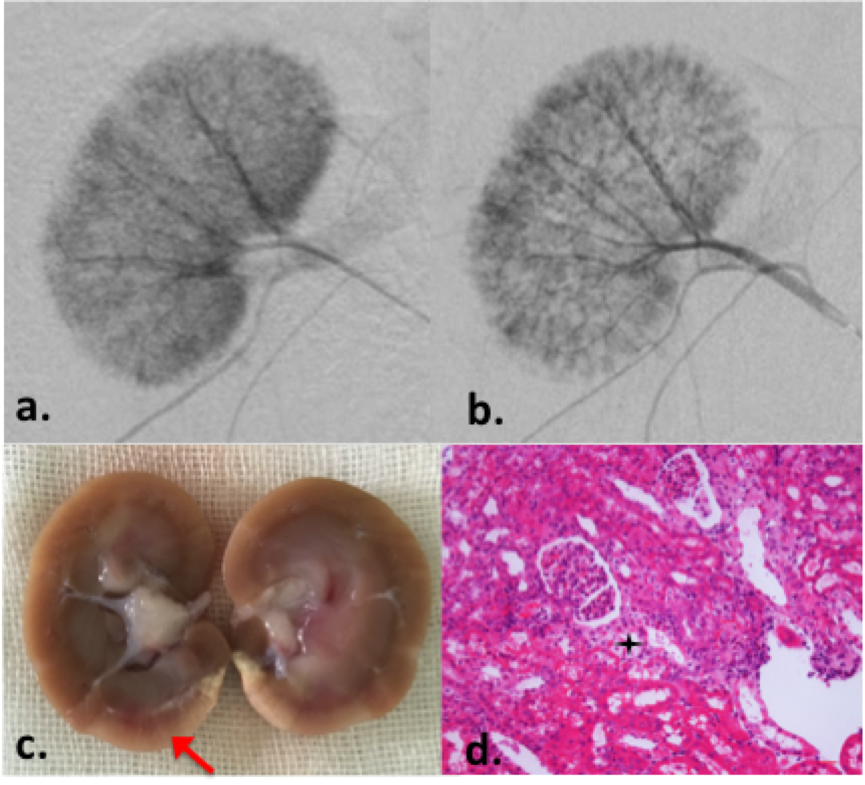
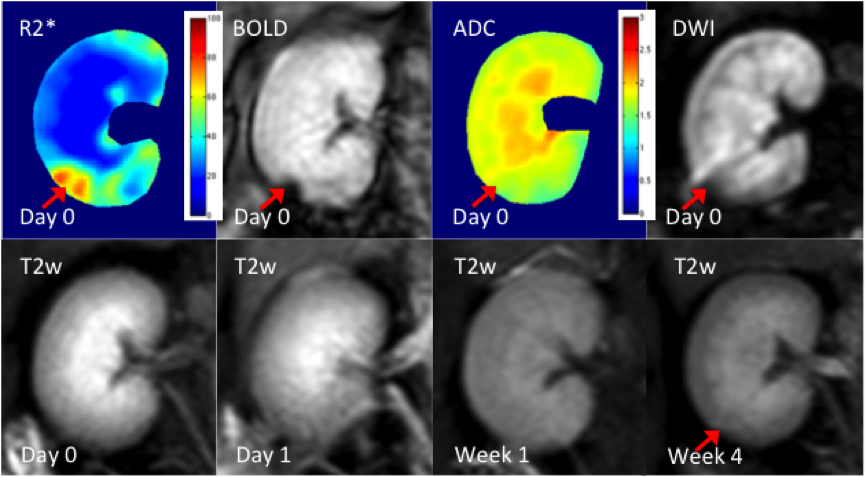
Another example of moderate microemboli-induced AKI is shown in Fig.3. The resected specimen clearly reveals the renal damage (Fig.3c, red arrow). The glomeruli appears basically normal. In the MR images, increased R2* can be seen in the corresponding region, whereas, no ADC change was shown in this case. Minimal volume loss occurred in the T2w images after the moderate AKI.
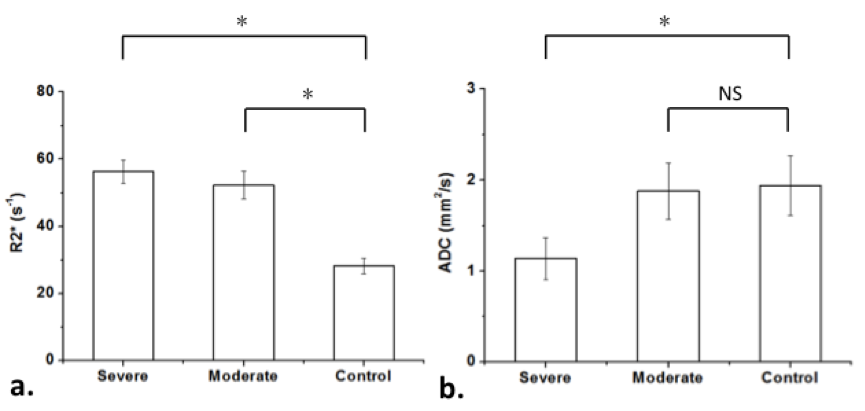
As shown in Fig 5, both R2* and ADC show statistically significant differences between severe AKI group (56.34 ± 3.45 s-1 for R2*, 1.14 ± 0.23 mm2/s for ADC) and control group (28.24 ± 2.26 s-1 for R2*, 1.94 ± 0.33 mm2/s for ADC). However, the ADC values did not show statistically significant differences between moderate AKI group (1.88 ± 0.31 mm2/s for ADC) and the control group (1.94 ± 0.33 mm2/s for ADC), while R2* still seems effective in differentiate the two groups (52.32 ± 4.15 s-1 vs 28.24 ± 2.26 s-1 for R2*).
Discussion & Conclusion
BOLD-contrast and DW images are benefit to non-invasive evaluation of renal function with AKI. Both BOLD and DWI can serve as reliable indicators to focal severe regional ischemia before renal damage occurs. BOLD imaging seems to be more sensitive in early detection of moderate ischemia, while DWI reveals complementary information of the lesions.Acknowledgements
No acknowledgement found.References
1. Fine MJ, et al. Angiology. 1987;42: 769 -784.
2. Thadhani R, et al. Medicine. 1995;74:350 -358.
3. Mayo R, et al. Am J Med. 1996;100:524-529.
Figures