0824
Dynamic Contrast-enhanced MRI in Renal Tumors: Common Subtype Differentiation using Pharmacokinetics1Department of Radiology, Chinese PLA General Hospital, Beijing, People's Republic of China, 2Lift Science, Advanced Application Team, GE Healthcare China, Beijing, People's Republic of China, 3Lift Science, Advanced Application Team, GE Healthcare China, Shanghai, People's Republic of China, 4Department of Radiology, No.1 Hospital of Zhangjiakou, Zhangjiakou, People's Republic of China, 5Department of Pathology, Chinese PLA General Hospital, Beijing, People's Republic of China
Synopsis
In this prospective study on pharmacokinetic parameters (Ktrans & Ve) of renal tumors, we enrolled the patients with five common subtypes of renal tumor - clear cell renal cell carcinoma (ccRCC), papillary renal cell carcinoma (pRCC), chromophobic renal cell carcinoma (cRCC), uroepithelial carcinoma (UEC), and fat poor angiomyolipoma (fpAML) to undergo DCE-MRI pharmacokinetic studies. Our results demonstrated that ccRCC, pRCC, cRCC, UEC and fpAML are pharmacokinetically different (Ktrans & Ve). Ktrans could distinguish ccRCC from non-ccRCC (pRCC & cRCC) and differentiate fpAML with non-ccRCC with high specificity and sensitivity, which probably can facilitate the precise treatment of renal tumors in the future clinical practice.
Synopsis
In this prospective study on pharmacokinetic parameters (Ktrans & Ve) of renal tumors, we enrolled the patients with five common subtypes of renal tumor - clear cell renal cell carcinoma (ccRCC), papillary renal cell carcinoma (pRCC), chromophobic renal cell carcinoma (cRCC), uroepithelial carcinoma (UEC), and fat poor angiomyolipoma (fpAML) to undergo DCE-MRI pharmacokinetic studies. Our results demonstrated that ccRCC, pRCC, cRCC, UEC and fpAML are pharmacokinetically different (Ktrans & Ve). Ktrans could distinguish ccRCC from non-ccRCC (pRCC & cRCC) and differentiate fpAML with non-ccRCC with high specificity and sensitivity, which probably can facilitate the precise treatment of renal tumors in the future clinical practice.Purpose
To document dynamic contrast-enhanced DCE-MRI (DCE-MRI) pharmacokinetics (Ktrans & Ve) of common renal tumors and investigated the value of Ktrans & Ve for differentiating renal tumor subtypes.Materials and Methods
Our Institutional Review Board approved this prospective study. Written informed consent was obtained from all subjects. Patients with renal tumors were evaluated on a 3.0 T MR system from September 2012 to December 2013. An extended-Tofts model and population-based arterial input function were used to calculate kinetics. DCE-MRI pharmacokinetics differences among renal tumor subtypes were analyzed with ANOVA. A receiver operation characteristics (ROC) curve was used to evaluate DCE-MRI efficacy.Result
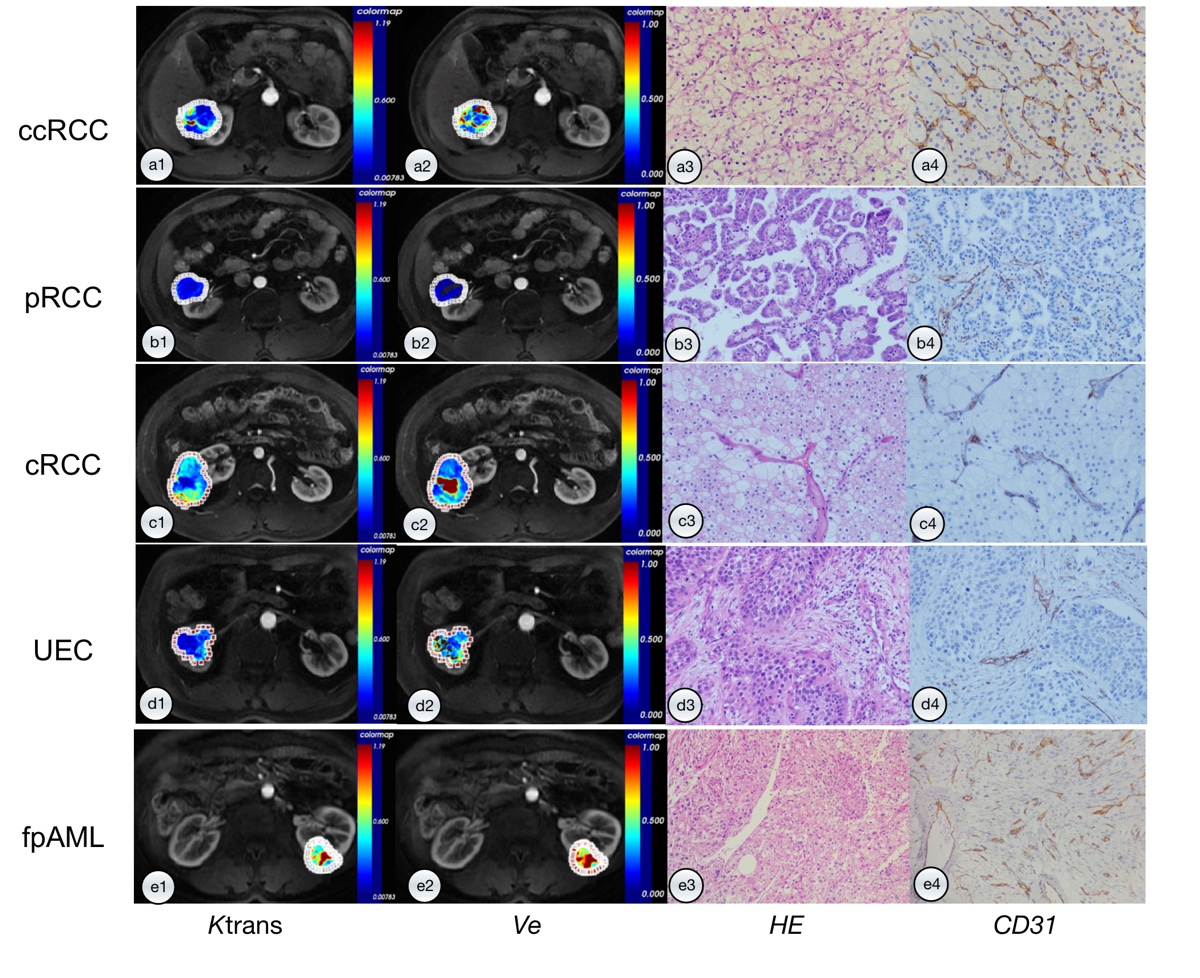
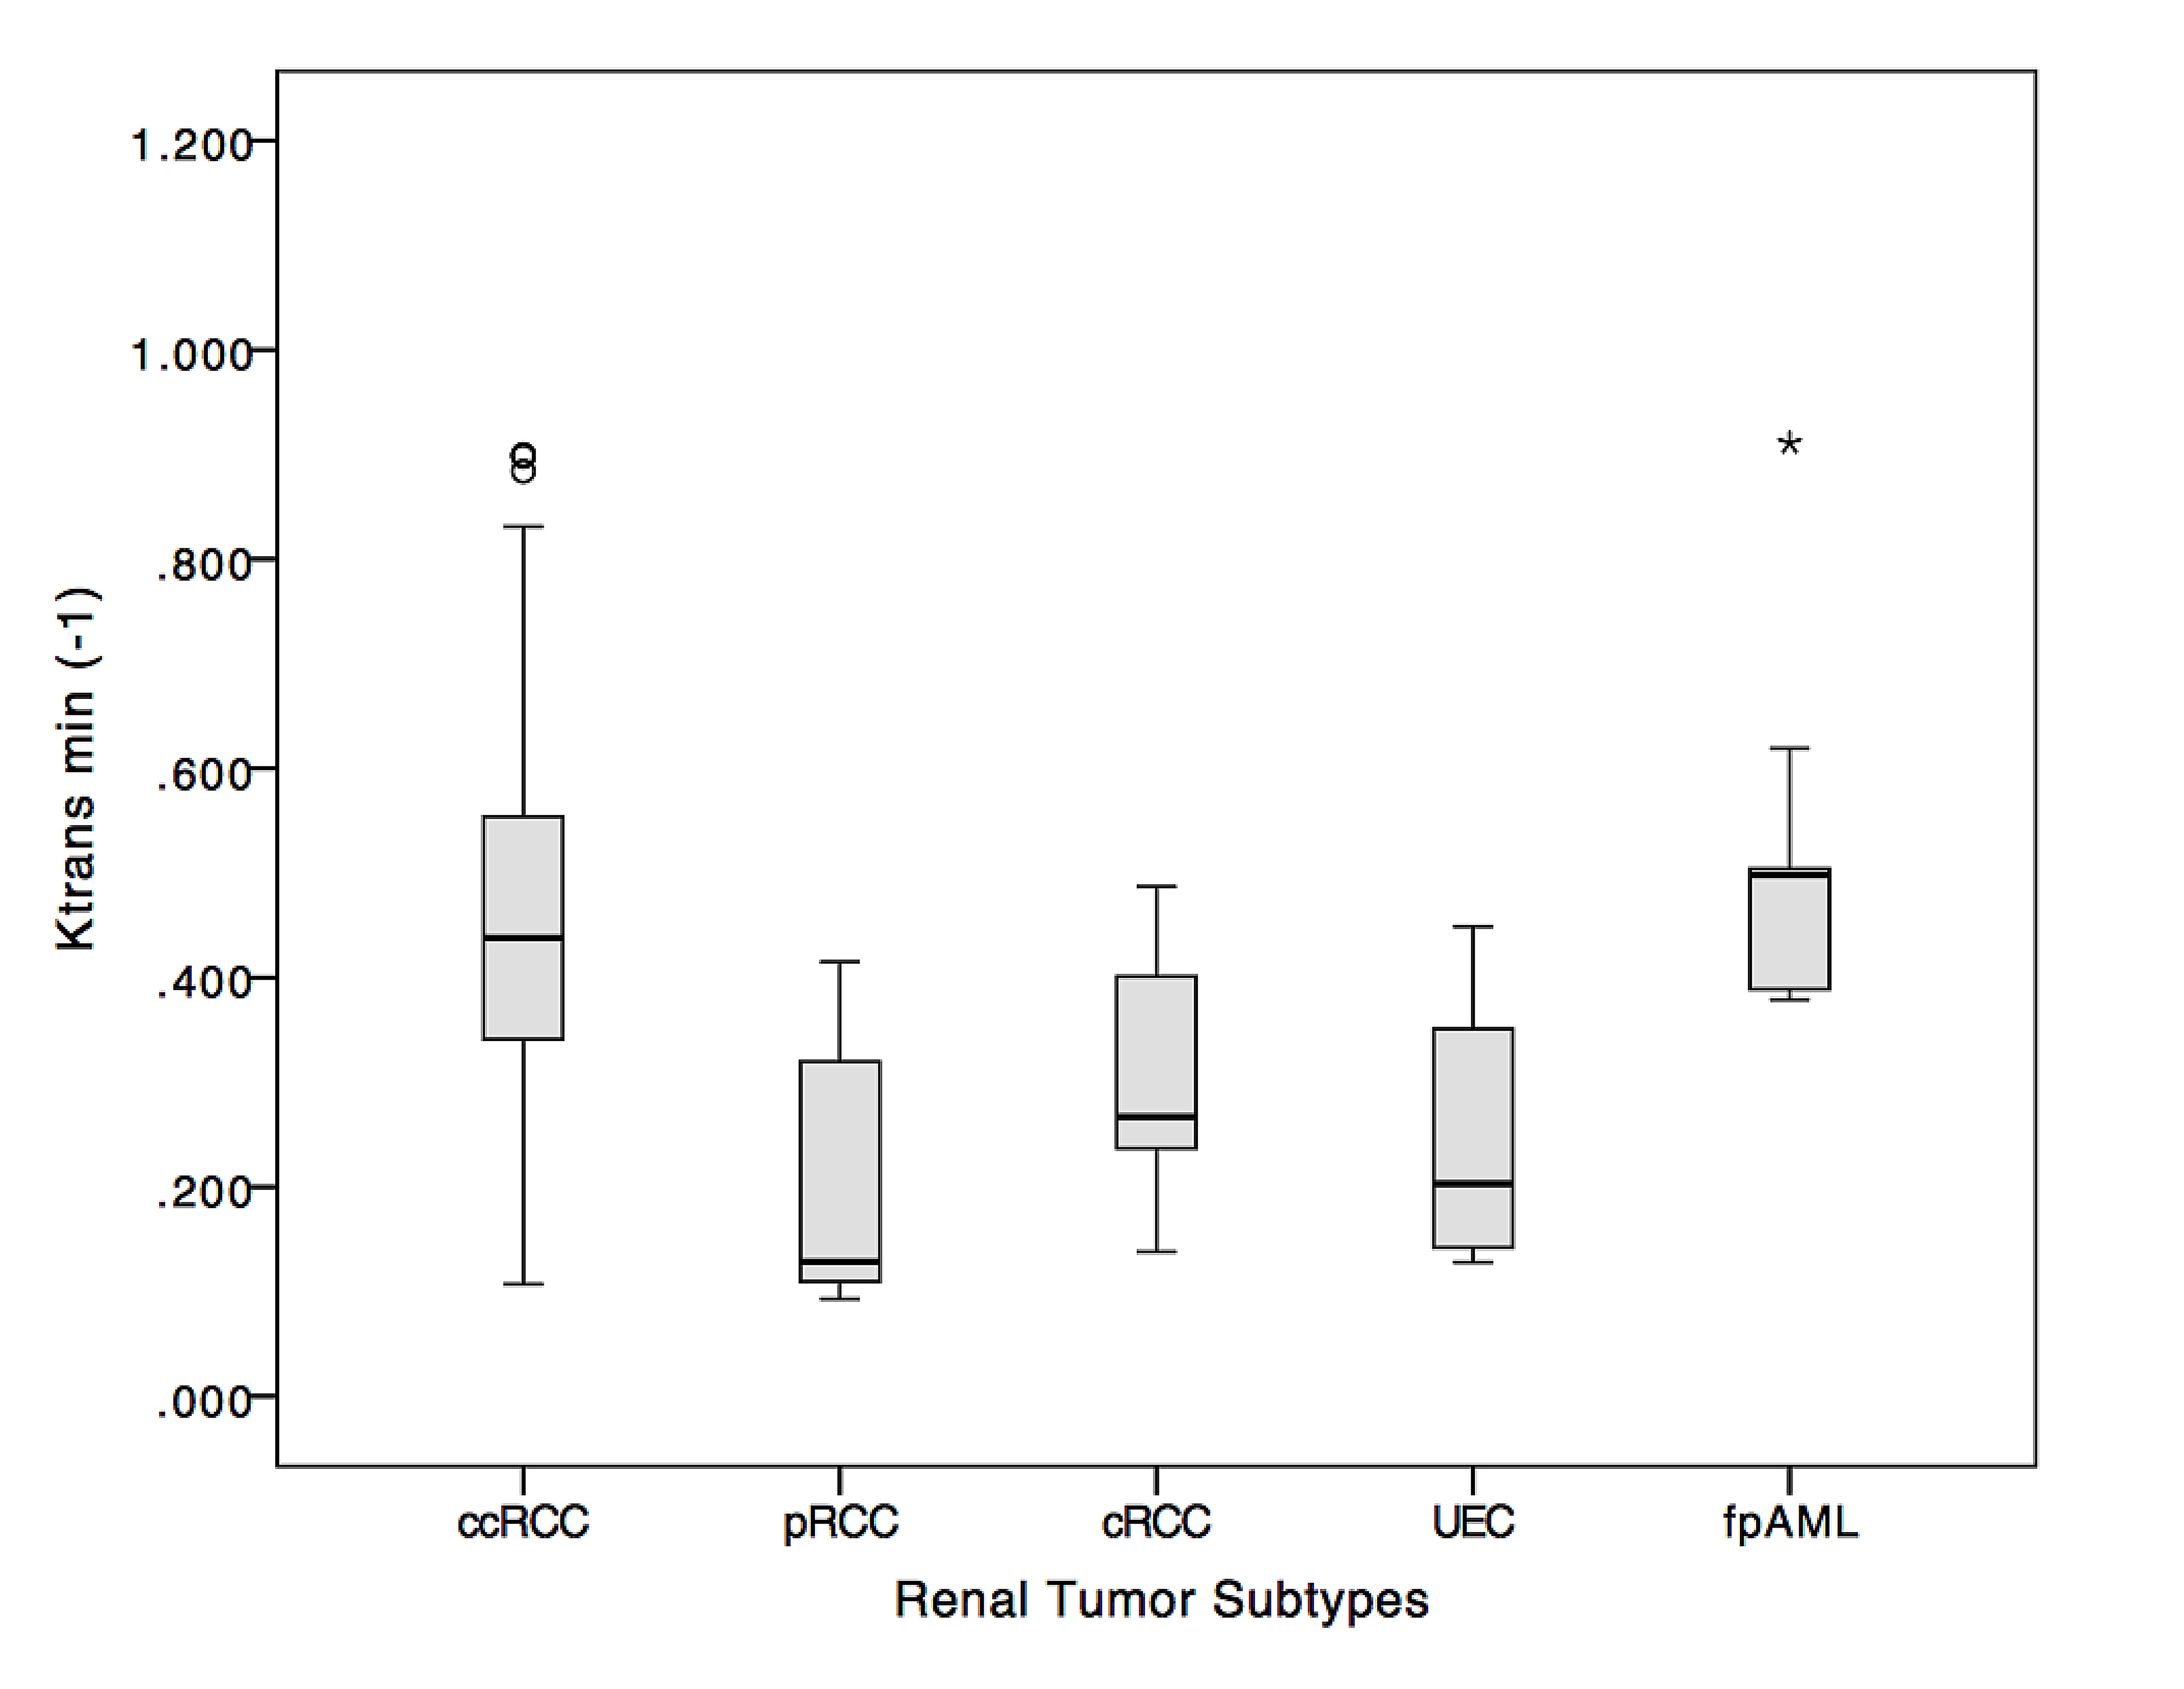
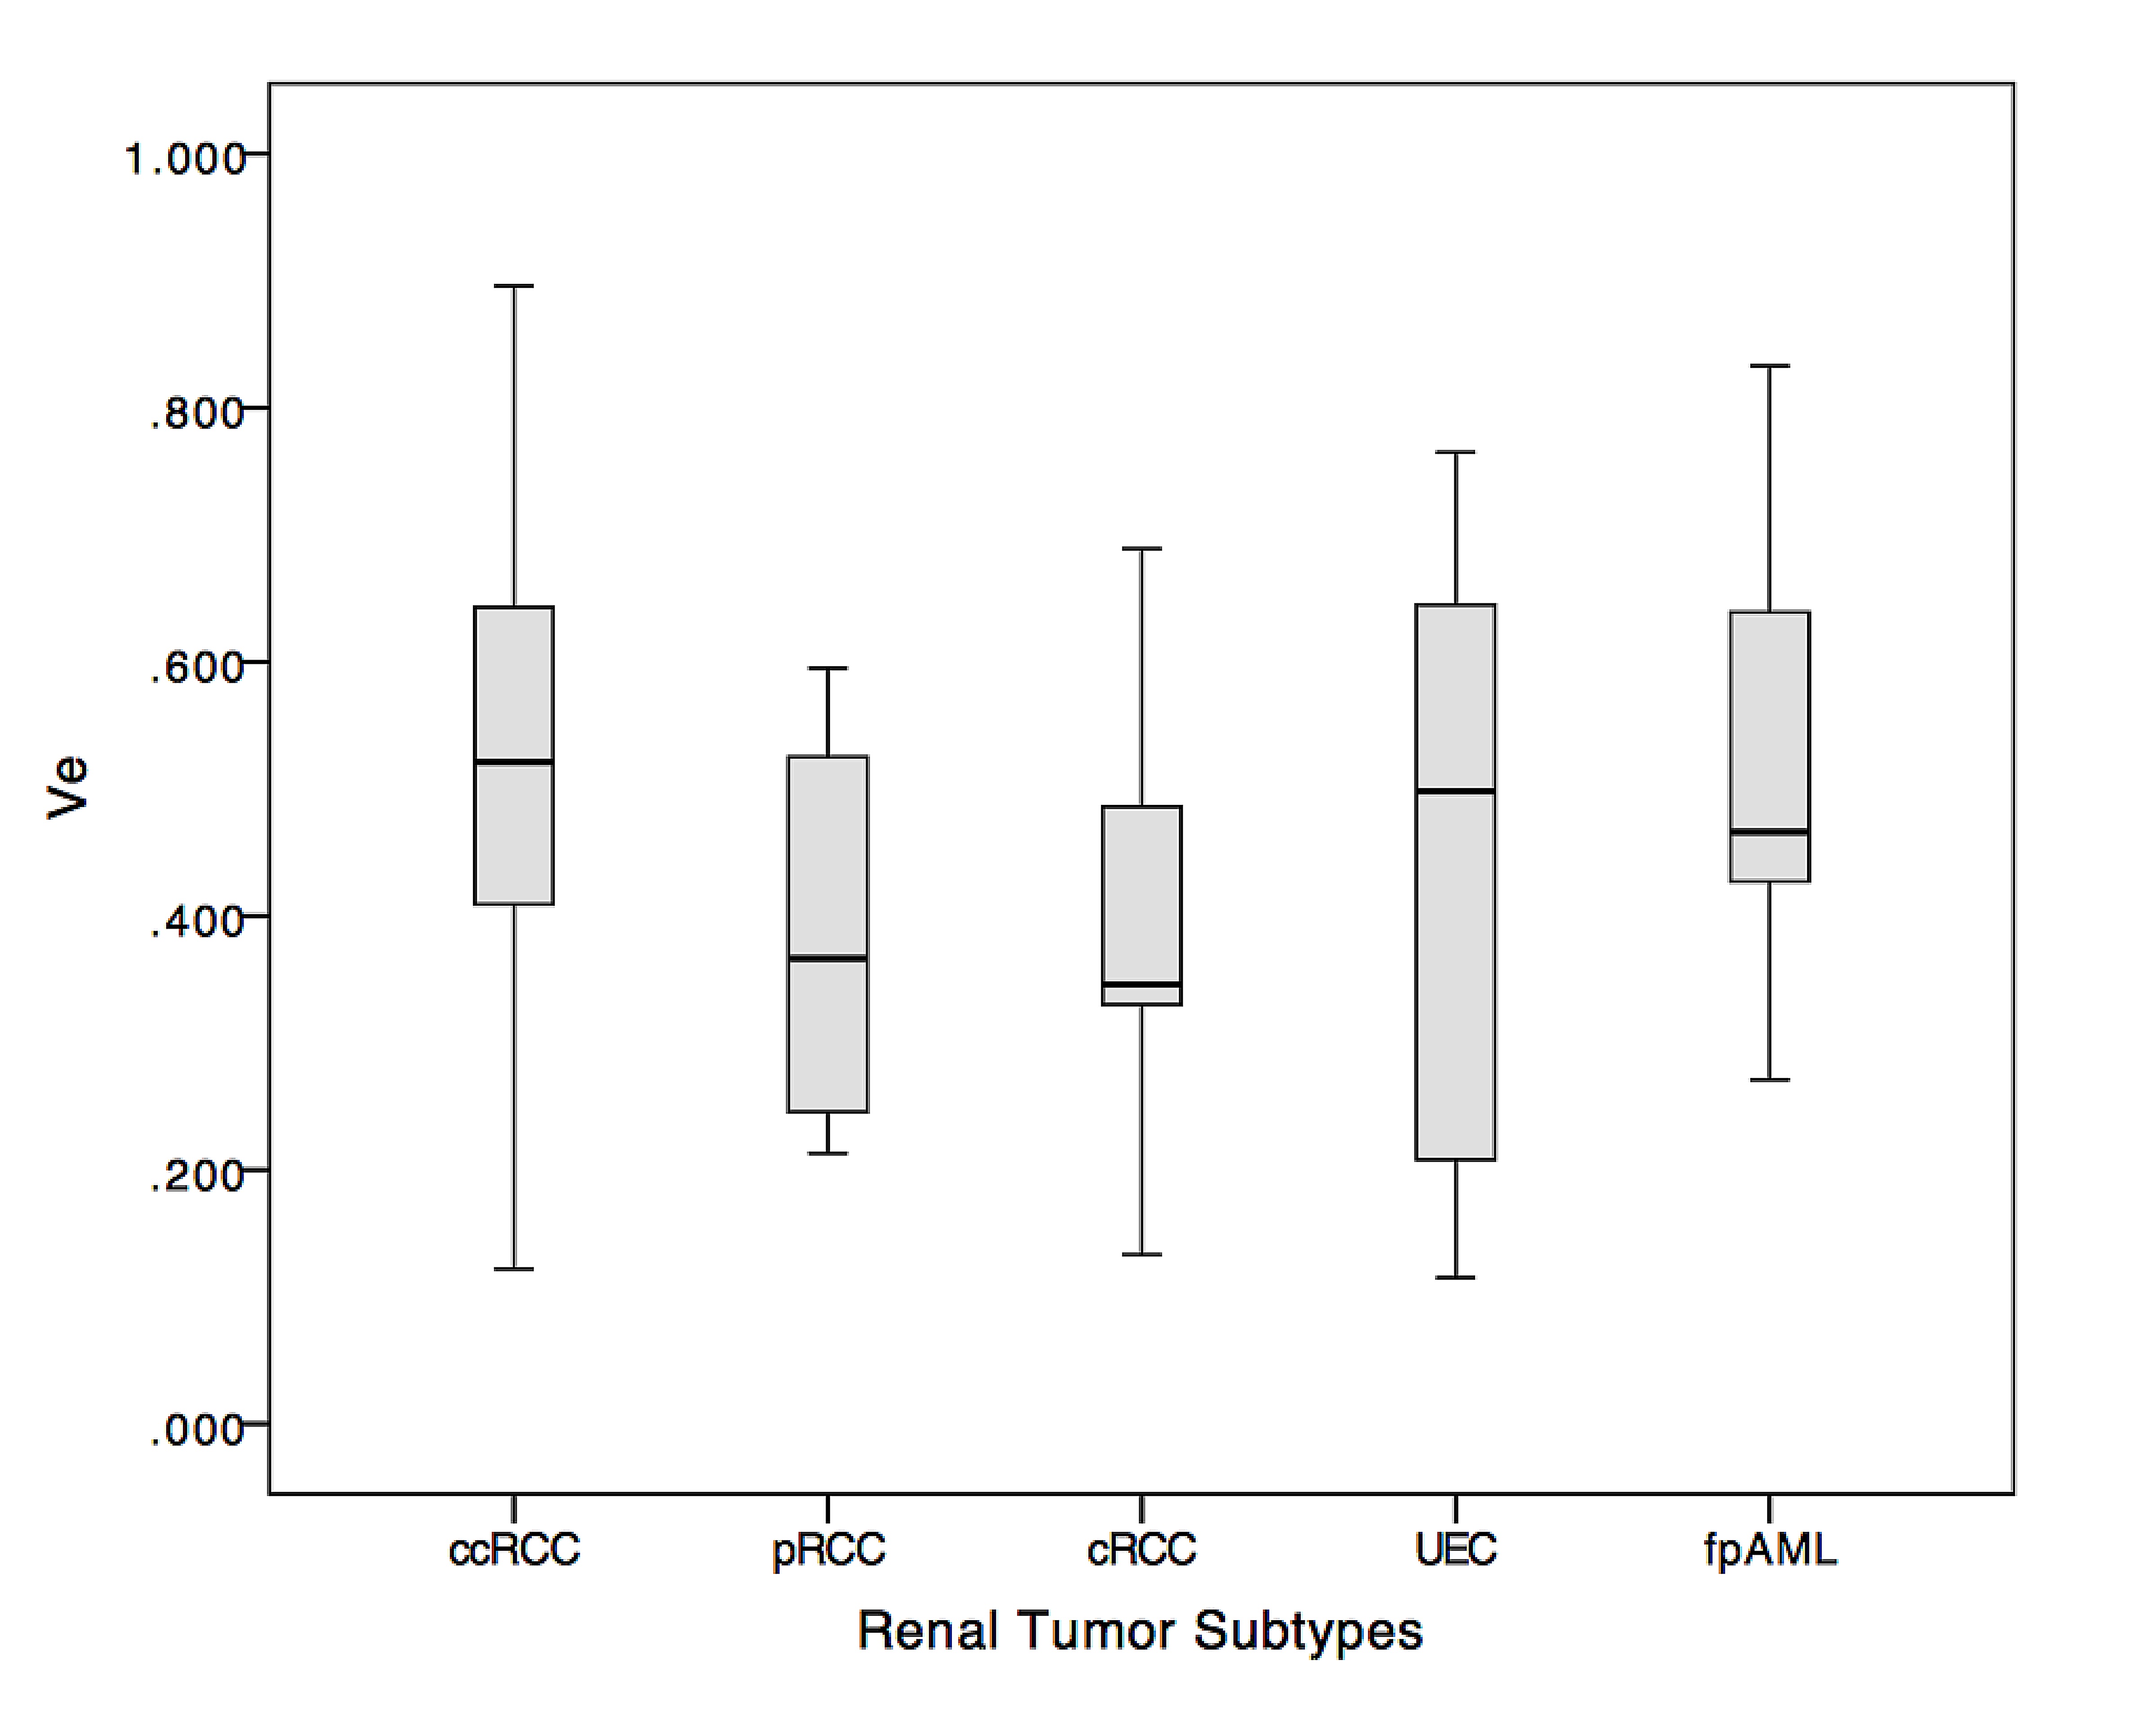
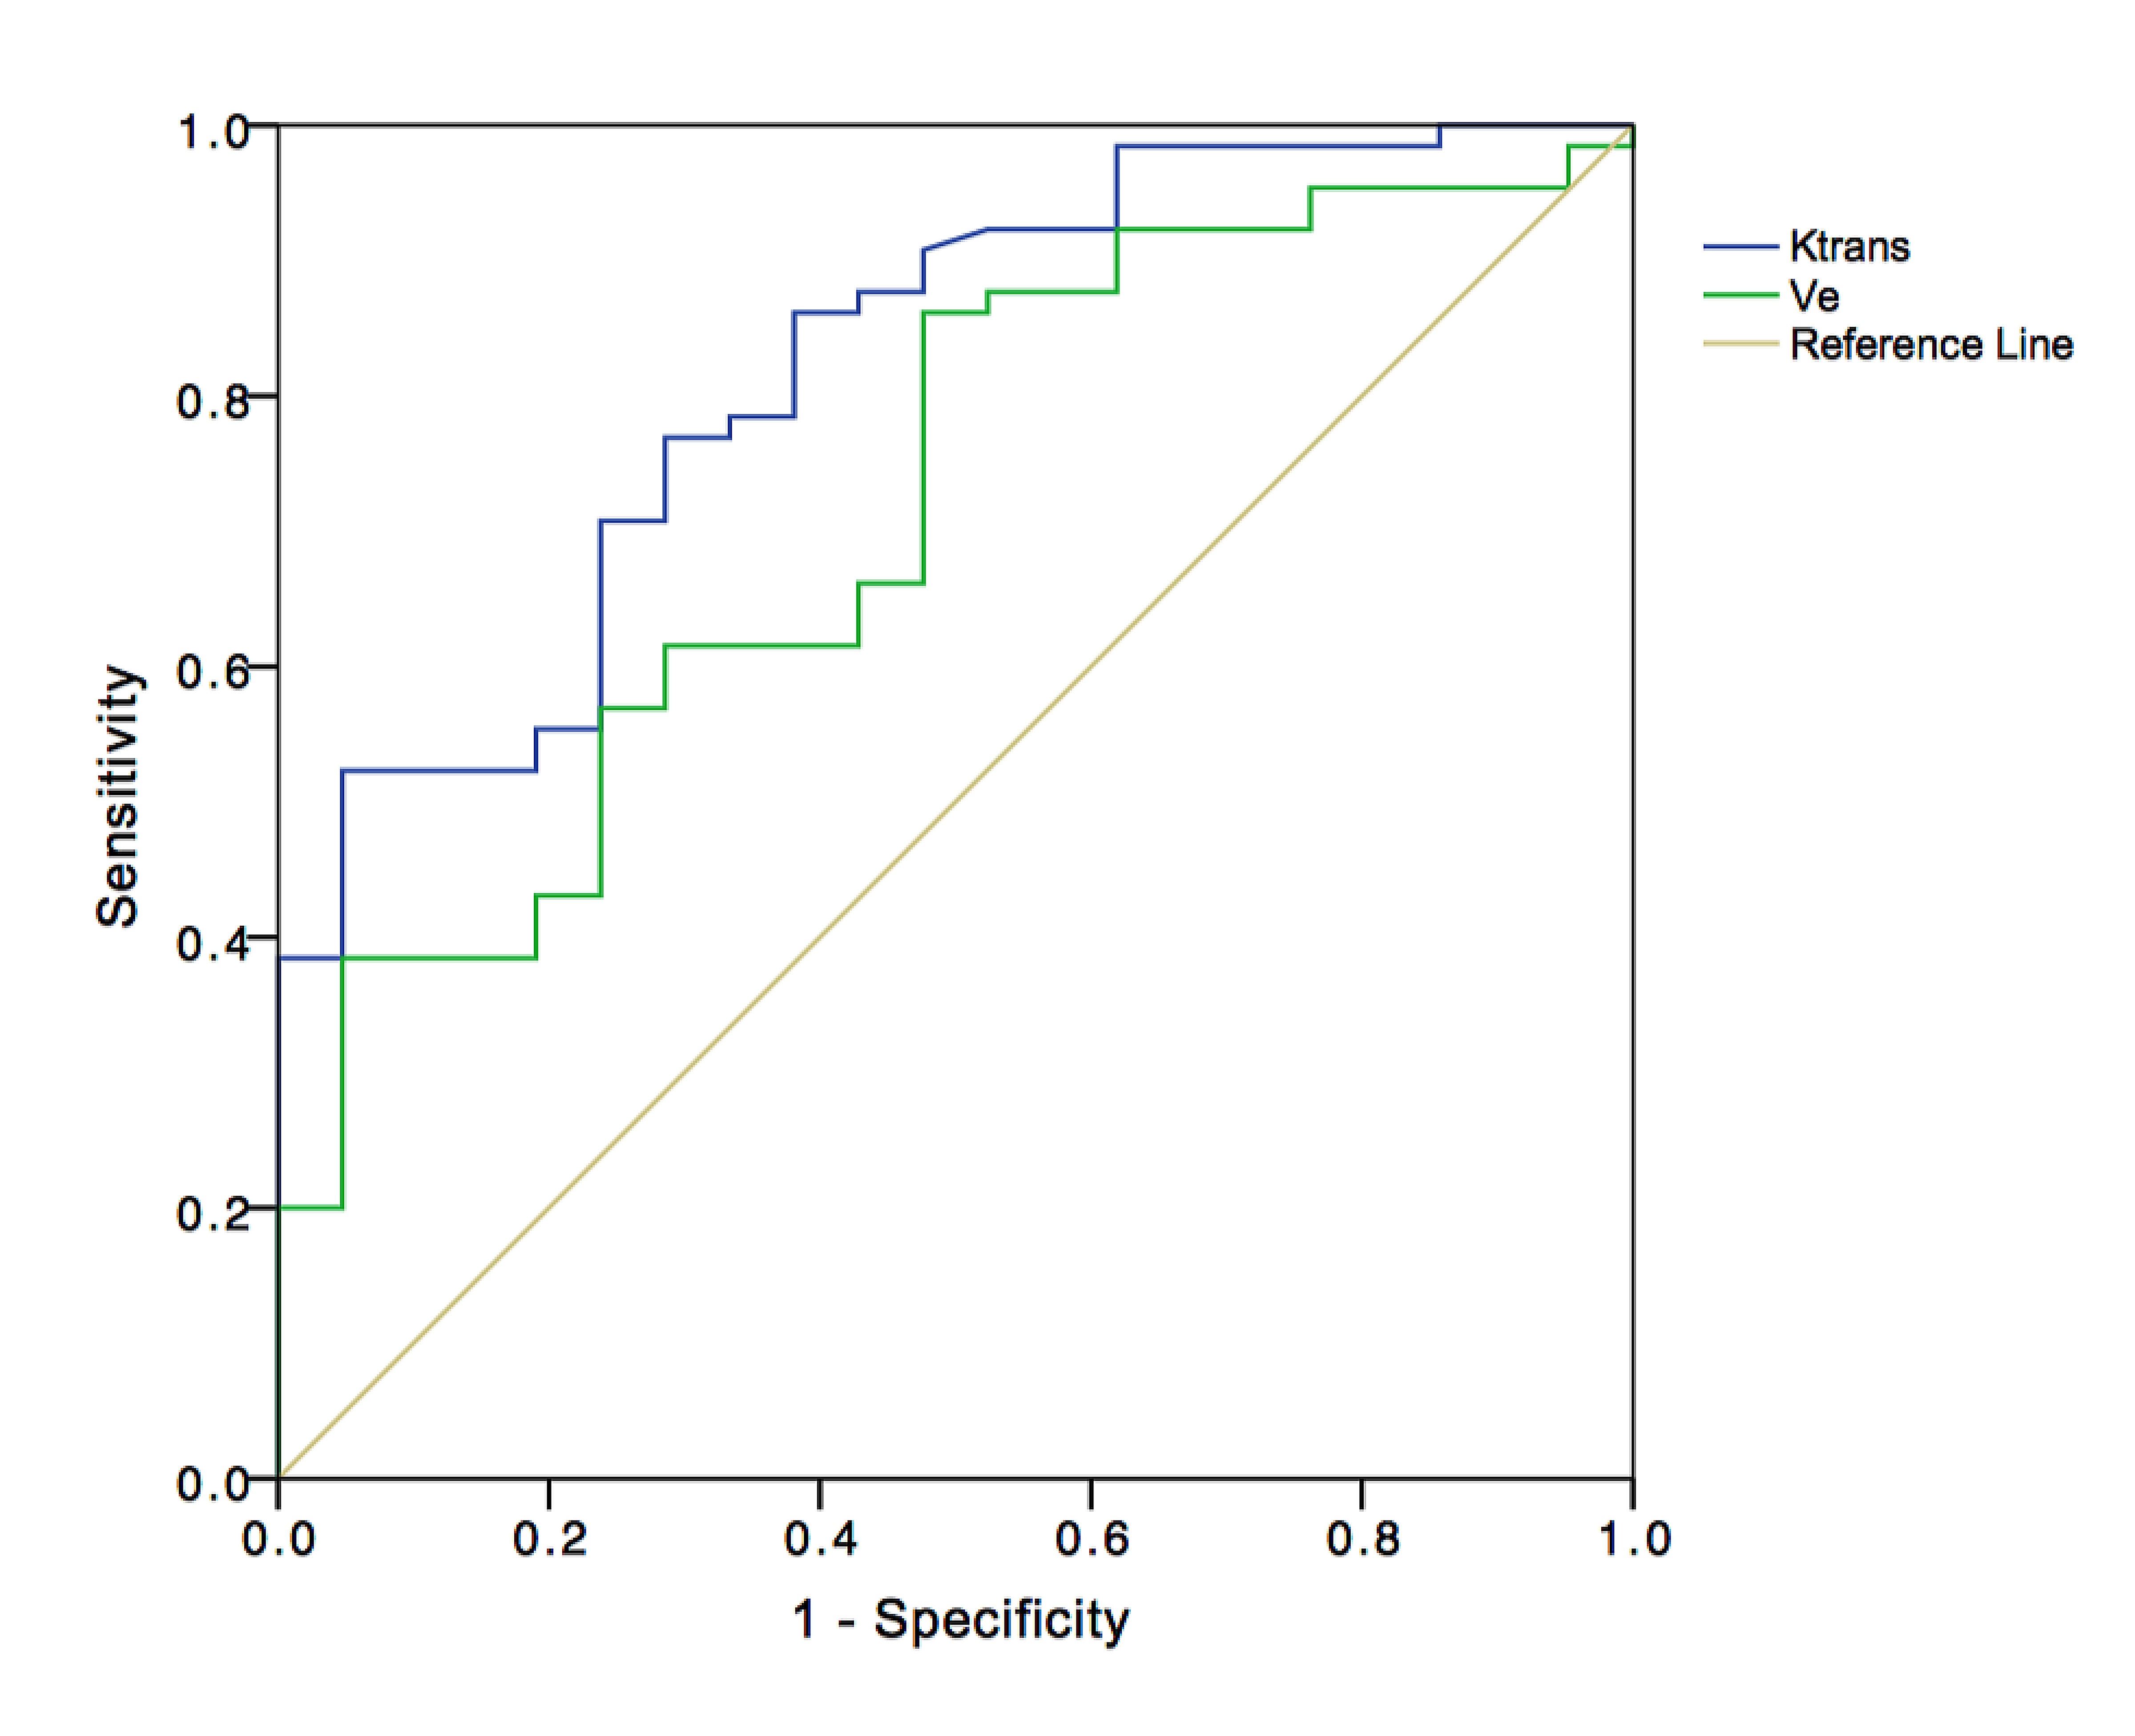
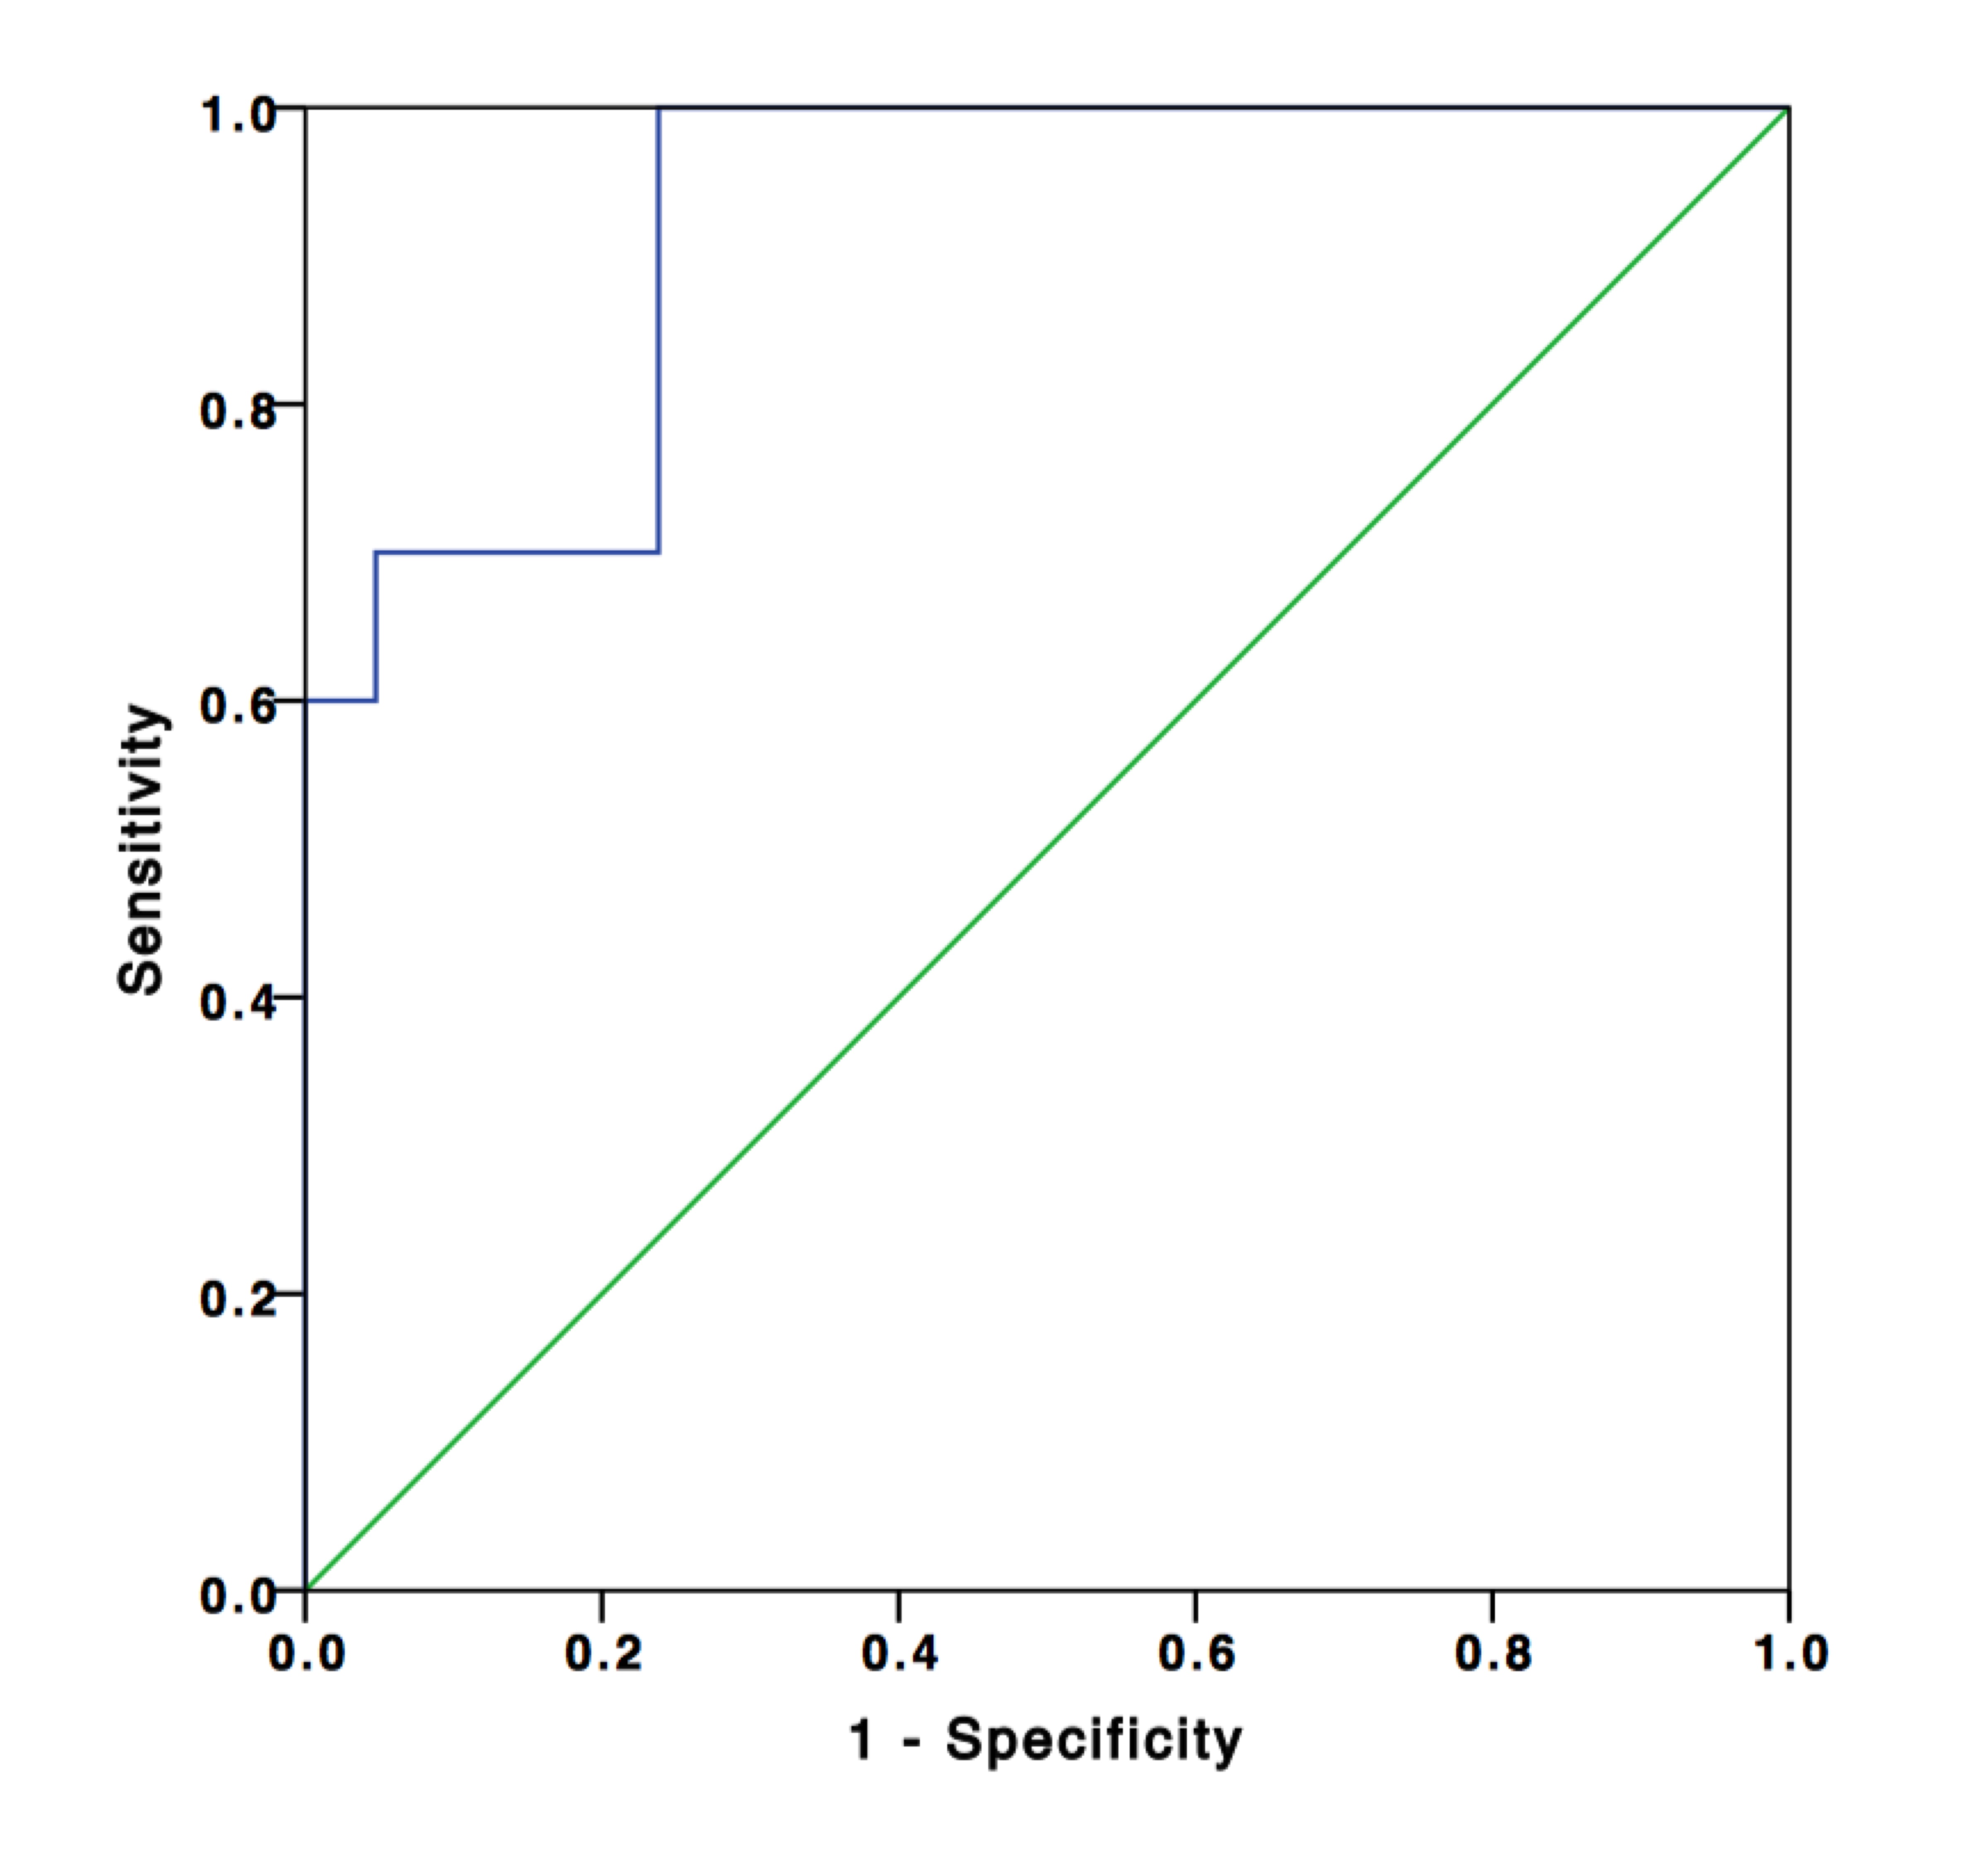
Patients with renal tumors (n = 110) including clear cell renal cell carcinoma (ccRCC) (n = 65), papillary renal cell carcinoma (pRCC) (n = 12), chromophobic renal cell carcinoma (cRCC) (n = 9), uroepithelial carcinoma (UEC) (n = 14), and fat poor angiomyolipoma (fpAML) (n = 10) were enrolled (Figure 1). Ktrans and Ve were statistically different among the tumors types (p<0.001 and p=0.044 respectively) (Figure 2 & 3), however, differences in Ktrans and Ve between renal malignant tumors and benign tumors were not statistically significant (p = 0.064, p = 0.721,respectively). Ktrans and Ve differences between ccRCC and non-ccRCC (pRCC & cRCC) were statistically significant (p < 0.001 and p = 0.002 respectively). A Ktrans threshold of 0.33 min-1 could distinguish tumors with 76.9% sensitivity, 71.4% specificity, a Youden’s index of 0.483, and an area under the ROC curve (AUC) of 0.819 (Figure 4). Ktrans differences between fpAML and non-ccRCC was significant (p < 0.001); and Ktrans greater than 0.365 min-1 could distinguish fpAML and non-cc RCC with 100% sensitivity, 76.2% specificity, a Youden’s index of 0.762, and an AUC of 0.924. Ktrans of RCCs and UEC were statistically significantly different (p = 0.015) (Figure 5). A threshold Ktrans value of 0.563 min-1 can distinguish RCC from UEC with sensitivity of 84.9%, specificity of 71.4% and a Youden’s index of 0.762, respectively, and the AUC of ROC curve was 0.766 (95% CI: 0.646~0.886).Discussion
Among five renal tumor subtypes, fpAML demonstrated the greatest Ktrans followed by ccRCC, cRCC, UEC and pRCC, although fpAML and ccRCC were not different statistically. Ktrans of ccRCC was greater than that of pRCC, and this agrees with the literature (1). fpAML had the greatest Ktrans likely because of thick-walled blood vessels that lack arterial elasticity (2,3). ccRCC tumors have a rich and regular network of small thin-walled blood vessels, which may create high Ktrans. pRCC tumor had few blood vessels, which may cause low Ktrans. Using Ktrans and Ve to distinguish renal benign and malignant tumors produced no statistically significant differences and this may be explained by the fact that ccRCC accounted for most malignant tumors and their pharmacokinetics were similar to fpAML. For ccRCC and non-ccRCC, Ktrans and Ve were statistically significantly different and Ktrans had a large AUC of the ROC curve for diagnosing ccRCC compared to Ve (0.819 vs 0.716). Ktrans had greater specificity but similar sensitivity to Ve. Moreover, we focused on differentiation of fpAML and non-ccRCCs. Ktrans was statistically significantly different between fpAML and non-ccRCC and the AUC of the ROC curve was 0.924. When the cutoff value of Ktrans with 0.365 min-1 was selected, the sensitivity and specificity of fpAML were 100% and 71.4%, respectively. Increasing the threshold Ktrans value to 0.427 min-1, improved the specificity and the sensitivity decreased, which may be evidence for preoperative distinctions between fpAML and non-ccRCC. Uroepithelial carcinoma of the renal pelvis or renal pelvic carcinoma that invaded the renal parenchyma may mimic RCC in the center of the kidney. We observed that RCCs have larger Ktrans than UECs, likely because RCCs have a higher microvascular density than UECs. With cutoff value of 0.228 min-1, Ktrans can distinguish RCCs from UEC with AUC of 0.766 and a sensitivity of 86% and a specificity of 71.4%, respectively, which may be a novel method for distinguishing between these kinds of tumors. For the DCE-MRI technique, we chose a population averaged AIF instead of a personal AIF to perform pharmacokinetic calculations. Due to the non-continuous scanning mode of the DCE-MRI for balancing clinical practice and scientific research needs, the temporal resolution of DCE-MRI was limited. Thus, we used a population-based AIF method which addressed temporal resolution difficulties and reduced AIF ROI location and sizing errors reported previously (4). In addition, the population-based AIF works equally well as the individual AIF for estimating pharmacokinetics, as confirmed by several investigators (5-7).Conclusion
DCE-MRI kinetic measurements are promising for differential diagnosis of renal tumors, especially for RCC subtype characterization, and distinguishing between fpAML and non-ccRCC.Acknowledgements
We would like to express our gratitude for the technical support and assistance from Zhenyu Zhou Ph.D. and Dandan Zheng Ph.D. of MR Research GE Healthcare China.References
1. Chandarana H, Amarosa A, Huang WC, et al. High temporal resolution 3D gadolinium-enhanced dynamic MR imaging of renal tumors with pharmacokinetic modeling: preliminary observations. Journal of magnetic resonance imaging : JMRI 2013;38(4):802-808.
2. Esheba Gel S, Esheba Nel S. Angiomyolipoma of the kidney: clinicopathological and immunohistochemical study. Journal of the Egyptian National Cancer Institute 2013;25(3):125-134.
3. John N. Eble SG, Jonathan I. Epstein, Isabell A. Sesterhenn. World Health Organization classification of tumours: Pathology and Genetics of Tumours of the Urinary System and Male Genital Organs. France: Lyon: IARC Press: 2004. 359 p.
4. Cutajar M, Mendichovszky IA, Tofts PS, Gordon I. The importance of AIF ROI selection in DCE-MRI renography: reproducibility and variability of renal perfusion and filtration. European journal of radiology 2010;74(3):e154-160.
5. Wang Y, Huang W, Panicek DM, Schwartz LH, Koutcher JA. Feasibility of using limited-population-based arterial input function for pharmacokinetic modeling of osteosarcoma dynamic contrast-enhanced MRI data. Magnetic resonance in medicine : official journal of the Society of Magnetic Resonance in Medicine / Society of Magnetic Resonance in Medicine 2008;59(5):1183-1189.
6. Parker GJ, Roberts C, Macdonald A, et al. Experimentally-derived functional form for a population-averaged high-temporal-resolution arterial input function for dynamic contrast-enhanced MRI. Magnetic resonance in medicine : official journal of the Society of Magnetic Resonance in Medicine / Society of Magnetic Resonance in Medicine 2006;56(5):993-1000.
7. Li X, Welch EB, Arlinghaus LR, et al. A novel AIF tracking method and comparison of DCE-MRI parameters using individual and population-based AIFs in human breast cancer. Physics in medicine and biology 2011;56(17):5753-5769.
Figures