0822
Quantitative Volumetric Histogram Analysis of Diffusion-weighted Magnetic Resonance Imaging: An Initial Experience of Solid Renal Cell Carcinoma with Different Prognosis1Department of Radiology, Tongji Hospital, Tongji Medical College, Huazhong University of Science and Technology, Wuhan, People's Republic of China
Synopsis
To evaluate the value of quantitative volumetric ADC histogram analysis for differentiation of clear cell RCC (ccRCC) from papillary RCC (pRCC) and chromophobe RCC (chRCC) which having different prognosis. Differences of ADC histogram parameters between better prognosis group and worse prognosis group were compared. There were significant differences on ADCmean, ADCmedian, ADC10%, ADC25%, ADC75%, ADC90% and skewness between these two different prognosis groups and the ADC10% showed the best diagnostic value. Therefore, quantitative volumetric ADC histogram analysis can be considered a useful and noninvasive method to help distinguish three subtypes renal cell carcinomas which having different prognosis.
Introduction
Renal cell carcinoma (RCC) is one of the most common tumors in clinic. Several studies reported that histologic subtype of RCC has been strongly correlated with prognosis. They found that clear cell subtype was more aggressive, while papillary and chromophobe subtypes were less aggressive1. Therefore, reliable noninvasive determination of histologic subtype may facilitate subtype specific treatment decisions.Purpose
The purpose of this study was to determine whether quantitative volumetric histogram analysis on diffusion-weighted MRI (DWI) is helpful for distinguishing clear cell RCC (ccRCC) from papillary RCC (pRCC) and chromophobe RCC (chRCC) which having different prognosis.Methods
We retrospectively reviewed 168 adult patients with suspected renal tumors with magnetic resonance imaging (MRI) including DWI (b=0, 800s/mm2) performed on a 3-T system (Discovery 750, GE Medical System, Milwaukee, WI). Finally, a total of 51 patients with solid renal tumors were included in this study and all the cases were diagnosed pathologically. These patients were divided into two groups: Group A (better prognosis, 18 with pRCC and 13 with chRCC) and Group B (worse prognosis, 20 with ccRCC). Quantitative volumetric tumor regions of interest (ROIs) were drawn around the entire tumor on all slices of the ADC maps to obtain histogram parameters, including ADCmean, ADCmedian, ADC10%, ADC25%, ADC75%, ADC90%, entropy, skewness and kurtosis. The Student’s t-test was used for the comparison of each parameter between these two groups. Multiple receiver operating characteristic (ROC) curves analysis was used to determine and compare the diagnostic value of each significant parameter.Results
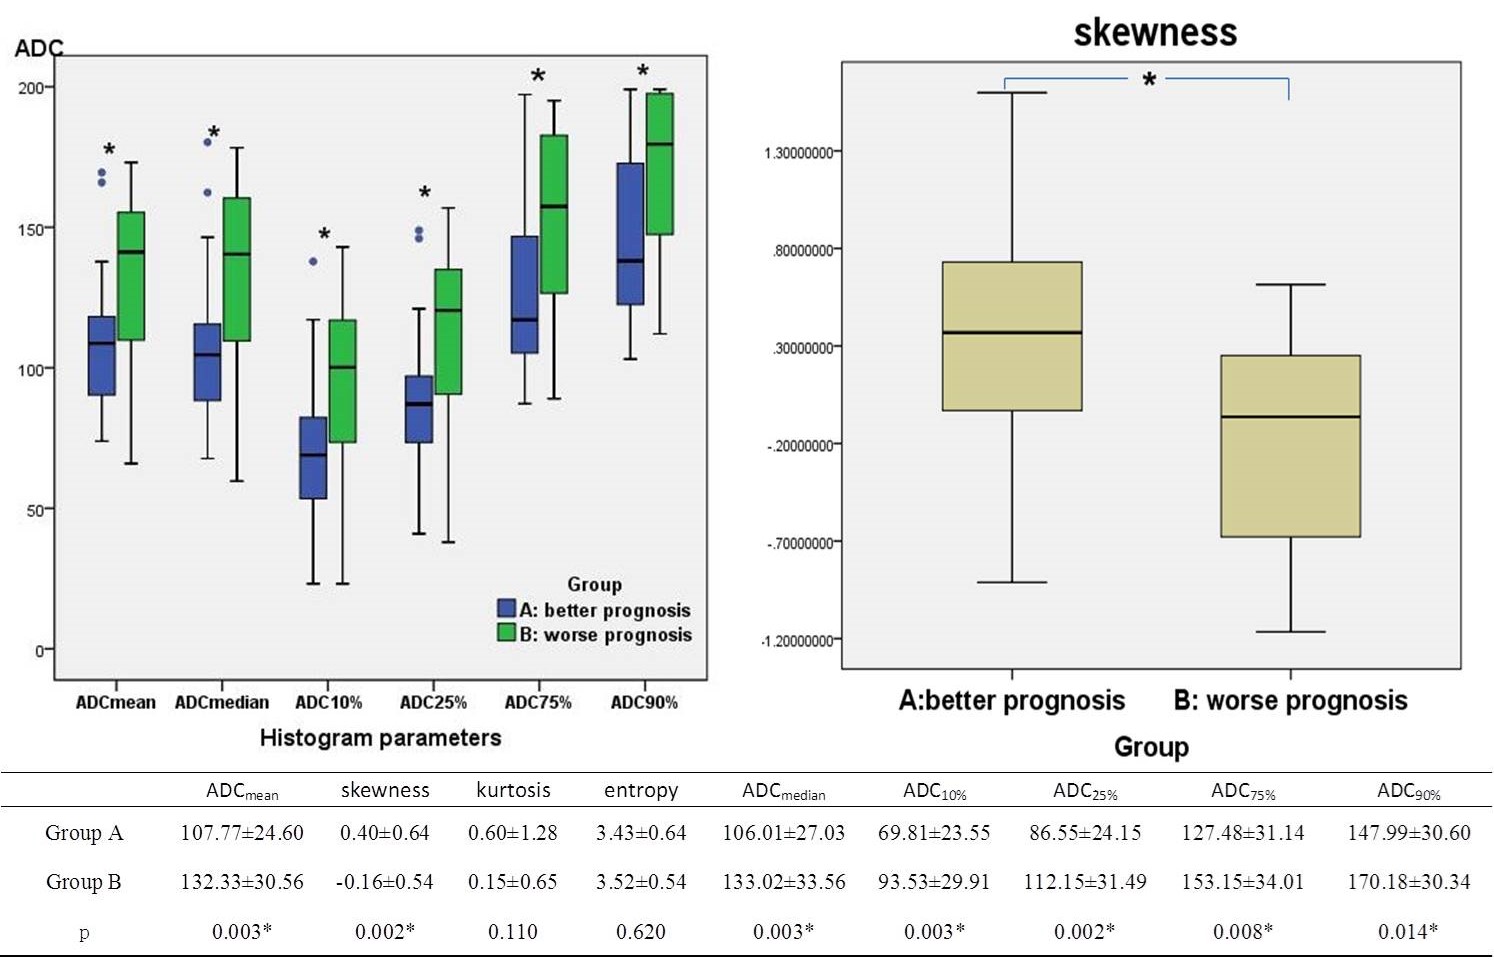
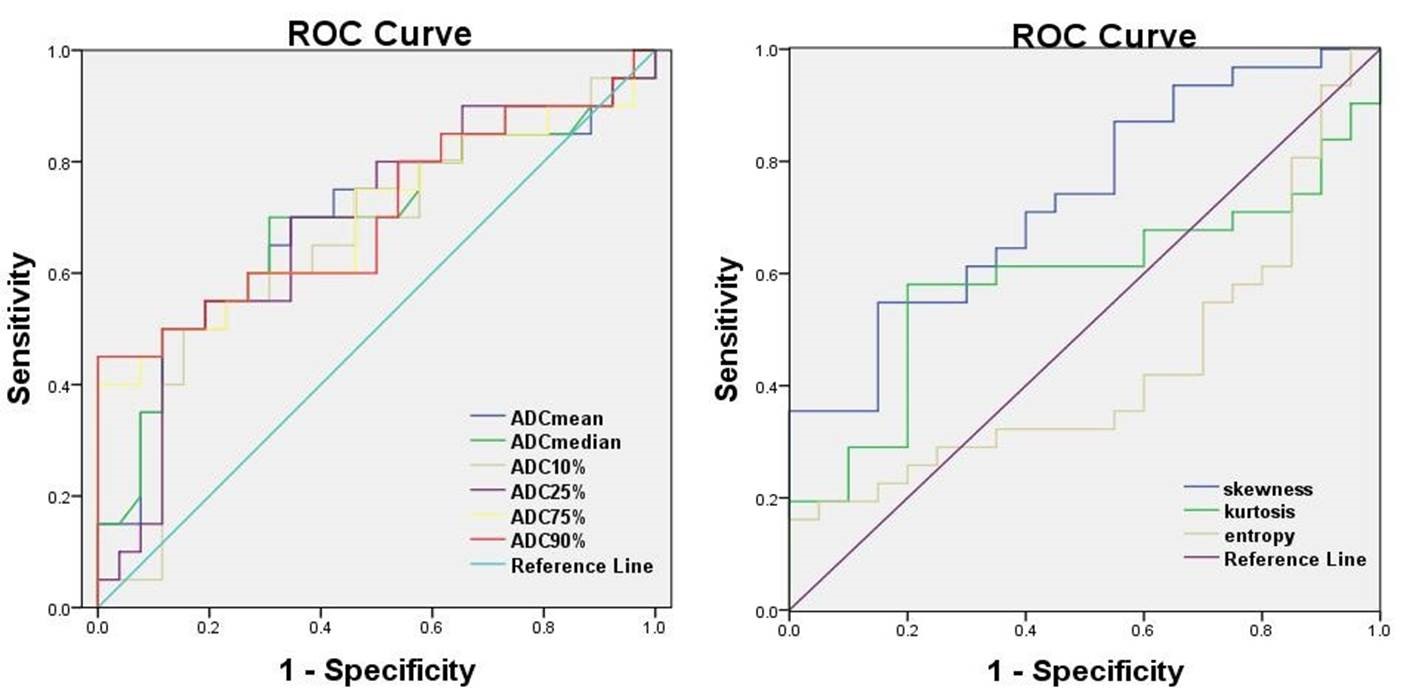
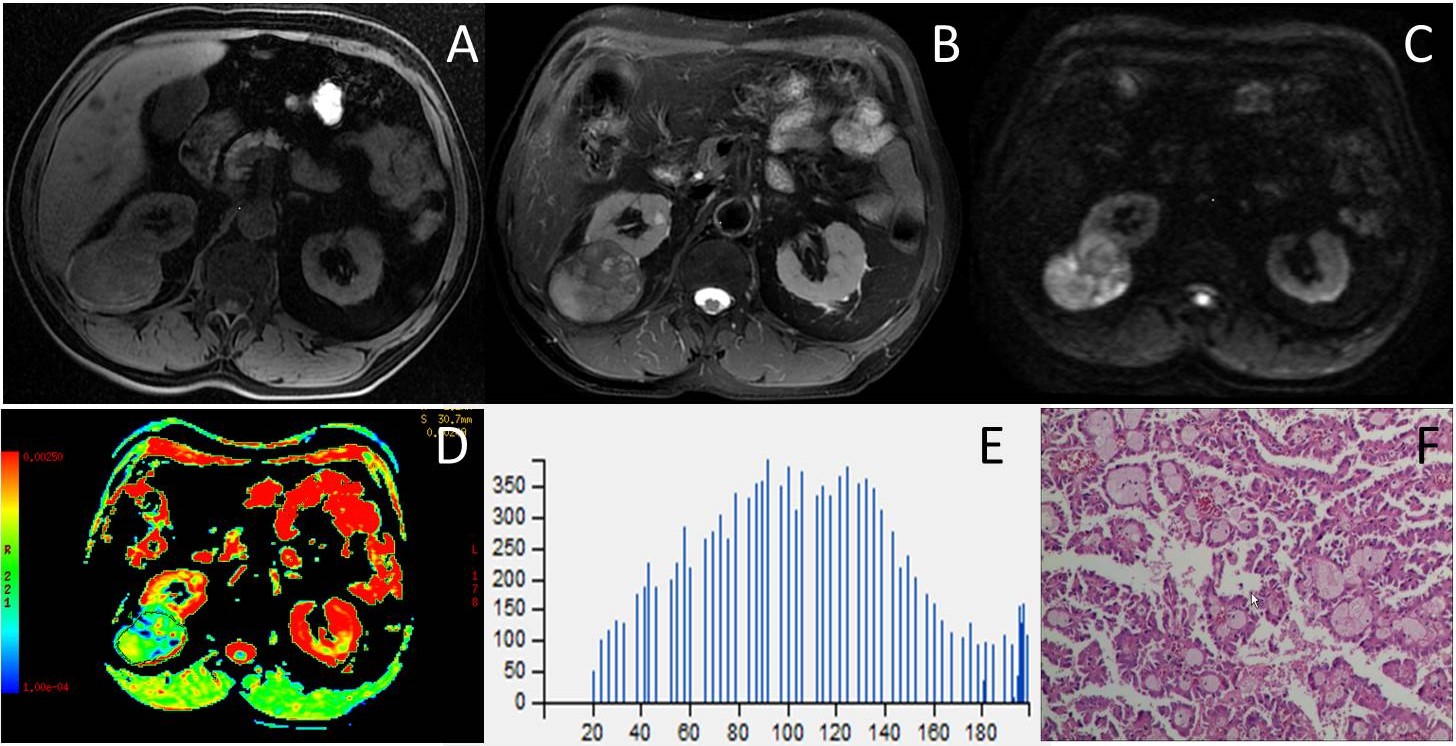
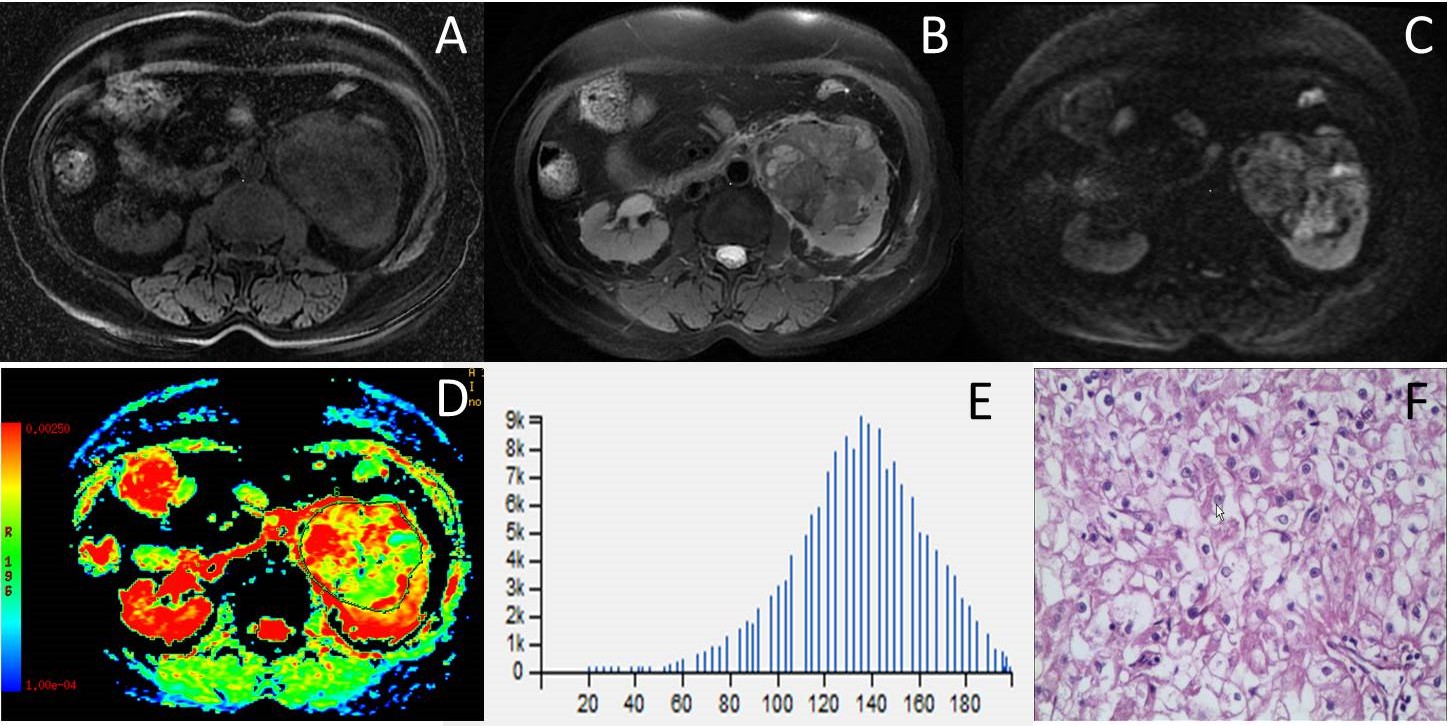
Group B had significantly higher ADCmean, ADCmedian, ADC10%, ADC25%, ADC75%, and ADC90% values compared to Group A (P=0.003, P=0.003, P=0.003, P=0.002, P=0.008, P=0.014, respectively). The majority ADC value of Group B was concentrated on the right of the histogram but Group A was concentrated on the left of the histogram (skewness= -0.16±0.54, 0.40±0.64, respectively, P=0.002). There was no significant difference was found on kurtosis and entropy (P=0.110, P=0.620, respectively) (Fig.1, 3, 4). During ROC curves analysis, compared with Group A and Group B, the ADC10% value generated the highest AUC for differentiating these two groups (AUC, 0.753; Sensitivity, 65%; Specificity, 84%; cut-off value, 0.839×10⁻³ mm2/s), while the ADCmean value generated higher AUC for differentiating these two groups (AUC, 0.731; Sensitivity, 50%; Specificity, 93%; cut-off value, 1.430×10⁻³ mm2/s) (Fig.2).Discussion
Most of the previous literatures have studied the average ADC, couldn’t reflect the diffusion characteristic of entire tumor comprehensively2. In the current study, volumetric histogram analysis has described the comprehensive characteristics of entire tumors’ ADC values. It’s a quantitative method that provides an assessment of tumor heterogeneity by analyzing the distribution and relationship of voxel signal intensity in the image3. The results of this study showed that the ADCmean, ADCmedian, ADC10%, ADC25%, ADC75%, and ADC90% of Group B was significantly higher than those of Group A, which may indicate that water molecular diffusion was more restricted in better prognosis group. The histogram of worse prognosis group shows a large portion of voxels with high ADC values, while the histogram of better prognosis group shows a large portion of voxels with low ADC values. In addition, the ADC10% value generated the highest AUC for differentiating these two groups with different prognosis, but the ADCmean value generated higher AUC for differentiating these two entities.Conclusion
Quantitative volumetric histogram analysis on DWI showed a significant shift towards skewness and higher ADCmean, ADCmedian, ADC10%, ADC25%, ADC75%, and ADC90% in better prognosis patients with pRCC and chRCC compared with worse prognosis patients with ccRCC. In a word, volumetric tumor ADC histogram parameters can be used as a quantitative tool to distinguish three subtypes renal cell carcinomas which having different prognosis.Acknowledgements
No acknowledgement found.References
1. Campbell N, Rosenkrantz AB, Pedrosa I. MRI phenotype in renal cancer: is it clinically relevant? Top Magn Reson Imaging 2014; 23:95–115.
2. Choi YA, Kim CK, Park SY, et al. Subtype differentiation of renal cell carcinoma using diffusion-weighted and blood oxygenation level-dependent MRI. AJR Am J Roentgenol 2014; 203(1): 78-84.
3. Zhang YD, Wu CJ, Wang Q, et al. Comparison of Utility of Histogram Apparent Diffusion Coefficient and R2* for Differentiation of Low-Grade From High-Grade Clear Cell Renal Cell Carcinoma. AJR Am J Roentgenol 2015; 205(2):W193-201.
Figures