0820
Using Cardiorenal MRI to assess fluid balance1Sir Peter Mansfield Imaging Centre, University of Nottingham, Nottingham, United Kingdom, 2NIHR Nottingham Digestive Diseases Biomedical Research Unit, University of Nottingham, Nottingham, United Kingdom
Synopsis
We used quantitative MRI measurements to perform a randomised, double-blind crossover study on the effects of isovolumetric and isoeffective infusions of colloid versus crystalloid on structural and haemodynamic (ASL, ADC, flow, volume) changes in the kidney and cardiac output. No significant differences were observed between the blood expanding properties of the infusions, despite using a colloid infusion one-third the volume of the reference crystalloid infusion. We observed a trend of less oedema using an isoeffective volume of colloid. Repeated MRI measurements demonstrated low CoVs, allowing MRI to assess subtle changes in structure and haemodynamics for determining optimal perioperative infusions.
Purpose
Infusions of crystalloids are routinely used perioperatively to expand blood volume and replace fluid losses. The use of colloids is in decline over safety concerns. However, the blood volume expanding properties of colloids are superior to crystalloids, and since a large volume of crystalloid infusion is required this can lead to interstitial oedema from sodium and water retention. Here, we build on previous quantitative MRI studies1,2 to assess the effects of colloid and crystalloid infusions on cardiac and renal function, including assessment of reproducibility of MRI measures.Methods
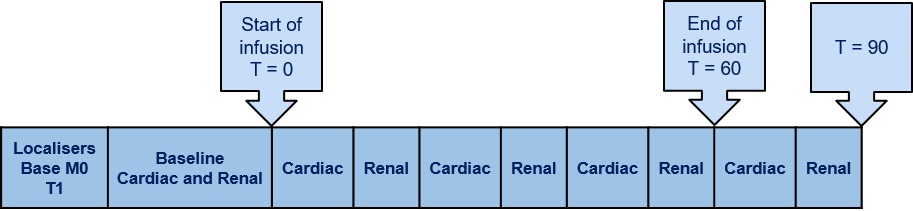
MRI measures were collected on a 3T Philips Achieva scanner (SENSE XLTorso coil). 10 healthy male participants (age 20-28 yrs) attended three study sessions (7 days apart) after an overnight fast. The MR protocol (Fig. 1) consisted of a series of non-invasive MR measurements to assess cardiac output (short axis (SA) cine and aortic outflow phase contrast3 MRI (PC-MRI)), renal tissue perfusion (using arterial spin labelling (ASL)4,5), renal artery blood flow (PC-MRI), diffusion weighted imaging (DWI), renal volume (bTFE localisers) and bladder volume (MRCP). Baseline measurements were acquired, and scans repeated at 20-min intervals during each 60-min infusion, and for 20-min post-infusion. Blood samples were taken at 0, 30, 60, 120, 180, and 240 minutes for haemoglobin, haematocrit, osmolality and electrolytes.
Infusion: Three treatments (BBraun, Germany) were infused in a double-blinded cross-over study: (A) Reference crystalloid (1.5L Sterofundin), (B) Iso-effective colloid (0.5L Gelaspan), (C) Iso-volumteric colloid/crystalloid (1L Sterofundin + 0.5L Gelaspan). Blood volume was calculated using Nadler's formula and interstitial fluid volume calculated by subtracting change in blood volume from weight change.
Cardiac Haemodynamics: Cardiac output (CO) was assessed using a VCG-gated multi-slice cine TFE sequence through the short-axis of the left ventricle (260x209mm2 FOV, 1.35x1.35x10mm3 voxel, SENSE 2, TR/TE 4/2ms, FA 60o, 30 phases, 6 breath holds). Phase contrast (PC)-MRI was used to assess aortic outflow and CO, with an imaging slice placed perpendicular to the aorta (TR/TE 3.8/2.4ms, FA 15o, NSA 3, reconstructed resolution 1.05x1.05x10mm3,VENC 200cm/s, 1 minute whilst free breathing). Analysis was performed using ViewForum software (Philips), and CO indexed to body surface area to calculate cardiac index (CI).
Renal Structure and Haemodynamics: A coronal bTFE scan was used to estimate kidney volume (Analyze9). PC-MRI was used to assess left renal artery (RA) flow (TR/TE 7.5/3.4 ms, FA 25o, 15 phases, NSA 2, 1.17x1.17x6 mm3, VENC 100cm/s, ~15s breath hold). Global perfusion of the left kidney was calculated by correcting RA flow by kidney volume. Renal cortex perfusion was assessed using respiratory-triggered ASL (288x300mm2 FOV, 3x3x8mm3 voxel, post-label delay 1100ms) with a bFFE readout (TR/TE 4.1/2.1ms, SENSE 2, FA 60o). A base equilibrium M0 scan and T1 map were acquired for perfusion quantification. DWI data was acquired to form apparent diffusion coefficient (ADC) maps (SE-EPI, b-values 0, 5, 20, 60, 120, 190, 270, 370, 470, 580, 700 s/mm2).
Statistical Analysis: For each subject, baseline data was assessed for between-session reproducibility from the coefficient of variation (CoV), with mean CoVs across subjects calculated. Data sets were normalised to the baseline values to assess the time-course of change across treatments, and two-way repeated measures ANOVA assessed the effect of treatment and time.
Results
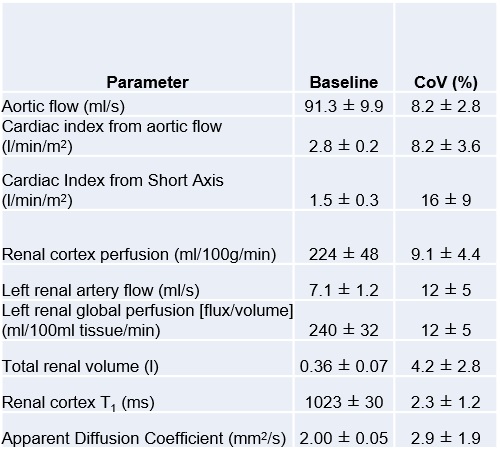
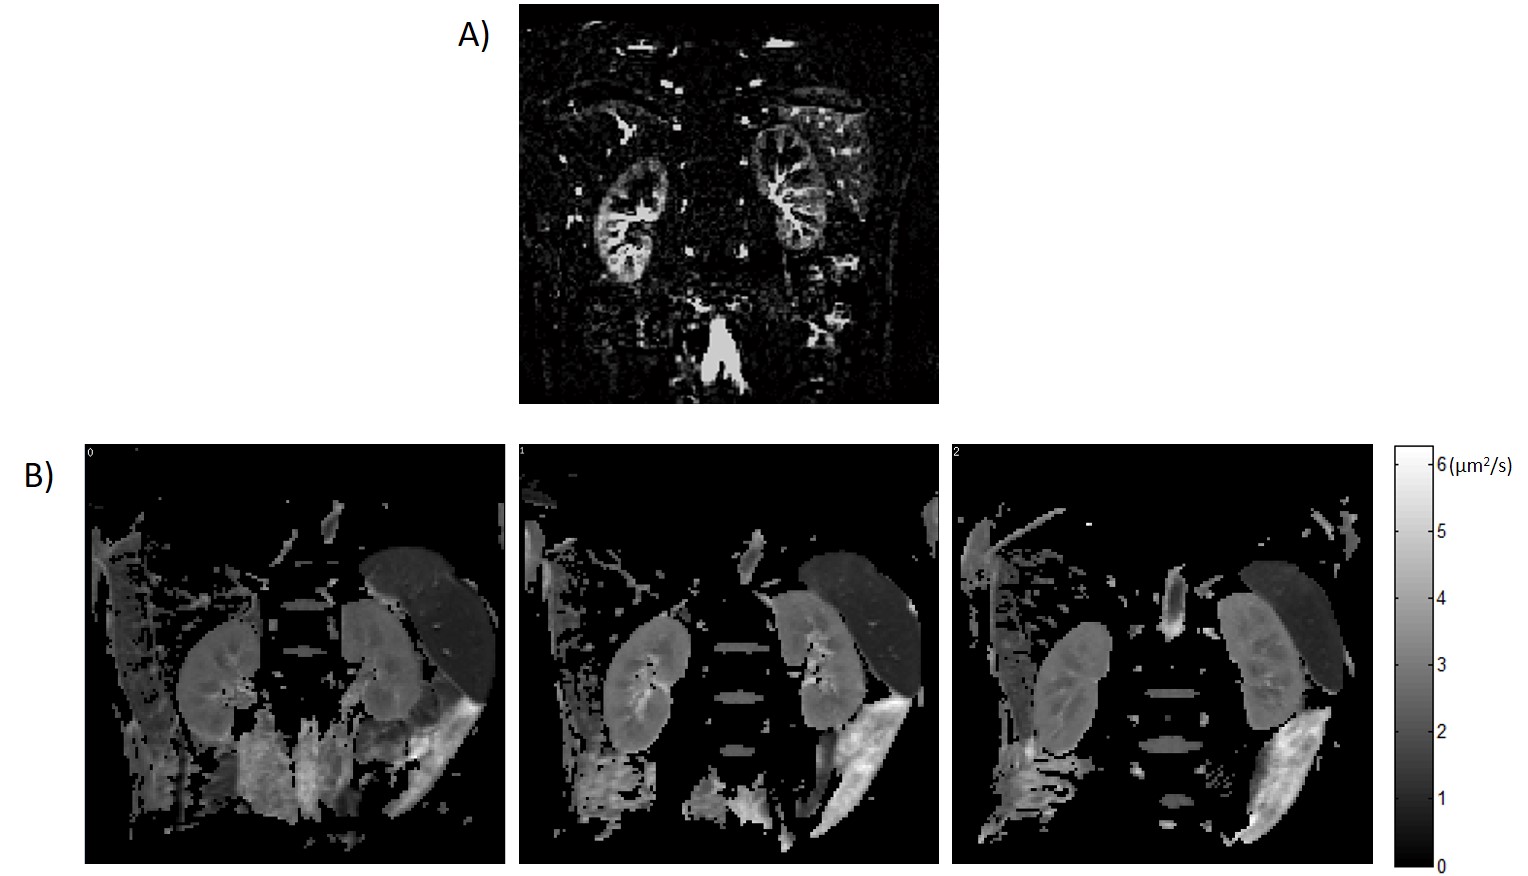
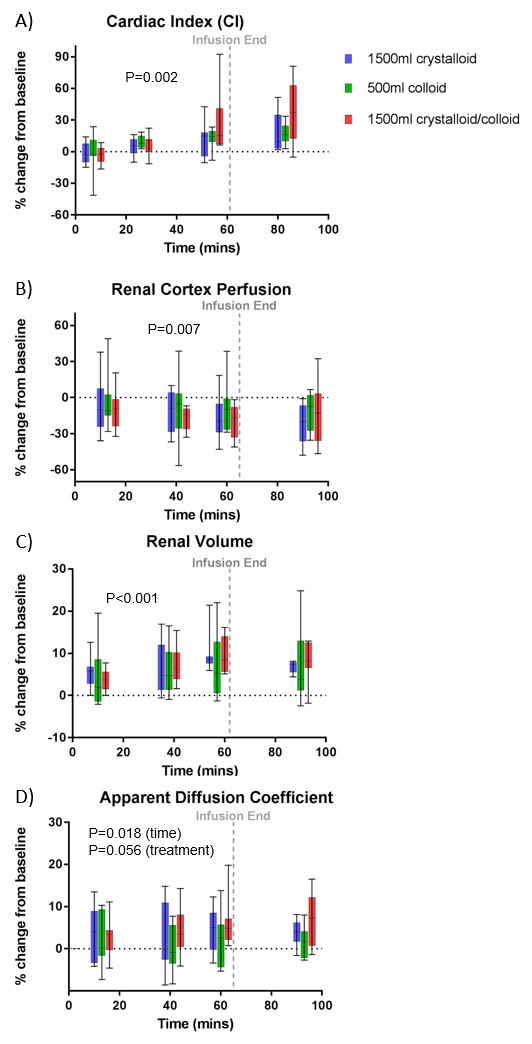
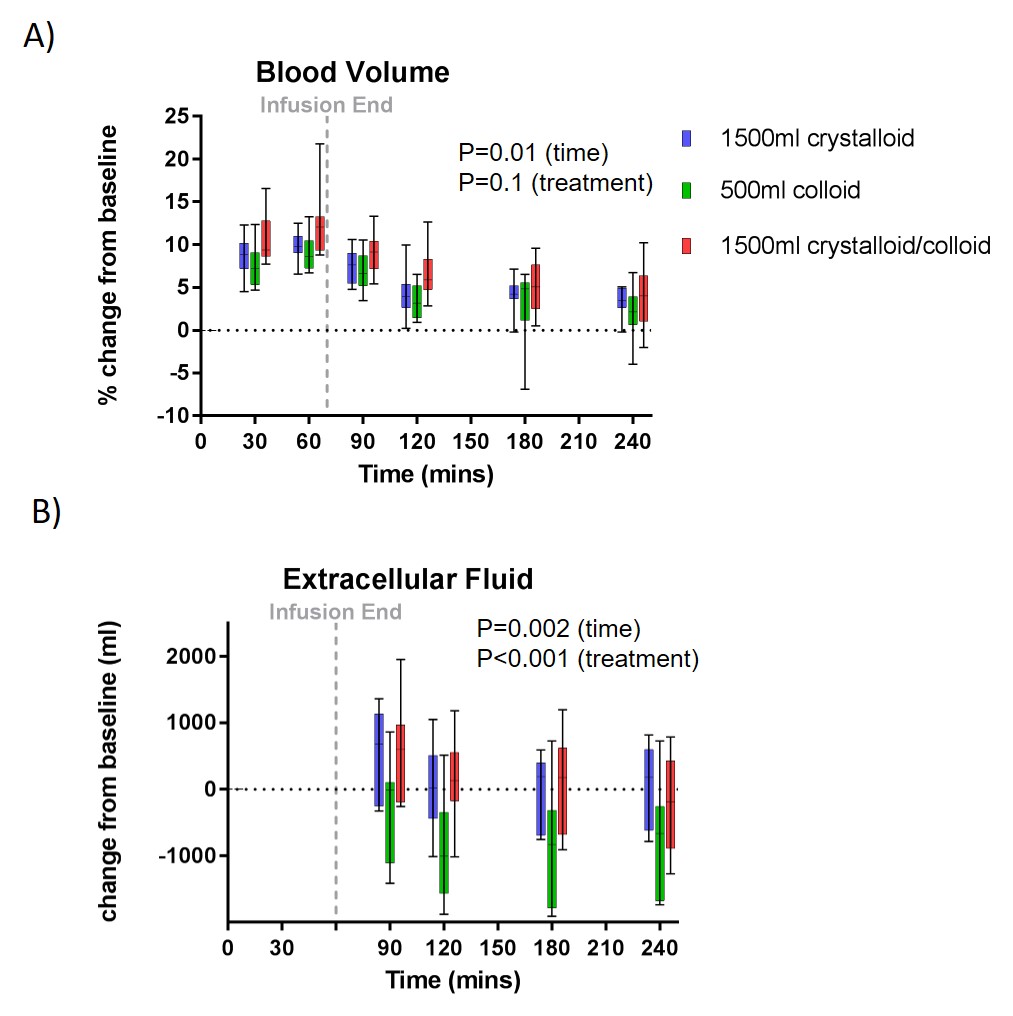
Figure 2 shows baseline MR measurements and associated CoVs across the three visits. The CI CoV from PC-MRI (8±3%) was lower than from SA cine measures (16±9%), whilst the CoV for global perfusion was higher compared to cortex perfusion assessed by ASL (Fig.3A) (12±5% vs. 9±4%). CI (PC-MRI) increased during each infusion (Fig. 4A) with a slight reduction in renal cortex perfusion (Fig.4B). Figure 4C shows an increase in total renal volume, with no difference between infusions. Figure 4D shows a significant change from baseline in ADC (Fig.3B) with a suggestion of increased ADC for the crystalloid compared to colloid infusions. Figure 5 shows there was no difference between the blood expanding properties of the three infusions (P=0.1), however there was a significantly greater accumulation of fluid in the interstitial space in the 1.5L crystalloid arm when compared with the 0.5L colloid arm (P<0.001).Discussion
MRI provides sensitive and quantitative measures to observe dynamic changes in cardiac and renal function in response to intravenous infusions. A smaller volume of colloid is as effective as a larger volume of crystalloid at expanding the blood volume whilst increasing cardiac output no more than the crystalloid infusion. There is significantly less oedema associated with an iso-effective volume of colloid, supported by an increase in ADC for crystalloids, likely due to increased water content in the extracellular space.Acknowledgements
This work was funded by a research grant from B. Braun, Melsungen.References
1. Chowdhury, Abeed H., et al. "A randomized, controlled, double-blind crossover study on the effects of 2-L infusions of 0.9% saline and plasma-lyte® 148 on renal blood flow velocity and renal cortical tissue perfusion in healthy volunteers." Annals of Surgery 256.1 (2012): 18-24.
2. Chowdhury, Abeed H., et al. "A randomized, controlled, double-blind crossover study on the effects of 1-L infusions of 6% hydroxyethyl starch suspended in 0.9% saline (Voluven) and a balanced solution (Plasma Volume Redibag) on blood volume, renal blood flow velocity, and renal cortical tissue perfusion in healthy volunteers." Annals of Surgery 259.5 (2014): 881-887.
3. Debatin, Jorg F., et al. "Renal artery blood flow: quantitation with phase-contrast MR imaging with and without breath holding." Radiology 190.2 (1994): 371-378.
4. Martirosian, Petros, et al. "Magnetic resonance perfusion imaging without contrast media." European Journal of Nuclear Medicine and Molecular Imaging 37.1 (2010): 52-64.
5. Gardener, A. G., P. A. Gowland, and S. T. Francis. "Implementation of quantitative perfusion imaging using pulsed arterial spin labeling at ultra-high field." Magnetic Resonance in Medicine 61.4 (2009): 874-882.
Figures