0819
In vivo multifrequency MR elastography for the assessment of renal stiffness in patients with IgA nephropathy1Department of Radiology, Charité - Universitätsmedizin Berlin, Berlin, Germany, 2Department of Nephrology, Charité - Universitätsmedizin Berlin, Berlin, Germany, 3Department of Medical Informatics, Charité - Universitätsmedizin Berlin, Berlin, Germany
Synopsis
Renal stiffness was investigated using multifrequency MRE in healthy controls and patients with IgA nephropathy. Patients show a reduced renal stiffness as compared to healthy controls. DWI and BOLD imaging were also applied to the subjects. Both ADC and T2* were linearly correlated with wave speed obtained from MRE. By mechanical vascular-solid tissue interactions, wave speed measurements by multifrequency MRE offer a quantitative measure for the noninvasive assessment renal function.
Purpose
To investigate renal stiffness in patients with igA nephropathy using multi-frequency MRE and to correlate renal stiffness with other imaging parameters such as apparent diffusion coefficient (ADC) and T2*.Background
Immunoglobulin A (IgA) nephropathy is one of the most common kidney diseases. The buildup of IgA in the kidneys results in local inflammation which, over time, can lead to end-stage kidney disease. Renal biopsy is the only diagnostic method to confirm IgA nephropathy, however, it is not suited for monitoring disease progression longitudinally due to its invasiveness.Methods
Six patients (age range 24-65 years, 1 females) with IgA nephropathy and eight matched healthy controls in the similar age range (25-54 years, 7 females) were enrolled in the study. In vivo multifrequency MR elastography (MRE) (1), diffusion weighted imaging (DWI) and blood oxygenation-level dependent (BOLD) imaging were performed in each subject. All experiments were conducted on a 1.5-T MRI scanner equipped with a 12-channel phased array surface coil. The renal MRE setup is the same as described in (2) with two pressure pads placed underneath the body in the vicinity of the native kidneys. Renal MRE was performed at 40, 50, 60 and 70 Hz mechanical vibration. Imaging parameters were the same as described in (2). DWI and BOLD imaging were performed with a spin echo-echo planar imaging (SE-EPI) sequence and multiple gradient-recalled-echo (mGRE) sequence, respectively. For DWI, 11 slices with 2.7×2.7×5 mm3 resolution were recorded with 2 averages and b values of 0 and 500 s/mm2 in 17 seconds. For BOLD MRI, 3 slices with 2.8×2.8×5 mm3 resolution were recorded with 8 echo times (2.38-37.72 ms) in 20 seconds. All imaging protocols were executed in a coronal slice orientation covering both kidneys. MRE was performed under free-breathing while DWI and BOLD images were acquired during breath holds. MRE data post-processing was based on the tomoelastography pipeline detailed in (3), yielding stiffness maps in terms of wave speed (in m/s). ADC maps and T2* maps were generated by proprietary software installed at the scanner workstation. Selection of the regions of interest (ROI) and parameter averaging were done under MATLAB. Imaging parameters of both left and right kidneys were evaluated separately. ROIs were placed inside the nonhilar renal parenchyma.Results
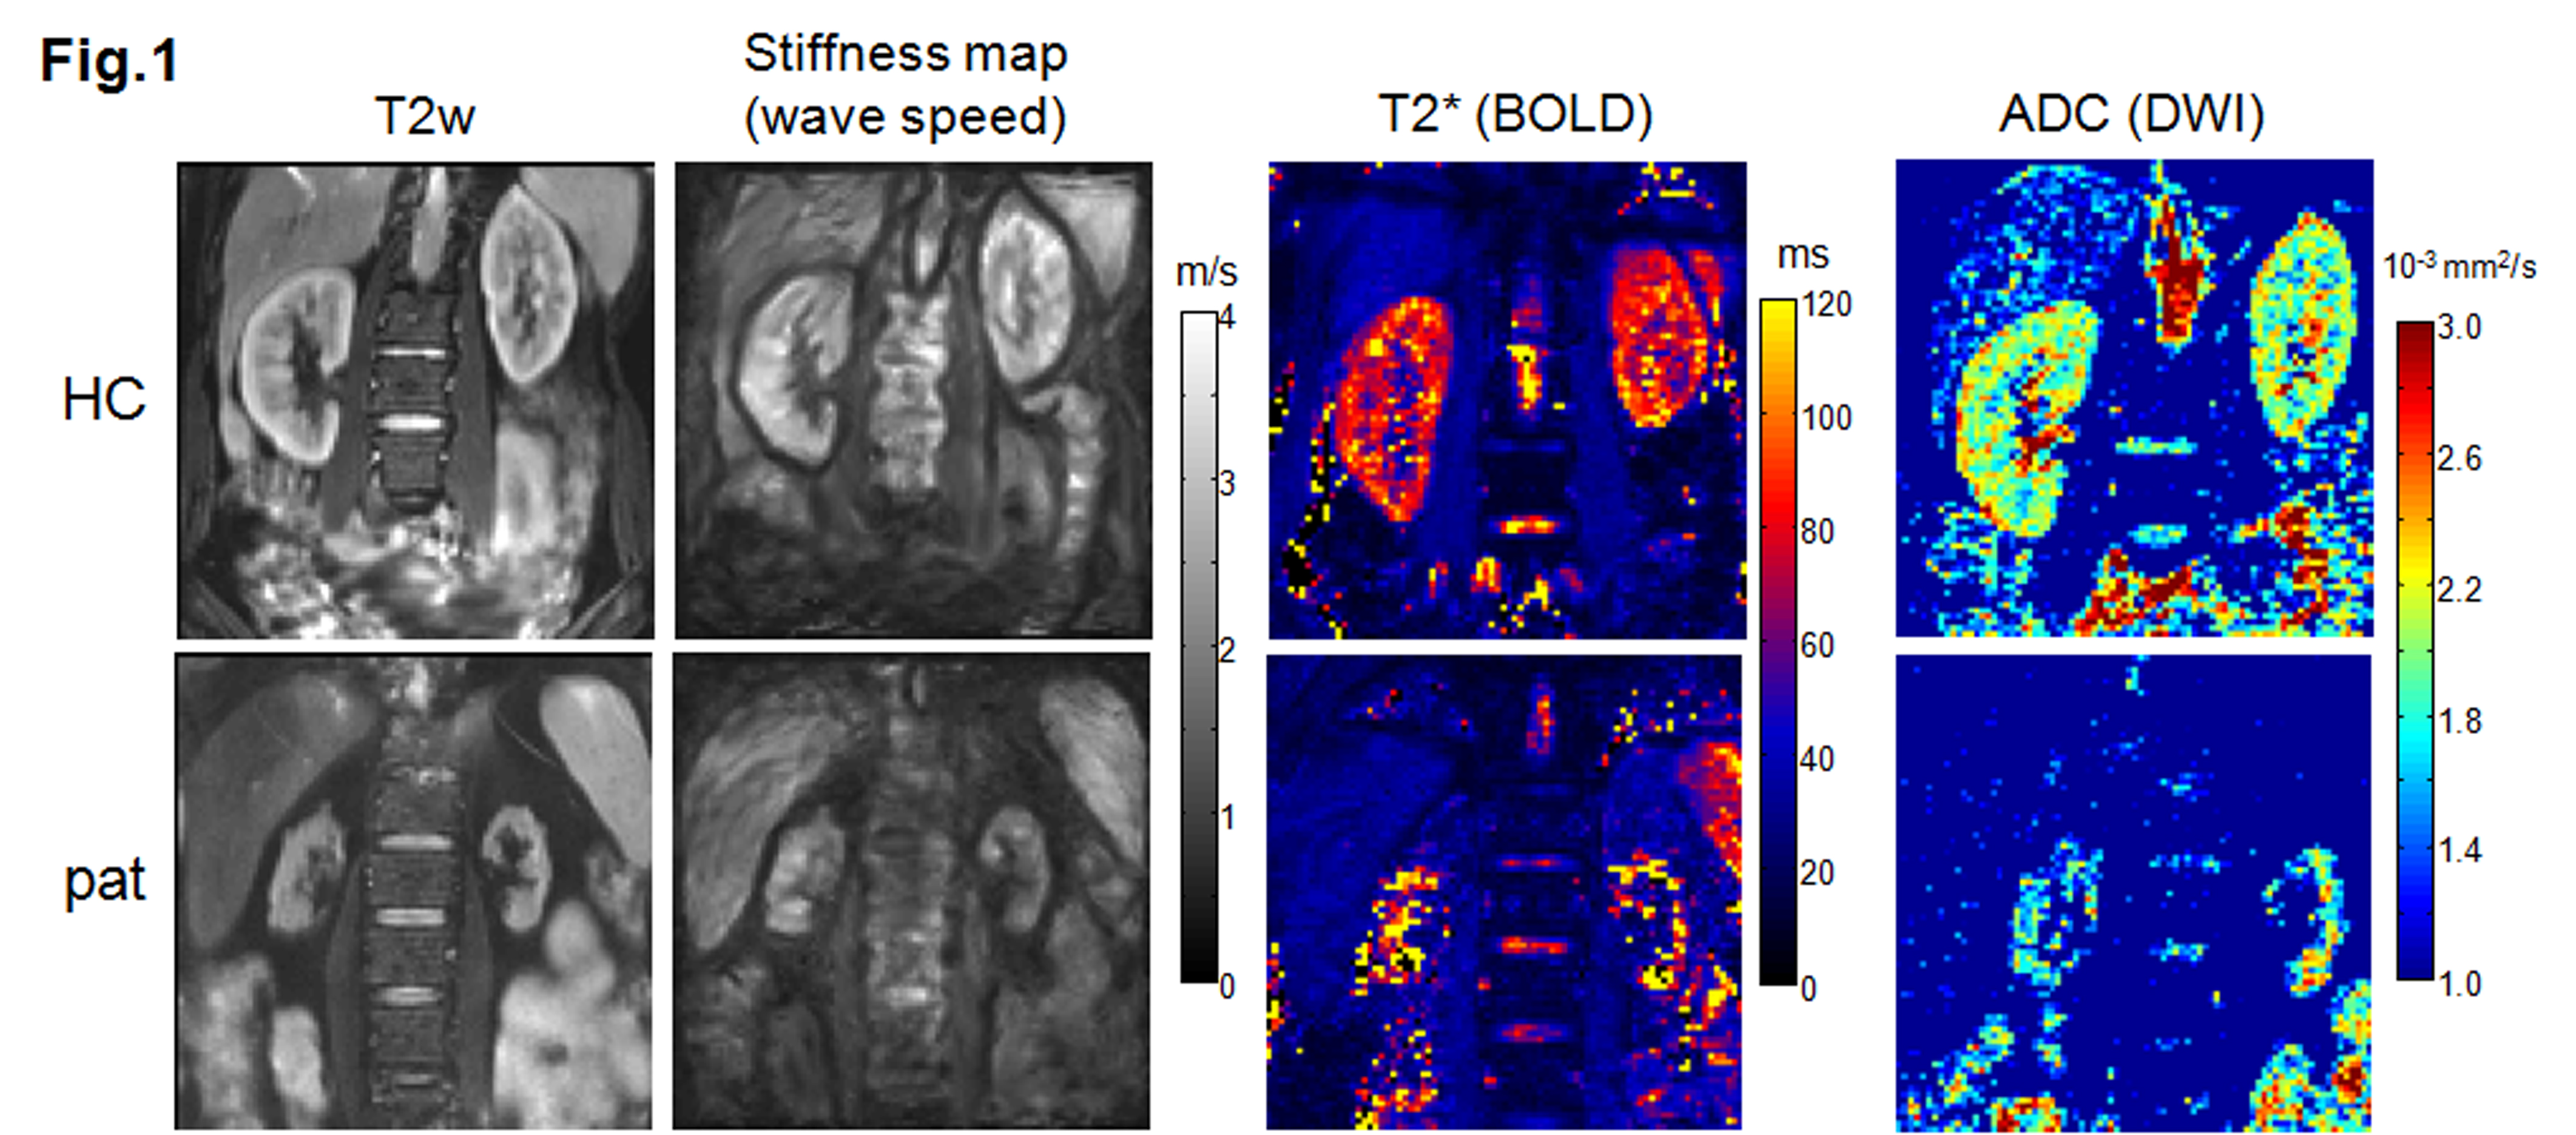
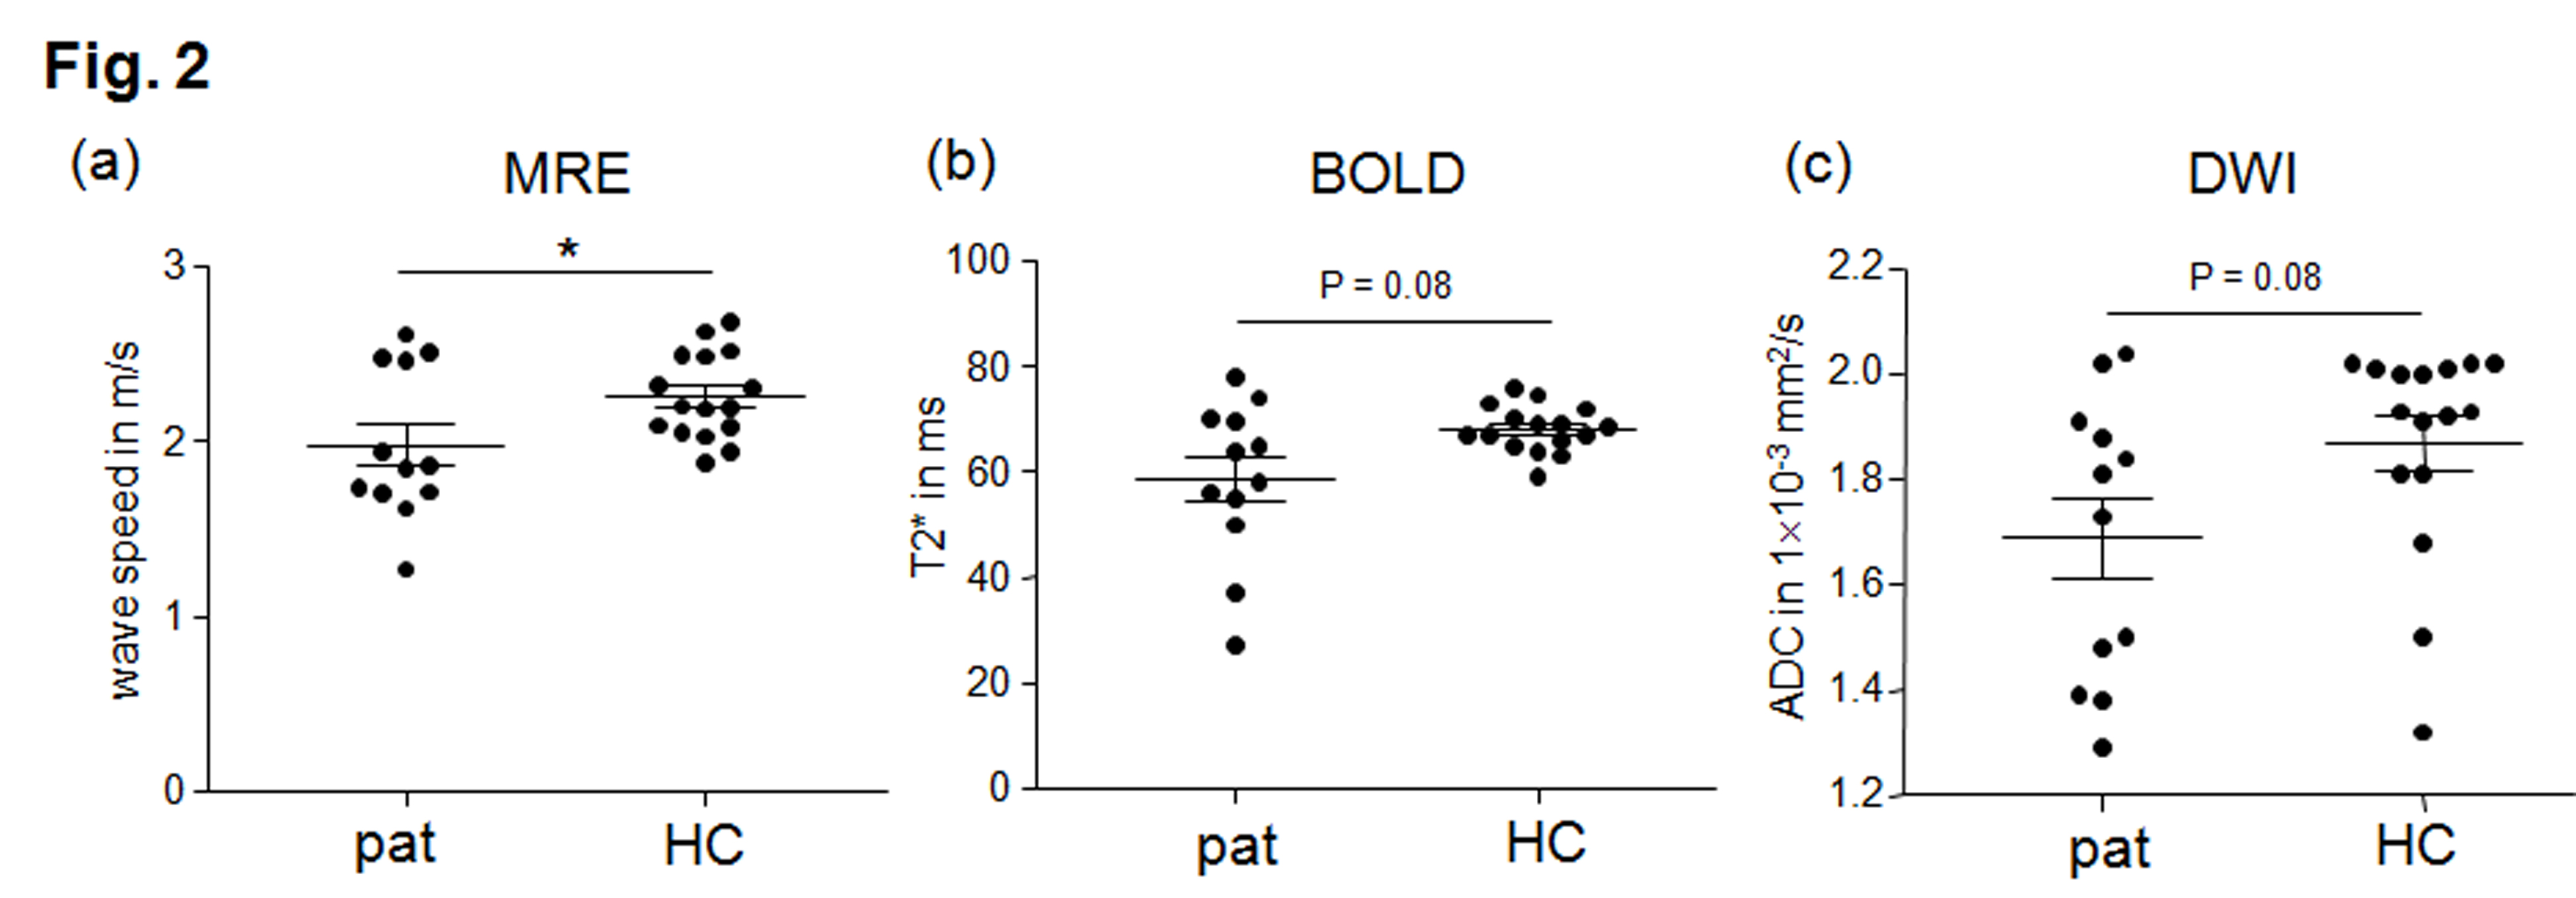
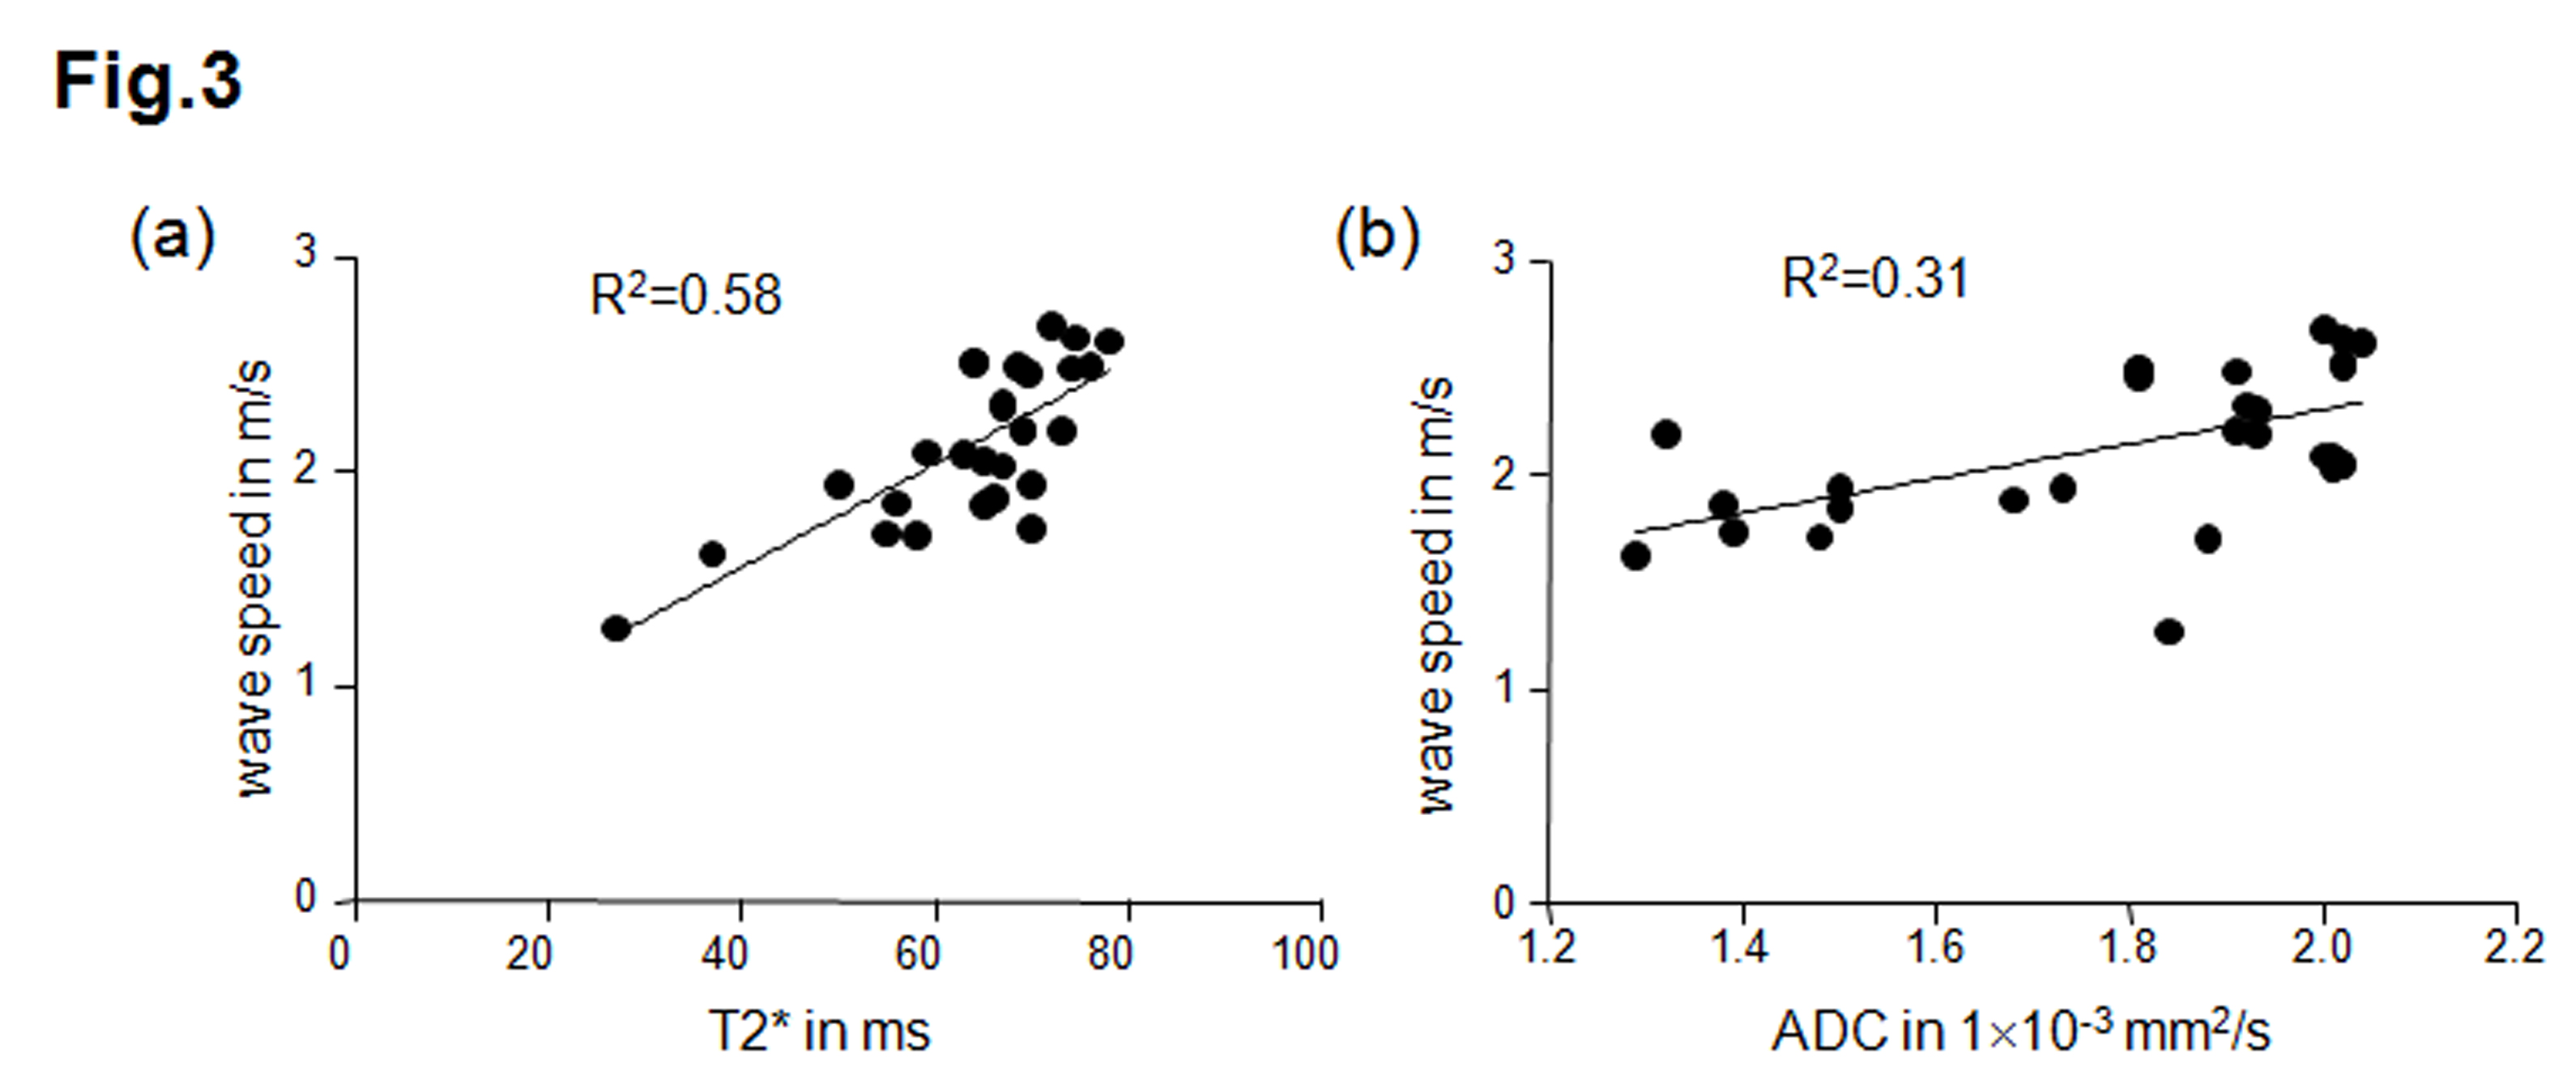
Fig.1 shows the MRE magnitude image (T2w), stiffness map (wave speed), T2* map and ADC map of one healthy volunteer and one patient. In the stiffness map, the atrophic kidneys in the patient are apparently softer than the kidneys of the healthy volunteer. As no significant difference between left and right kidneys were obtained for all imaging parameters, data from both kidneys are pooled for further group analysis. Group mean values of wave speed obtained from MRE are significantly lower in patients than in healthy volunteers (pat: 1.98 ± 0.43 m/s vs. HC: 2.26 ± 0.24 m/s, P = 0.03). No significant differences were obtained for ADC (pat: 1.69 ± 0.27 10-3 mm2/s vs. HC: 1.87 ± 0.20 10-3 mm2/s, P = 0.08) and T2* (pat: 59 ± 15 ms vs. HC: 68 ± 4 ms, P = 0.08) between patients and healthy volunteers, as shown in the scatter plots in Fig.2. We also observed linear correlations between wave speed, ADC and T2* combing both data from healthy controls and patients. A moderate correlation was found between wave speed and ADC (Pearson r = 0.55, P = 0.002), while wave speed was highly correlated with T2* (Pearson r = 0.76, P<0.0001). No correlation was observed between ADC and T2*. Results of the linear regression tests are shown in Fig. 3.Discussion
In this preliminary study, we applied a multi-parametric imaging protocol to patients with IgA nephropathy and healthy controls. Wave speed, ADC and T2* obtained for healthy controls are consistent with previous reports based on similar imaging parameters (4, 5). We observed a significant softening of kidney in patients with IgA nephropathy by a reduction of wave speed. This observation agrees with a previous MRE study on patients with chronic kidney disease (4). Although the etiology addressed in our current study differs from (4), renal function in IgA patients are also severely compromised as indicated by a loss of corticomedullary differentiation and tubular atrophy. Despite the fact that T2* and ADC could not distinguish patients from healthy controls, both parameters correlated positively with renal stiffness. As T2* is closely related to blood flow and pO2 level, while ADC is sensitive to the effects of capillary perfusion and water diffusion, the correlations supported early findings that renal hemodynamics such as perfusion and diffusion influence renal stiffness (4). More patients will be recruited in this ongoing study and the regional analysis we will be refined towards the separation of cortex and medulla. Furthermore, imaging parameters will be correlated with clinical findings.Conclusion
Patients with IgA nephropathy show a reduced renal stiffness as compared to healthy controls. Renal stiffness linearly correlates with both ADC and T2*. By mechanical vascular-solid tissue interactions, wave speed measurements by multifrequency MRE offer a quantitative measure for the noninvasive assessment renal function.Acknowledgements
The author would like to thank the Deutsche Forschungsgemeinschaft (DFG) for their financial support (Funding Nr: GU 1726/1-1).References
1. Muthupillai R, Ehman RL. Magnetic resonance elastography. Nat Med. 1996;2(5):601-3.
2. Dittmann F, Tzschätzsch H, Hirsch S, et al. Tomoelastography of the abdomen: Tissue mechanical properties of the liver, spleen, kidney and pancreas from single MR elastography scans at different hydration states. Magn Reson Med. 2016;DOI 10.1002/mrm.26484.
3. Tzschatzsch H, Guo J, Dittmann F, et al. Tomoelastography by multifrequency wave number recovery from time-harmonic propagating shear waves. Med Image Anal. 2016;30:1-10.
4. Marticorena Garcia SR, Fischer T, Dürr M, et al. Multifrequency Magnetic Resonance Elastography for the Assessment of Renal Allograft Function. Invest Radiol. 2016;doi:10.1097/RLI.0000000000000271.
5. Rapacchi S, Smith RX, Wang Y, et al. Towards the identification of multi-parametric quantitative MRI biomarkers in lupus nephritis. Magn Reson Imaging. 2015;33(9):1066-74.
Figures