0815
Greater Relaxivity in Brain Regions Indicates Tissue Iron Deposition in Adolescence to Adulthood1Biosciences, SRI International, Menlo Park, CA, United States, 2Psychlogy, University of Pittsburgh, Pittsburgh, PA, United States, 3Center for the Neural Basis of Cognition, Pittsburgh, PA, United States, 4Western Psychiatric Institute and Clinic, University of Pittsburgh Medical Center, Pittsburgh, PA, United States, 5Psychiatry and Behavioral Sciences, Stanford University, Stanford, CA, United States
Synopsis
This study investigates non-heme iron deposition in the adolescent brain in specific iron-susceptible regions as a function of age, sex, body mass index, supratentorial brain volume, handedness, scanning site, and race. A large cohort of 531 healthy adolescents, ages 12 to 22 years, were scanned at five sites on GE and Siemens systems using standard DTI and fMRI pulse sequence. This study demonstrates that in bilateral pallidum, putamen, dentate nucleus, red nucleus, and substantia nigra, both T2 and T2* show age-related declines. These results suggest ferratin-encapsulated iron deposition in specific brain regions is associated with normal adolescent brain development.
Purpose
Both healthy, normal aging1 and Alzheimers disease2 are associated with deposition of non-heme iron in selective brain regions. MRI is imminently suitable for detection and quantification of brain iron deposition because of the sensitivity of MRI to iron3–8. Initial MRI investigations used direct measures of relaxivity (i.e., R2 and R2*) as primary indicators of iron3,4. More recent work has focused on methods including Field-Dependent Imaging9,10, Susceptibility Weighted Imaging (SWI)10, Quantitative Susceptibility Mapping (QSM)11,12, and R2’ mapping5,13. The current study investigated the ability of standard Diffusion Tensor Imaging (DTI) and functional MRI (fMRI) to track the course of non-heme iron deposition (ferritin5,6) in the brains of adolescents and young adults (ages 12-22). The sample includes cross-sectional data from 531 subjects collected across five sites participating in the National Consortium on Alcohol and NeuroDevelopment in Adolescence (NCANDA) study14 which necessitated data harmonization as a goal of the analysis. Because DTI and fMRI images are part of most standard acquisition protocols for clinical and research purposes, demonstration of their utility in measuring brain iron deposition would allow for evaluation of brain iron from existing datasets.Methods
Subjects
Subjects included 531 no/low alcohol consuming adolescents and young adults aged 12-22 (15.98±2.31) recruited via the NCANDA consortium14 conducted at five sites across the USA with full IRB approval.
Acquisition
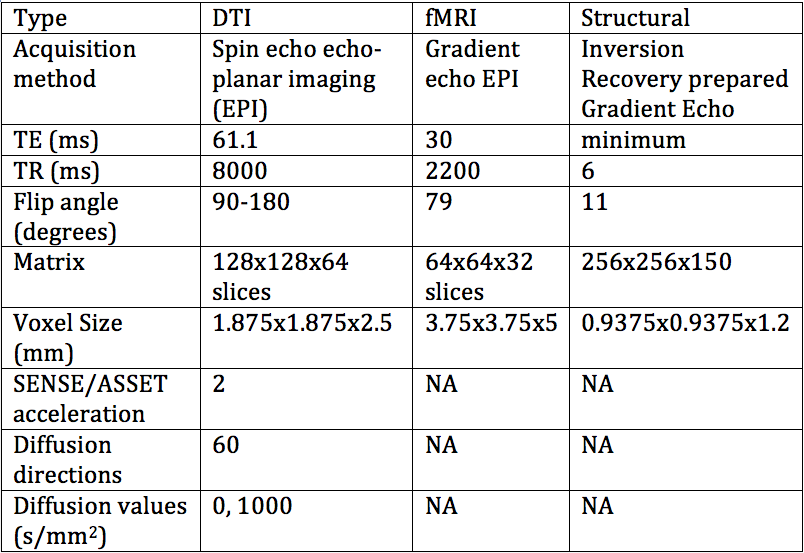
The protocol contained IR-SPGR, DTI, and fMRI scans (Table 1). All sites used the same protocol and 3T systems: three sites used GE MR750 and two used Siemens TIM-trio scanners.
Pre-Processing
All DTI (T2) and fMRI (T2*) scans were EPI-distortion corrected; DTI scans were additionally eddy-current corrected using FSL5 (Topup, Eddy)15,16. IR-SPGR scans were registered to the SRI2417 and cerebellar brain atlases18. All fMRI images and the b=1000 s/mm2 images were averaged across the time or diffusion series, and intensity normalized using the signal from the posterior corpus callosum3, then saved to an SQLite database19 by atlas region of interest (ROI) for fast region retrieval and processing. The final units of measure were posterior corpus callosum normalized intensity values approximating T2 and T2*. All demographic data were also saved to the database so targeted data could easily be extracted with database queries. Regional and voxel-wise processing was performed using Python 2.720 including age regression on a voxel-wise basis, which also generated data files for each region for further analysis in R21.
Analysis
Cases were included in the analysis only if all data fields were available and adolescents met criteria for no/low alcohol or drug consumption. The ROIs analyzed included the right and left pallidum, putamen, red nucleus, substantia nigra, and cerebellar dentate nucleus; structures which have previously been shown to be susceptible to iron deposition with age1,3, and initial analysis also indicated those regions had a significant age correlation. Separate regional linear regression analyses using normalized signal values were performed on the DTI and fMRI data. Independent variables considered were: age, sex, body mass index (BMI), supratentorial brain volume, handedness, scanning site, and race.
Results
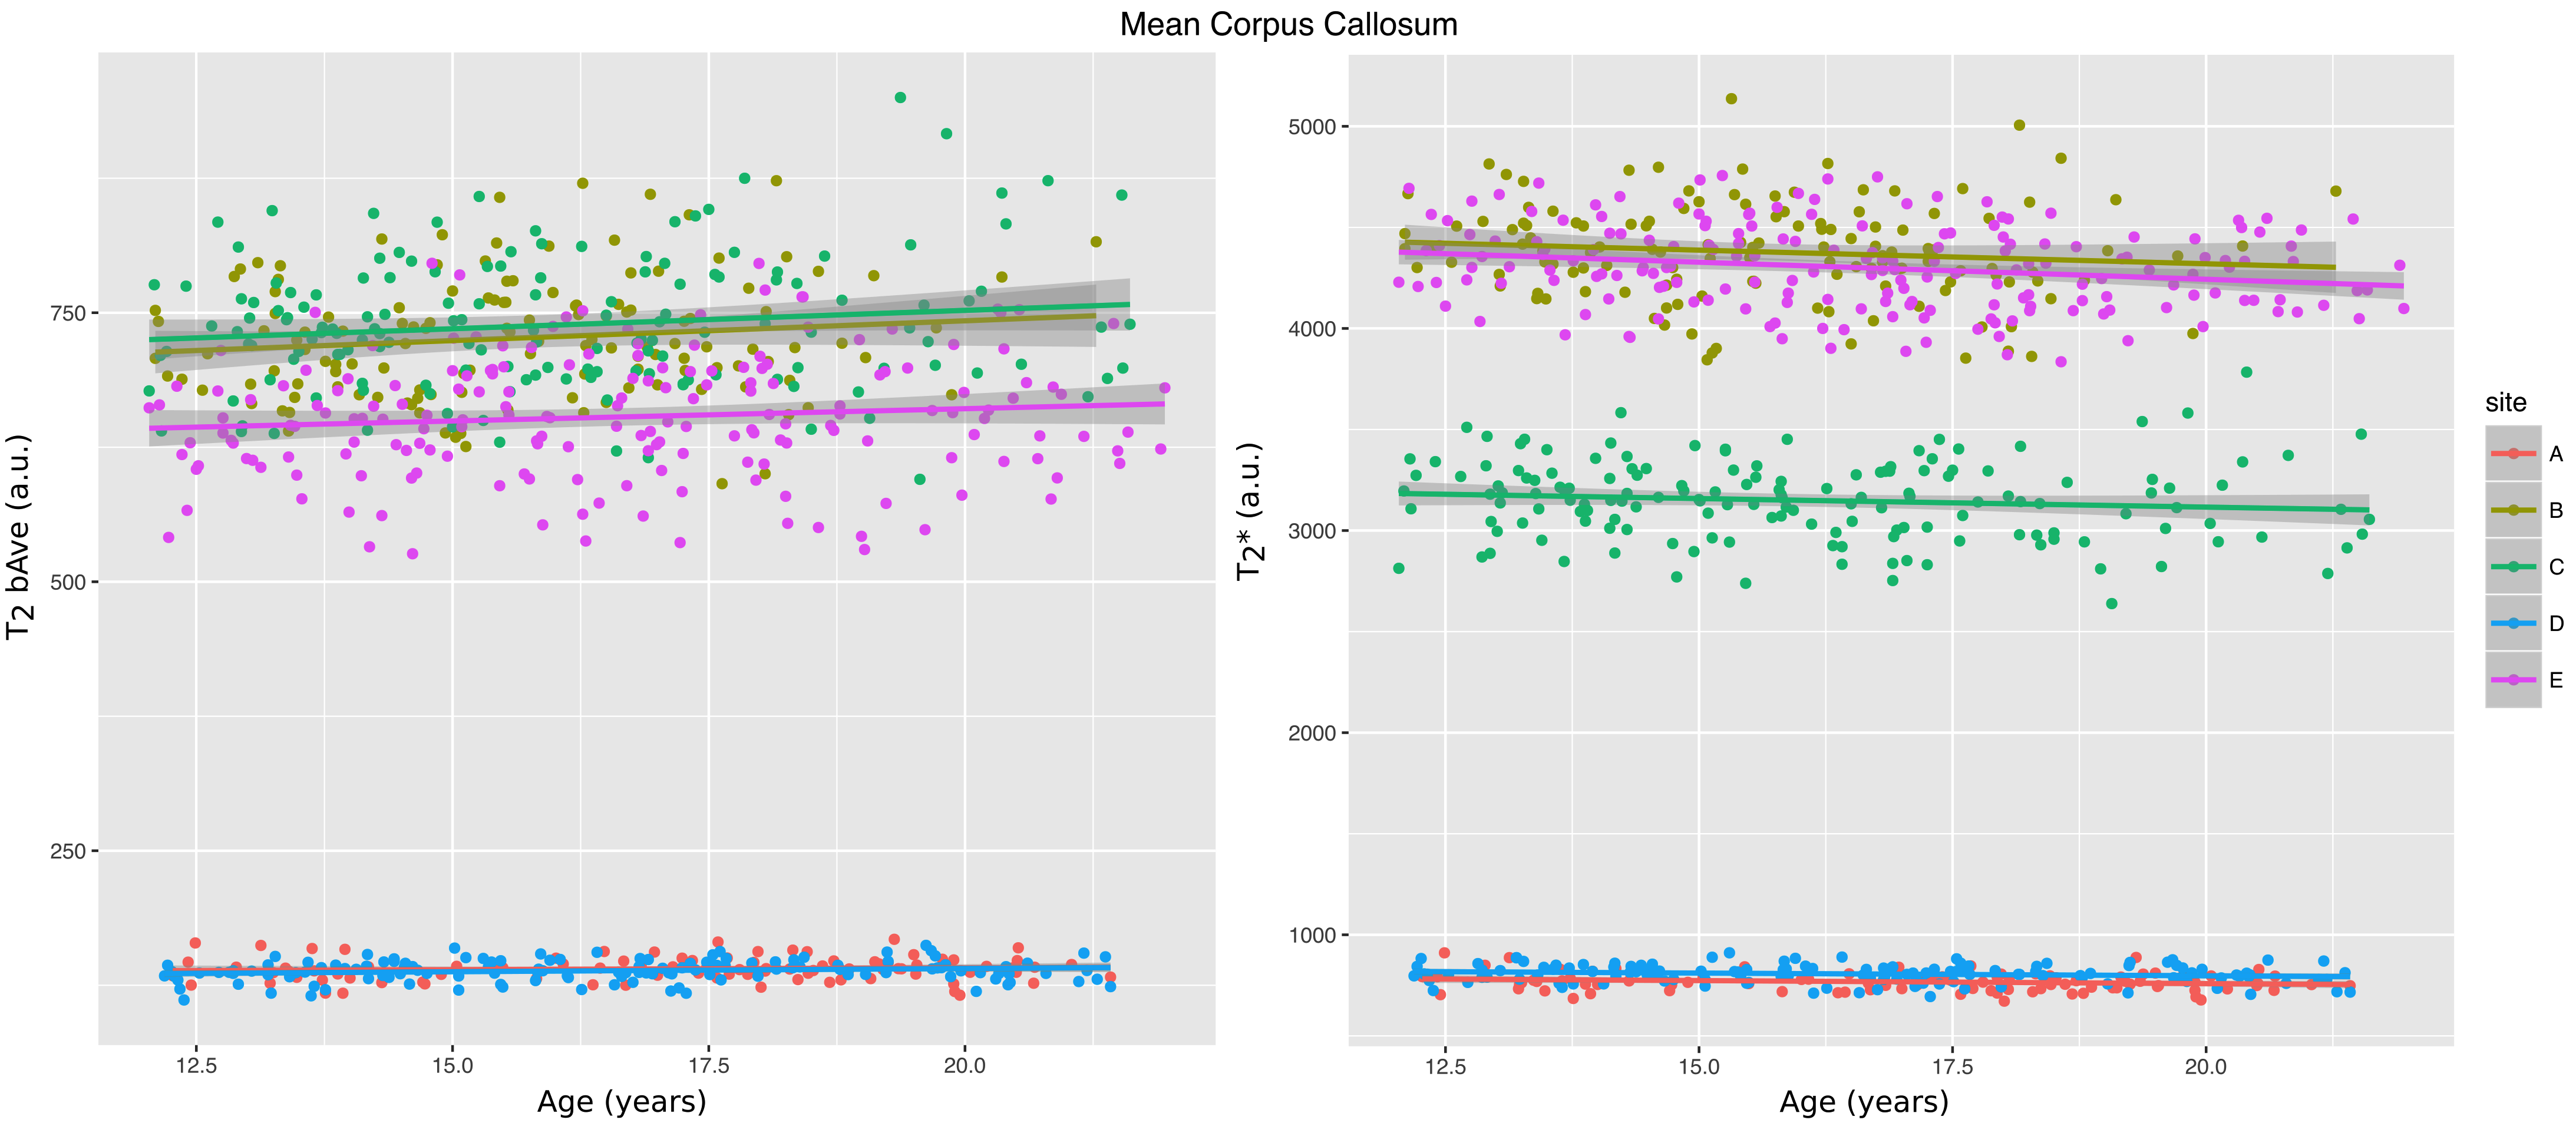
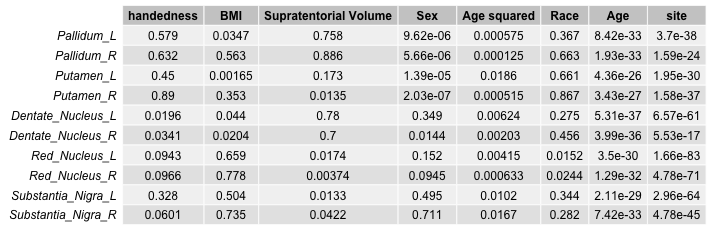
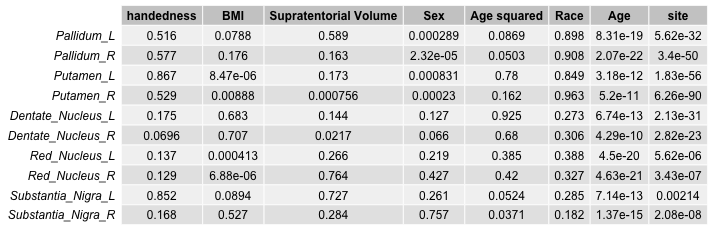
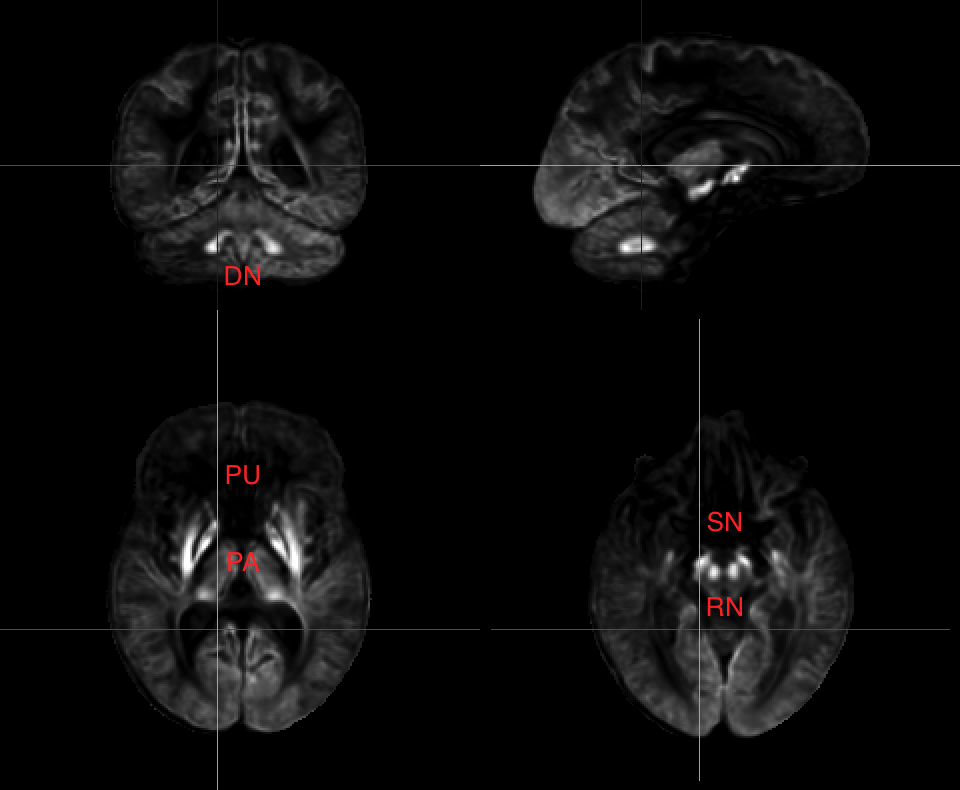
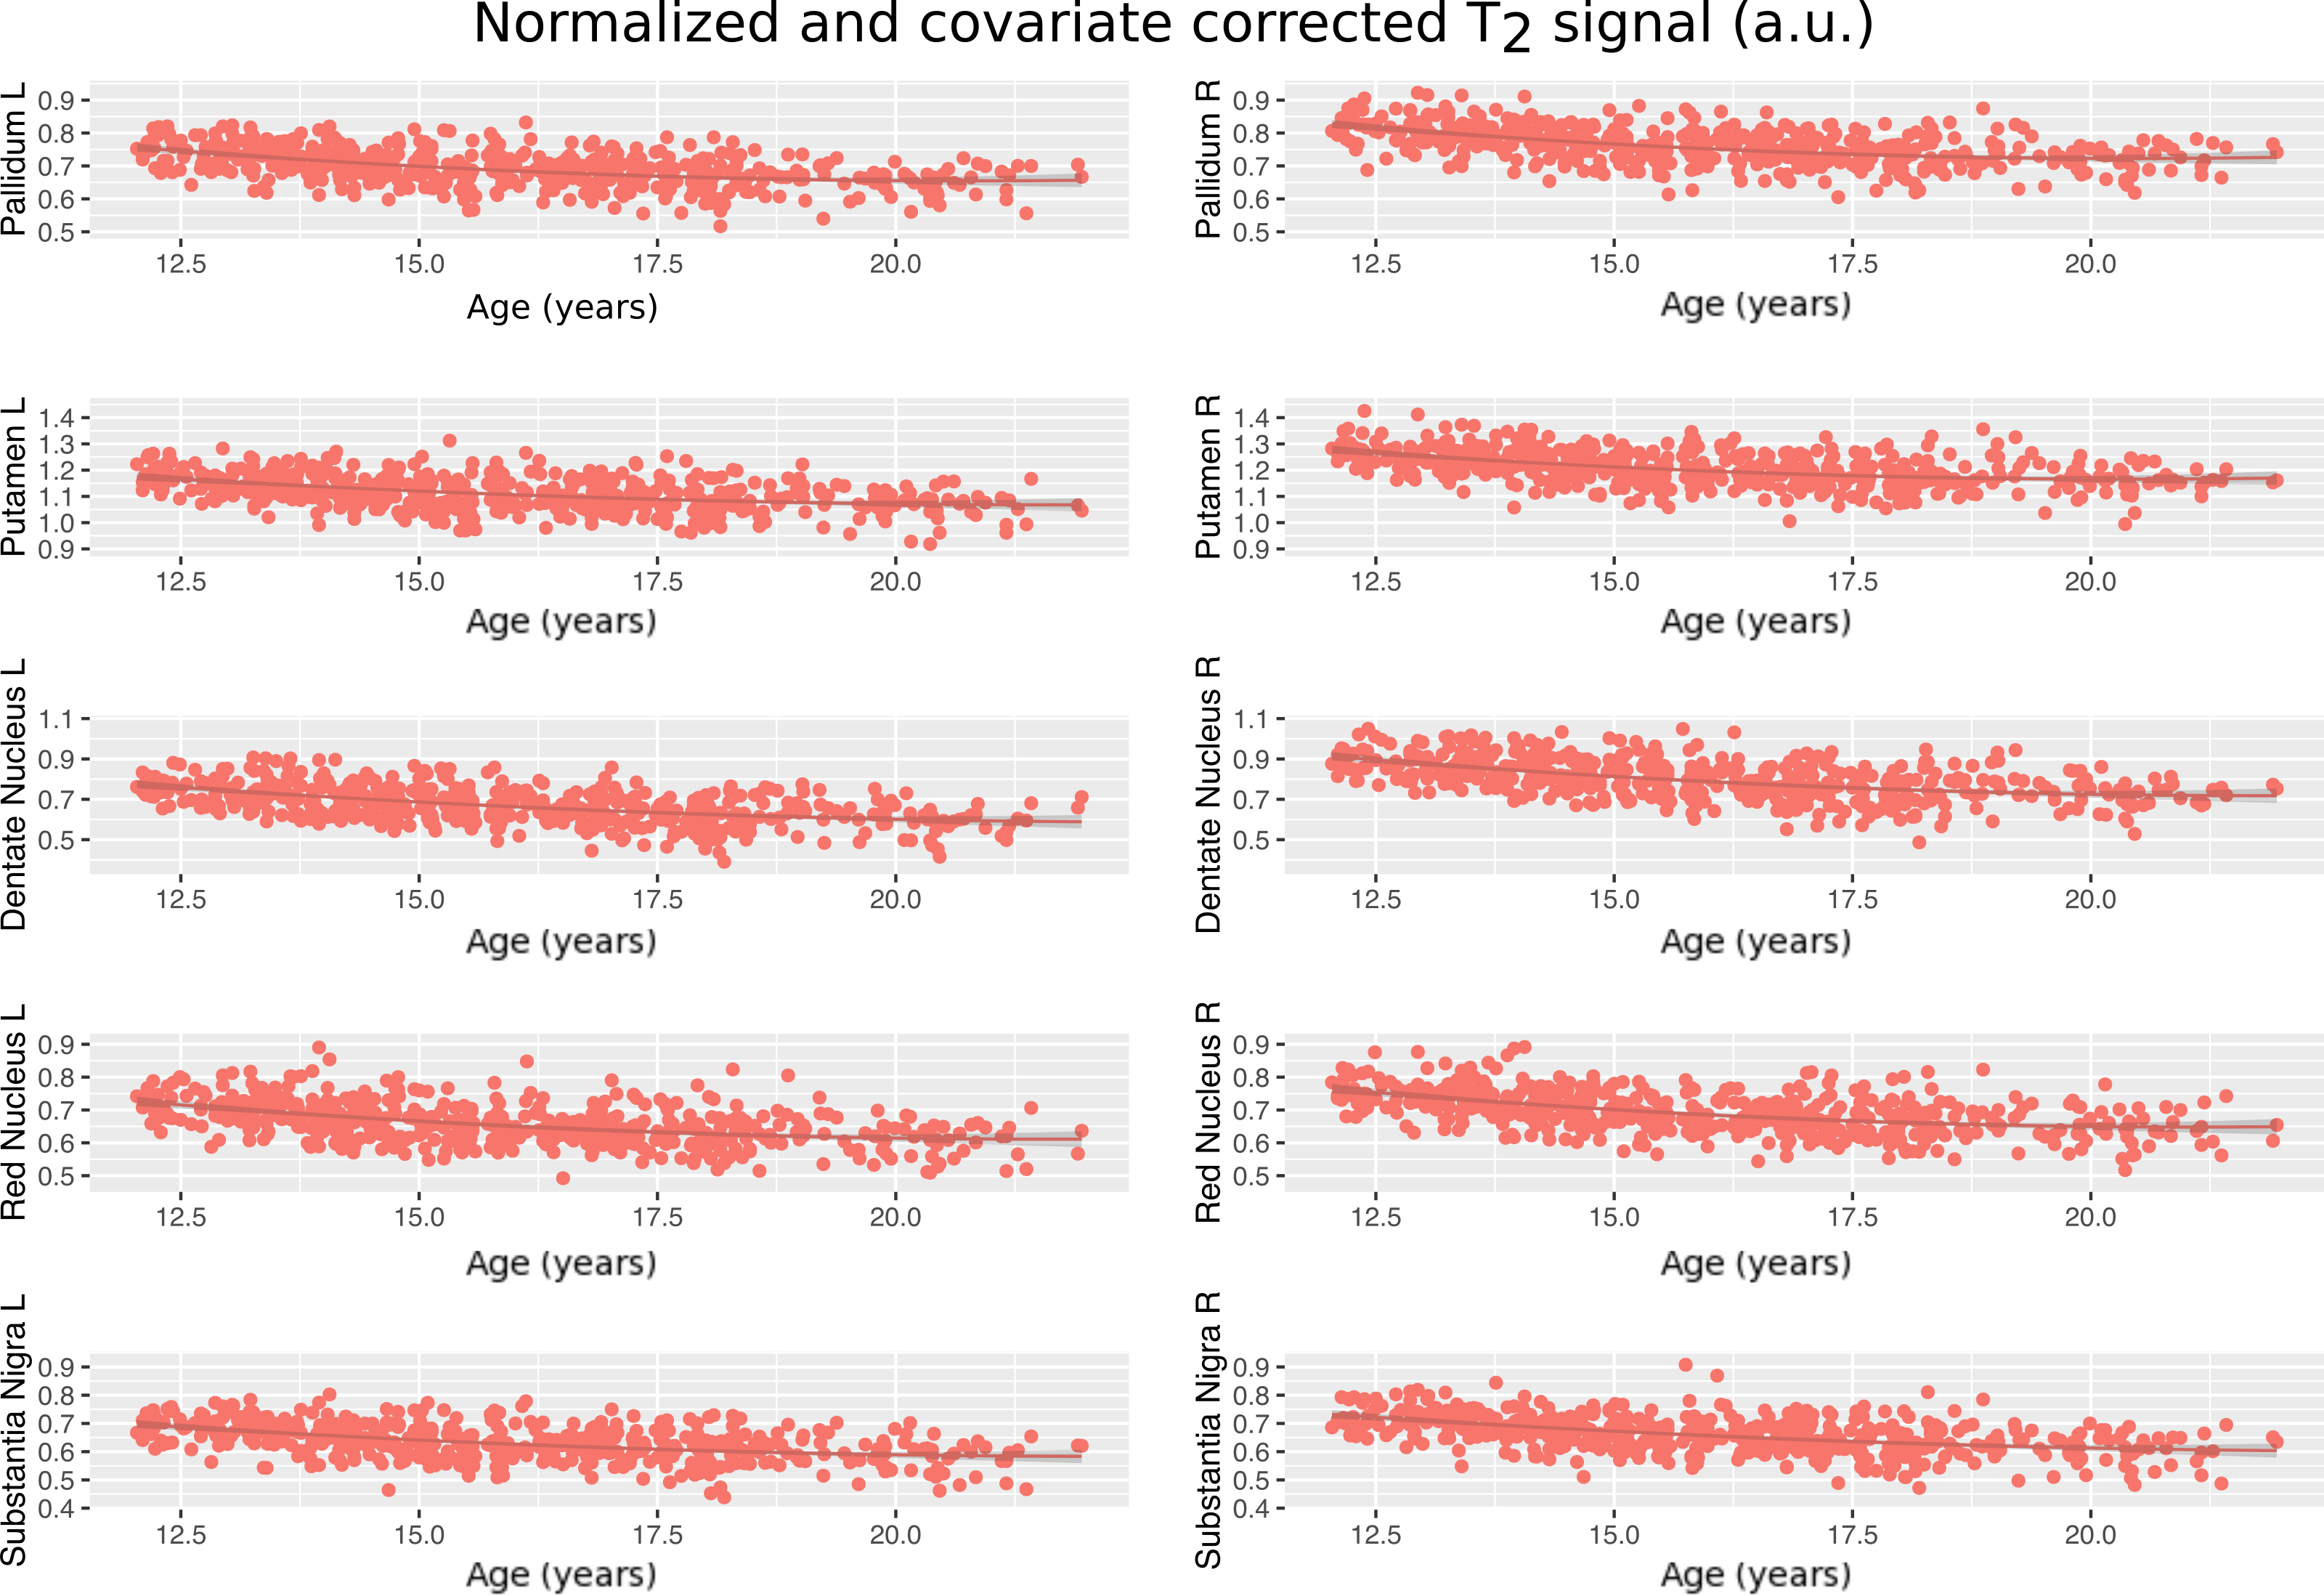
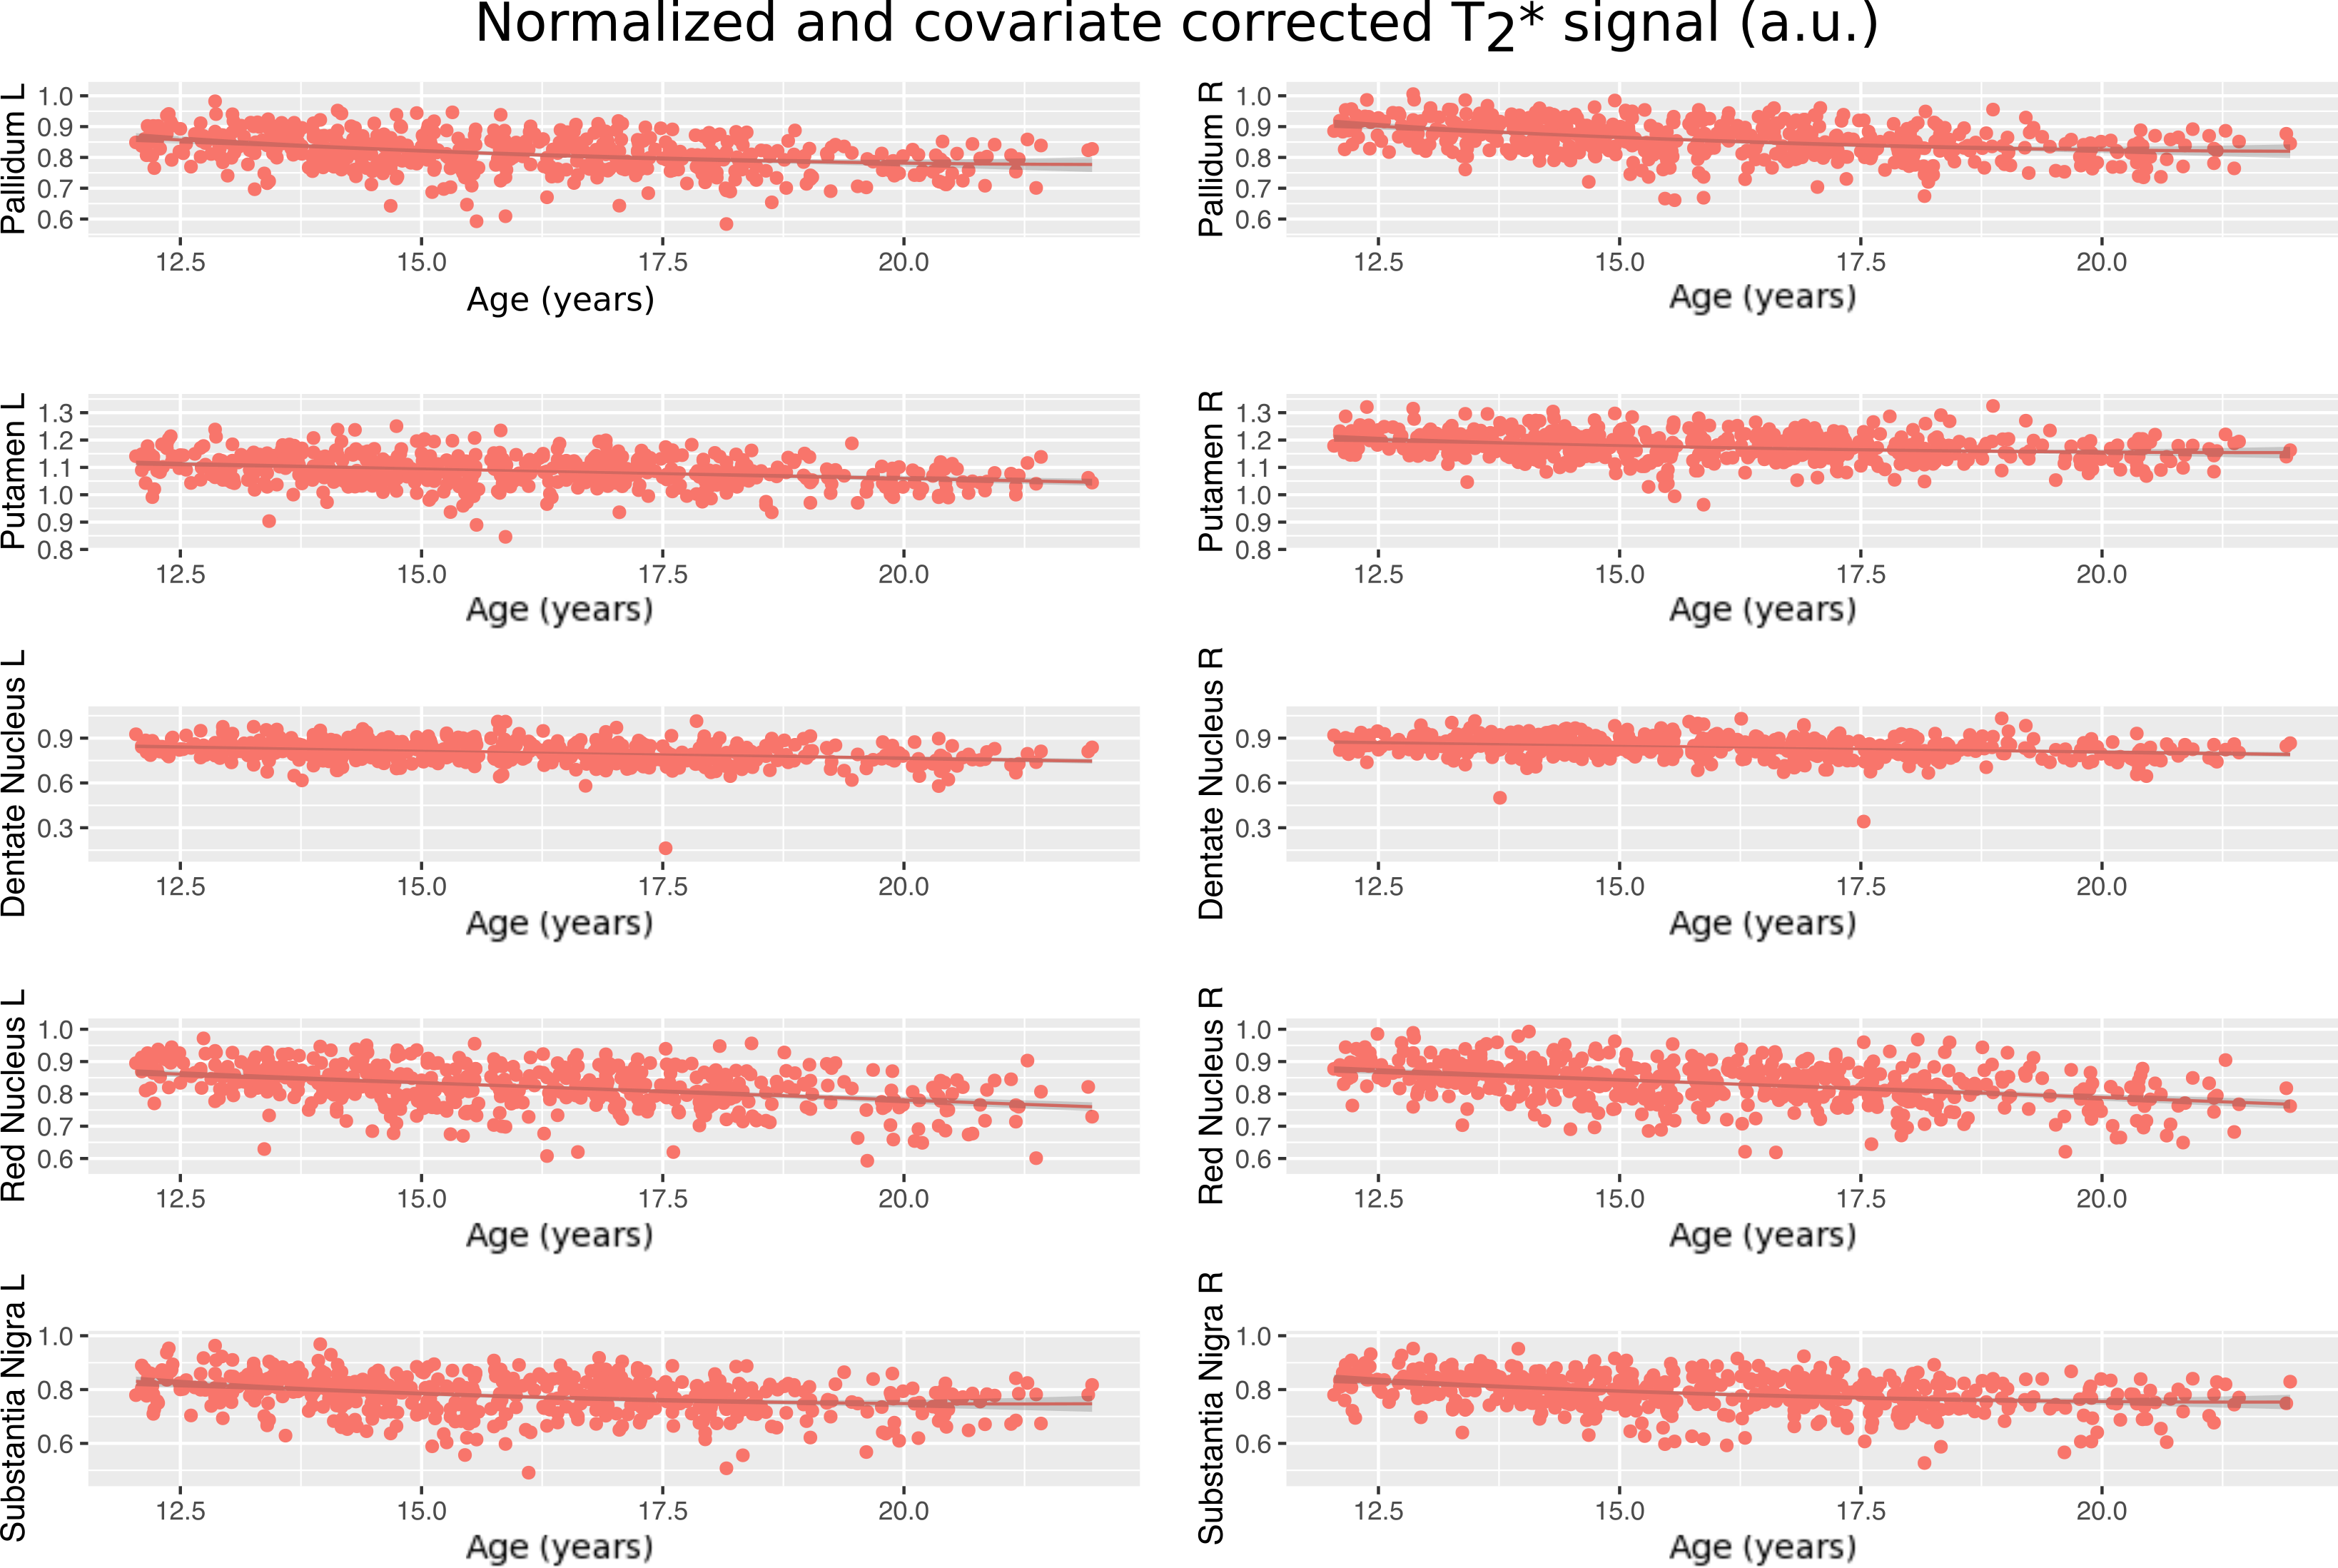
The posterior corpus callosum was used as an internal normalization because it was not significantly correlated with age (Figure 1). Voxel-wise age regressions showed expected age correlations for the evaluated ROIs (Figure 2). Regression analysis predicting the normalized T2 and T2* values revealed highly significant effects for age and site correlated with both T2 (Table 2) and T2* (Table 3) in all ROIs. Age-squared correlated with T2 in all ROIs. All other factors were of small effect and only significant in select ROIs. The T2 (Figure 3) and T2* (Figure 4) signal in all ROIs decreased with age indicating an increase in iron deposition, but including age-squared, the signal leveled out at older ages, indicating a slowing of iron deposition during development.Discussion
The significant age-related decay rate for both T2* and diffusion weighted T2 data in all ROIs indicate a linear, and often decelerating (age-squared) related relaxivity difference that corresponds well with regional iron deposition. Other variables considered including sex, body mass index, supratentorial brain volume, handedness, and race did not have a significant relation with iron deposition measured in the brain. This increase in iron deposition in specific brain regions identified in cross-sectional analysis corroborates previous results1,3 but in a larger, younger sample of subjects that is rarely studied22. The effects of the age- squared term corroborates the deceleration of iron deposition previously reported1.Conclusion
Although these methods cannot be used to directly quantify brain iron concentration, this study demonstrates that the region-specific effects of iron deposition can be observed using DTI and fMRI images.Acknowledgements
NIH grants: AA021697, AA021695, AA021692, AA021696, AA021681, AA021690, AA021691, K05 AA017168.References
1. Hallgren B, Sourander P. the Effect of Age on the Non-Haemin Iron in the Human Brain. J Neurochem. 1958;3(1):41-51. doi:10.1111/j.1471-4159.1958.tb12607.x.
2. Hallgren B, Sourander P. The non-haemin iron in the cerebral cortex in Alzheimer’s disease. J Neurochem. 1960;5:307-310. doi:10.1111/j.1471-4159.1960.tb13369.x.
3. Drayer B, Burger P, Darwin R, Riederer S, Herfkens R, Johnson GA. MRI of Brain Iron. Am J Roentgenol. 1986;(147):103-110.
4. Dhenain M, Michot JL, Volk A, Picq JL, Boller F. T2-weighted MRI studies of mouse lemurs: A primate model of brain aging. Neurobiol Aging. 1997;18(5):517-521. doi:10.1016/S0197-4580(97)00105-X.
5. Haacke EM, Cheng NYC, House MJ, et al. Imaging iron stores in the brain using magnetic resonance imaging. Magn Reson Imaging. 2005;23(1):1-25. doi:10.1016/j.mri.2004.10.001.
6. Fukunaga M, Li T-Q, van Gelderen P, et al. Layer-specific variation of iron content in cerebral cortex as a source of MRI contrast. Proc Natl Acad Sci. 2010;107:3834-3839. doi:10.1073/pnas.0911177107.
7. Glasser MF, Coalson TS, Robinson EC, et al. A multi-modal parcellation of human cerebral cortex. Nature. 2016:1-11. doi:10.1038/nature18933.
8. Glasser MF, Van Essen DC. Mapping human cortical areas in vivo based on myelin content as revealed by T1- and T2-weighted MRI. J Neurosci. 2011;31(32):11597-11616. doi:10.1523/JNEUROSCI.2180-11.2011.
9. Sullivan E V., Adalsteinsson E, Rohlfing T, Pfefferbaum A. Relevance of Iron Deposition in Deep Gray Matter Brain Structures to Cognitive and Motor Performance in Healthy Elderly Men and Women: Exploratory Findings. 2009;3(2):167-175. doi:10.1007/s11682-008-9059-7.Relevance.
10. Pfefferbaum A, Adalsteinsson E, Rohl T, Sullivan E V. MRI estimates of brain iron concentration in normal aging?: Comparison of fi eld-dependent ( FDRI ) and phase ( SWI ) methods. 2009;47:493-500. doi:10.1016/j.neuroimage.2009.05.006.
11. Poynton CB, Jenkinson M, Adalsteinsson E, Sullivan E V., Pfefferbaum A, Wells W. Quantitative susceptibility mapping by inversion of a perturbation field model: Correlation with brain iron in normal aging. IEEE Trans Med Imaging. 2015;34(1):339-353. doi:10.1109/TMI.2014.2358552.
12. Bilgic B, Pfefferbaum A, Rohlfing T, Sullivan E V., Adalsteinsson E. MRI estimates of brain iron concentration in normal aging using quantitative susceptibility mapping. Neuroimage. 2012;59(3):2625-2635. doi:10.1016/j.neuroimage.2011.08.077.
13. Gelman N, Gorell JM, Barker PB, et al. MR Imaging of Human Brain at 3.0 T: Preliminary Report on Transverse Relaxation Rates and Relation to Estimated Iron Content. Radiology. 1999;210(3):759-767. doi:10.1148/radiology.210.3.r99fe41759.
14. Brown SA, Brumback T, Tomlinson K, et al. The National Consortium on Alcohol and NeuroDevelopment in Adolescence (NCANDA): A multisite study of adolescent development and substance use. J Stud Alcohol Drugs. 2015;76(6):895-908. doi:10.15288/jsad.2015.76.895.
15. Andersson JLR, Skare S. A model-based method for retrospective correction of geometric distortions in diffusion-weighted EPI. Neuroimage. 2002;16(1):177-199. doi:10.1006/nimg.2001.1039.
16. Smith SM, Jenkinson M, Woolrich MW, et al. Advances in functional and structural MR image analysis and implementation as FSL. Neuroimage. 2004;23 Suppl 1:S208-19. doi:10.1016/j.neuroimage.2004.07.051.
17. Rohlfing T, Zahr NM, Sullivan E V., Pfefferbaum A. The SRI24 multichannel atlas of normal adult human brain structure. Hum Brain Mapp. 2009;31(5):798-819. doi:10.1002/hbm.20906.
18. Diedrichsen J. A spatially unbiased atlas template of the human cerebellum. Neuroimage. 2006;33(1):127-138. doi:10.1016/j.neuroimage.2006.05.056.
19. Hipp DR. SQLite. 2016. https://www.sqlite.org/download.html.
20. Van Rossum G. Python 2.7, Python Software Foundation. 1991.
21. R Core Team. R Language Definition V. 3.1.1. 2014;3.1.1:55. http://mirror.fcaglp.unlp.edu.ar/CRAN/doc/manuals/r-patched/R-lang.pdf\nhttp://cran.r-project.org/doc/manuals/r-release/R-lang.pdf.
22. Larsen B, Luna B. In vivo evidence of neurophysiological maturation of the human adolescent striatum. Dev Cogn Neurosci. 2015;12:74-85. doi:10.1016/j.dcn.2014.12.003.
Figures