0814
In vivo measurement of g-ratio in the Corpus Callosum using the macromolecular tissue volume: evaluating changes as a function of Callosal subregions, age and sex.1The Edmond and Lily Safra Center for Brain Science, The Hebrew University of Jerusalem, Jerusalem, Israel, 2The Institute for Learning & Brain Sciences and the Department of Speech and Hearing Sciences, The University of Washington, Seattle, WA, USA.
Synopsis
Recent developments in quantitative and diffusion MRI, have made it possible to estimate the axonal g-ratio in human white-matter in-vivo. g-ratio is the ratio between the inner and outer radii of the myelin sheath wrapped around the axon. We suggest a simplified measurement of g-ratio incorporating proton density mapping, and implement it in the Corpus-Callosum of 100 subjects (ages 8-80). We find the g-ratio values agree with previously results. Furthermore, g-ratio values are stable over the lifespan and between the sexes. These results converge with theoretical evidence suggesting g-ratio has an optimal value for white-matter function.
Introduction
Axonal g-ratio is the ratio between the inner and outer radii of the myelin sheath wrapped around the axon. It has been analytically shown that the g-ratio affects fibers’ signal conduction velocity1,2, highlighting it as an important structural property of white-matter.
Ongoing developments in quantitative and diffusion MRI provide models3 that compute the g-ratio using two different white-matter microstructure parameters: the myelin and fiber volume fractions, (MVF, and FVF respectively) in a white-matter voxel. FVF and MVF can be estimated using different qMRI parameters3,4,5,6.
Purpose
In this work, we suggest a simplification of the g-ratio measurement by estimating the MVF using the lipid and macromolecule tissue-volume (MTV) that can be calculated from the proton-density7,8. Compared to other MVF estimates, MTV is a stable parameter with a straightforward acquisition in the brain; thus, our modification of the model simplifies the g-ratio measurement. We compare the new approach with previous approaches and implement it to observe the variance of g-ratio in the Corpus-Callosum, evaluating differences among Corpus-Callosum subregions, over the lifespan. Finally, we test the hypothesis suggesting sexual dimorphism of g-ratio during development9.Methods
The g-ratio was calculated on a large database that was used for our previous work10. The data includes DWI data (b=2000 s/mm2, 96 direction), SPGR scans with four flip angles (a = 4, 10, 20 and 30 degrees), and four spin-echo inversion recovery (SEIR) scans with variable inversion times (TI = 2400, 1200, 400, 50 ms). We calculated unbiased maps of MTV from SPGR and SEIR data11. To calculate g-ratio, we derive the FVF from a diffusion tensor imaging parameter, as in the original model3. We estimate the MVF by using the MTV which is calculated from the proton density7,8. Next, for each subject, the g-ratio was calculated in eight subregions of the Corpus-Callosum. The subregions were determined by identifying the mid-sagittal region of eight major Callosal fiber tracts with the Automated Fiber Quantification software package12. This was done for 100 subjects, (52 males) aged 7 to 81.Results
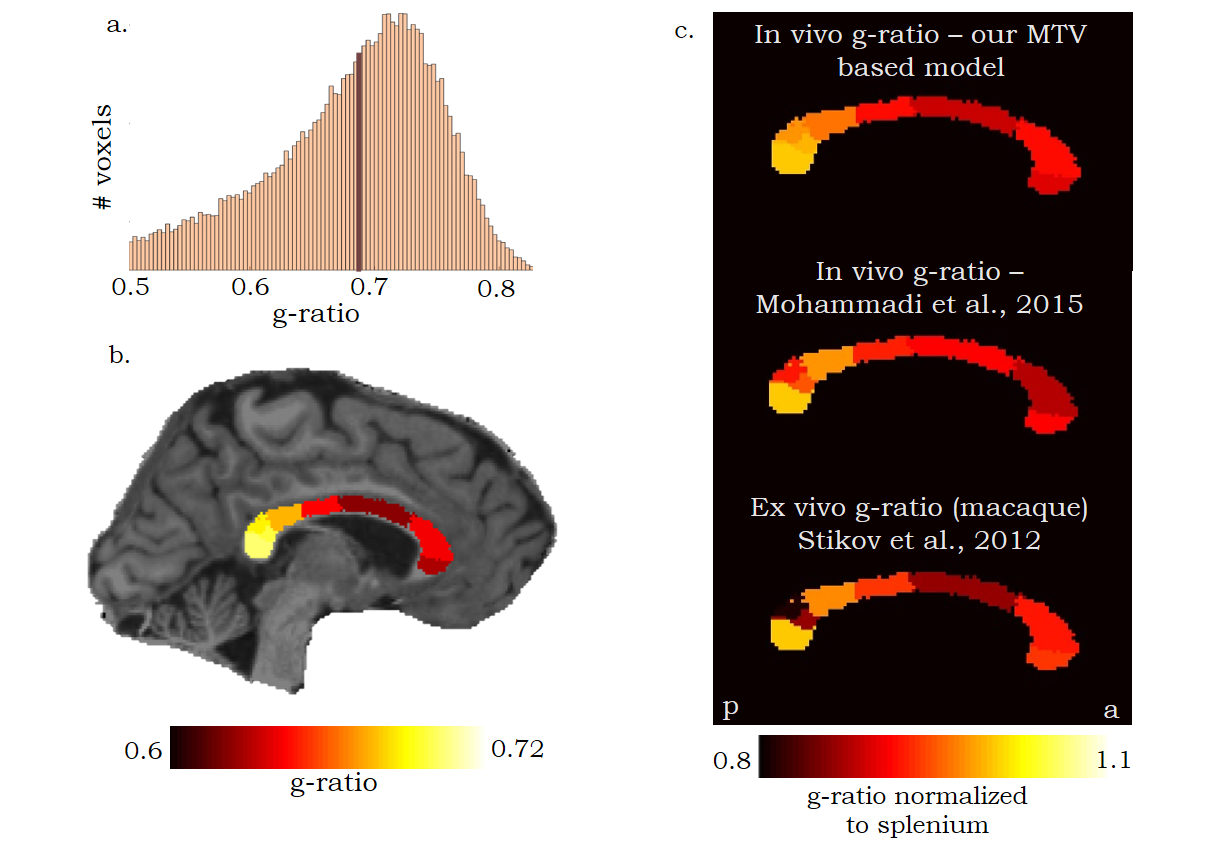
Figure 1a shows a histogram of g-ratio values in all subjects’ Corpus-Callosum subregions. The g-ratio values (g ̃= 0.69, MAD = 0.05) agree with values reported in the literature, in both theoretical and empirical studies1,2,4,5,6,13. We also found a trend following the posterior-anterior axis, such that the g-ratio is significantly higher in the posterior segments of the Corpus-Callosum (P<0.001) (fig. 1b). The relationship between the Splenium, mid-body and Genu of the Corpus-Callosum, is consistent across modalities and methods (fig. 1c).
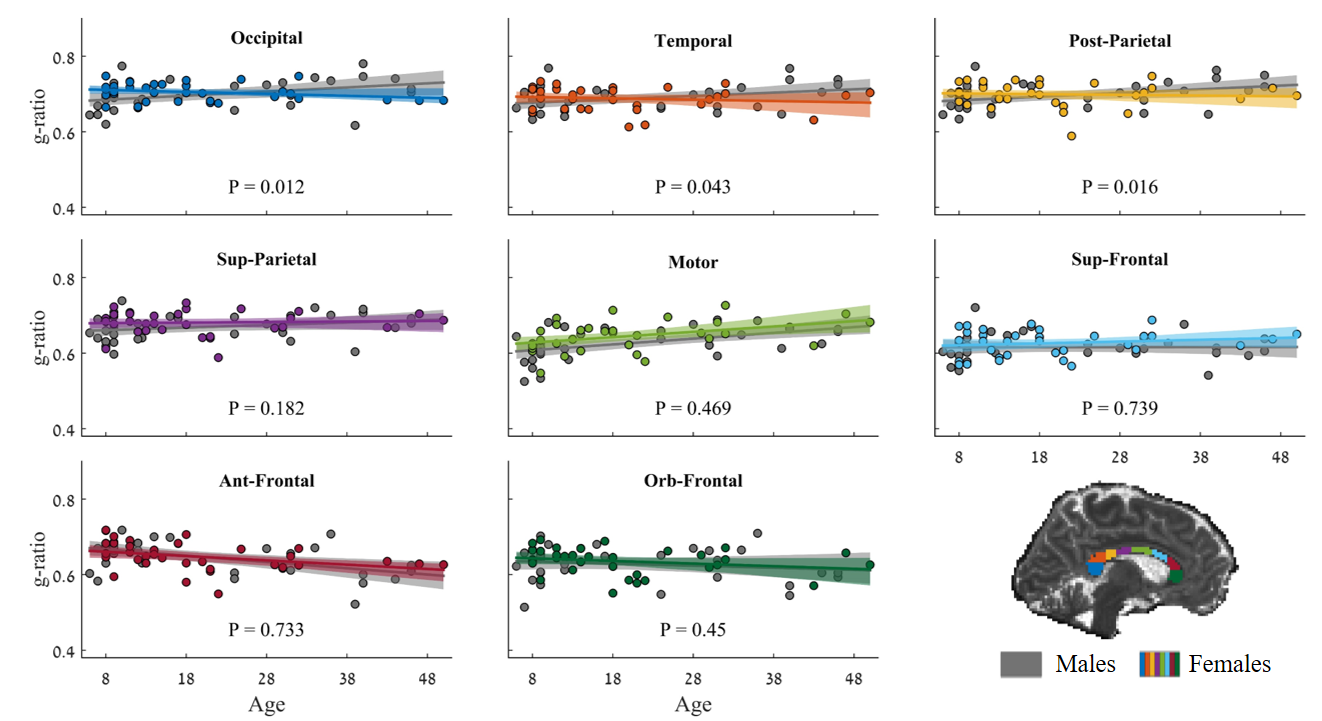
Next we evaluated the development of g-ratio over the lifespan in each Callosal subregion. Figure 2 shows the g-ratio as a function of age (6-50), both for males (in gray) and females. We find that in most Corpus-Callosum sub-regions the g-ratio is fairly constant as a function of age. In the motor and anterior frontal subregions, the g-ratio was significantly correlated with age (p<0.001). In the Motor sub-region, the g-ratio decreases with age, and in the Anterior frontal sub-region, the g-ratio increases with age. Finally, we found no significant differences between the development of g-ratio of males versus females, in any of the Callosal sub-regions.
Discussion
Our results indicate a stable g-ratio across age and sex. The stability of the g-ratio converges with theory and it is important in light of its remarkable effect on white-matter efficiency and conduction fidelity1,2. A possible interpretation to the fact that g-ratio remains relatively constant while other quantitative tissue parameters (e.g. FA, T1) show changes with age10,14, is that maintaining a constant g-ratio is valuable for reliable signal transduction in white-matter. Biomolecular studies, mostly in the PNS, have demonstrated correlation between axonal growth and myelination, and general mechanisms have been suggested. Hence, it is possible, that while previous finding of changes of measurements of in FA and T1 reflect changes in microstructure, these changes cancel out due to optimization mechanisms, and the g-ratio remains relatively constant.Conclusions
Taken together, our Corpus-Callosum results and a recent spinal cord study8, suggest that our simpler computation of g-ratio with MTV, is in line with other proposed analyses, and would be useful for future research. Furthermore, in agreement with the theoretical assumption, and unlike other MRI tissue parameters, g-ratio is found to be relatively constant across a large age range. We therefore propose that constant g-ratio values are critical for white-matter signal transduction, and therefor might hold promise for studying diseases with damaged conduction such as Multiple Sclerosis.Acknowledgements
No acknowledgement found.References
1. Rushton, W. A. H. (1951). A theory of the effects of fibre size in medullated nerve. The Journal of Physiology, 115(1), 101-122.
2. Chomiak, T., & Hu, B. (2009). What is the optimal value of the g-ratio for myelinated fibers in the rat CNS? A theoretical approach. PLoSONE .
3. Stikov, N. (2012). Bound Pool Fractions Complement Diffusion Measures to Describe White Matter Micro and Macrostructure. Changes, 29(6), 997–1003
4. Stikov, N., Campbell, J. S., Stroh, T., Lavelée, M., Frey, S., Novek, J., ... & Leppert, I. R. (2015). In vivo histology of the myelin g-ratio with magnetic resonance imaging. NeuroImage, 118, 397-405.
5. Weiskopf, N., Mohammadi, S., Lutti, A., & Callaghan, M. F. (2015). Advances in MRI-based computational neuroanatomy: from morphometry to in-vivo histology. Current opinion in neurology, 28(4), 313-322.
6. Dean, D. C., O'Muircheartaigh, J., Dirks, H., Travers, B. G., Adluru, N., Alexander, A. L., & Deoni, S. C. (2016). Mapping an index of the myelin g-ratio in infants using magnetic resonance imaging. NeuroImage, 132, 225-237.
7. Mezer ,A . Yeatman, J.D., Stikov, N., Kay, K.N., Cho, N.---J., Dougherty, R.F., Perry, .L., Parvizi, J.,Hua, L.H., Butts---Pauly, K., Wandell, B. a, 2013. Quantifying the local tissue volume and composition in individual brains withmagnetic resonance imagingNat. Med. 19, 1667–72.
8. Duval, T., McNab, J. A., Setsompop, K., Witzel, T., Schneider, T., Huang, S. Y., ... & Cohen-Adad, J. (2015). In vivo mapping of human spinal cord microstructure at 300mT/m. NeuroImage, 118, 494-507.
9. Paus, T., & Toro, R. (2009). Could Sex Differences in White Matter be Explained by g ratio? Frontiers in Neuroanatomy, 3(September), 14.
10. Yeatman, J. D., Wandell, B. A., & Mezer, A. A. (2014). Lifespan maturation and degeneration of human brain white matter. Nature communications, 5.
11. Mezer, A., Rokem, A., Berman, S., Hastie, T., & Wandell, B. A. (2016). Evaluating quantitative proton-density-mapping methods. Human brain mapping.
12. Yeatman, J.D., Dougherty, R.F., Myall, N.J., Wandell, B.A., Feldman, H.M., 2012. tract Profiles of White Matter Properties: Automating Fiber---Tract Quantification. PLoS One 7,e49790.
13. Cercignani, M., Giulietti, G., Dowell, N. G., Gabel, M., Broad, R., Leigh, P. N., ... & Bozzali, M. (2017). Characterizing axonal myelination within the healthy population: a tract-by-tract mapping of effects of age and gender on the fiber g-ratio. Neurobiology of Aging, 49, 109-118.14. Giorgio, A., Santelli, L., Tomassini, V., Bosnell, R., Smith, S., De Stefano, N., & Johansen-Berg, H. (2010). Age-related changes in grey and white matter structure throughout adulthood. Neuroimage, 51(3), 943-951.
Figures