0812
Comparison of NODDI and WMTI microstructural parameters in typical development1Laboratory of Neuro Imaging, University of Southern California, Los Angeles, CA, United States
Synopsis
Childhood and adolescence is an extended period of postnatal maturation characterized by dynamic changes in white matter microstructure. Multi-shell diffusion MRI (dMRI) models, such as neurite orientation dispersion and density imaging (NODDI) and white matter tract integrity (WMTI) provide an invaluable measure for the study of child development with tissue compartment estimates. NODDI and WMTI are based on similar frameworks, however they differ in several model assumptions. This study provides a comparison of NODDI and WMTI intra-axonal volume fraction model fittings in a cohort of children ages 0 -18 years in order to determine which model best reflects neurodevelopmental features.
Introduction
Typical postnatal brain maturation during critical developmental periods leads to changes in synaptic plasticity reflected by microstructural remodeling of tissue through axonal and synaptic sprouting, synaptogenesis, and changes in myelin formation [1][2]. While current in vivo diffusion MRI (dMRI) methods, like diffusion tensor imaging (DTI), have successfully characterized the gross structure of major white matter tracts [3-5], these measures lack specificity for developmentally relevant microstructural changes. Neurite orientation dispersion and density imaging [6] (NODDI) and white matter tract integrity [7] (WMTI) are 2 multi-shell diffusion approaches that model the intra-axonal space as zero-radius impermeable cylinders and the extra-axonal space with anisotropic Gaussian diffusion. NODDI and WMTI differ, however, in some critical assumptions: (1) NODDI models an additional free diffusion compartment, (2) WMTI estimates intra- and extra-axonal diffusivities, while NODDI assumes a priori diffusivity values, and (3) the NODDI model accounts for orientation dispersion, while WMTI can model fiber dispersion up to 30 degrees [8]. The purpose of this study is to determine how major white matter tracts develop using the intra-axonal volume fractions obtained with NODDI and WMTI. The models will be compared with one another to determine the conditions that may favor one model over another in a developmental framework.Methods
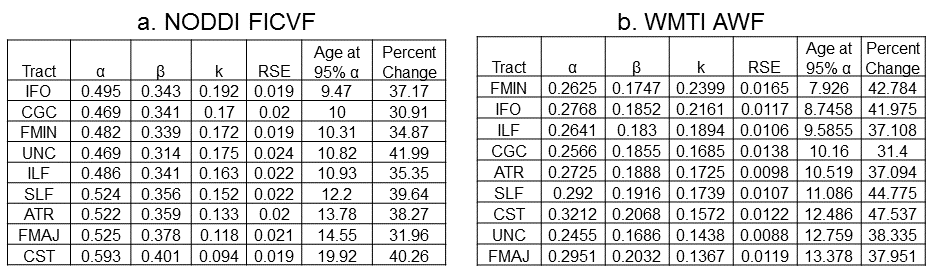
MRI scans of 148 typically developing children recruited through the Cincinnati MR Imaging of NeuroDevelopment (C-MIND) consortium (http://research.cchmc.org/c-mind) will be included in this study (0.6 – 18.8 years; 78 F; 8.9 ± 5 years). Data was collected on a 3T Philips Achieva scanner. Two DWI were acquired with the following parameters: 2 mm isotropic voxels, 112 x 109 acquisition matrix, and 61 noncollinear diffusion sensitizing gradient directions with b = 1000 s/mm2 or b=3000 s/mm2. Nine bilateral major white matter tracts (Figure 1) were extracted using methods described in [9] using probabilistic streamline tractography implemented with [10]. Average NODDI intracellular volume fraction (FICVF) and WMTI axonal water fraction (AWF) were computed for each tract, and per-voxel model fitting was performed to determine the amount of signal variance accounted for by the model. Age-related changes in parameters were fit with Brody growth models: $$$p = α(1-β*e^{-k*age})$$$ where p is the intra-axonal volume fraction parameter, α is the asymptote, β is the intercept, and k is the growth rate.Results
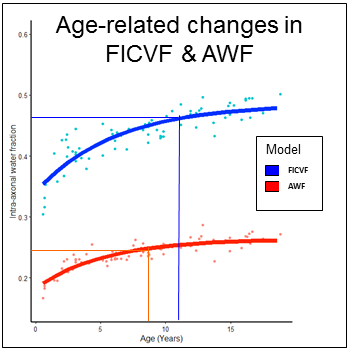
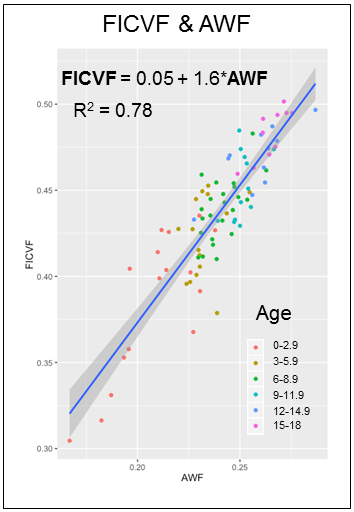
Overall, NODDI FICVF was significantly higher than WMTI AWF (Figure 1). Consistent with developmental patterns observed in [8], qualitative assessment of age-related changes in intra-axonal volume fractions show similar growth curve shape between NODDI and WMTI (Figure 2). NODDI, however, consistently estimates that the asymptote is reached at much later ages than WMTI (Figure 1). NODDI and FICVF and WMTI AWF show high correlation (Figure 3), which varies from tract to tract. Regions of high orientation dispersion, such as the cingulum, exhibit lower correlation between AWF and FICVF (R2=0.67), which regions of low orientation dispersion, such as the corticospinal tract, exhibit higher correlation between AWF and FICVF (R2=0.86).Discussion
Our results show that NODDI FICVF and WMTI AWF are sensitive to developmental changes in major white matter tracts and exhibit similar age-related growth curve trends, however tract-specific heterogeneity was observed. Differences in the relative intra-axonal volume fraction between NODDI and WMTI likely arises due to model-specific assumptions. For example, WMTI models only 2 compartments – intra-axonal and extra-axonal – and assumes per-voxel fiber orientations exhibit low dispersion; therefore, this model will not perform well in regions of crossing fibers or complex orientations, as observed with the cingulum in our results. Alternately, NODDI estimates may be complicated by the assumption of fixed a priori diffusivity values, which may or may not be valid in a developmentally immature dataset. In order to determine which model better reflects neurodevelopmental features, a per-voxel fitting will be employed to estimate the reliability of each model.Conclusion
NODDI and WMTI provide invaluable tools to probe specific microstructural changes in development, and their parameters are believed to reflect neurite density. While both models arise from a common framework, significant differences exist in their assumptions. This study compares NODDI and WMTI model implementation in a developmental dataset in order to determine the neurodevelopmental contexts that favor one model over another. Differences in regional free diffusion, intracellular diffusivities, and fiber orientations will influence the validity of NODDI and WMTI. Therefore, a complete comparison of these models and their performance in different regions will assist clinical and research practitioners in selecting models that will best address their questions.Acknowledgements
This project is supported by the National Institutes of Health Grants R21NS091586, R00HD065832, R01MH094343, P41EB015922, and U54EB020406. The content is solely the responsibility of the authors and does not necessarily represent the official views of the NIH.
References
[1] Trachtenberg, J. T., Chen, B. E., Knott, G. W., Feng, G., Sanes, J. R., Welker, E., & Svoboda, K. (2002). Long-term in vivo imaging of experience-dependent synaptic plasticity in adult cortex. Nature, 420, 788-794. [2] Gregg, C., Shikar, V., Larsen, P., Mak, G., Chojnacki, A., Yong, V. W., & Weiss, S. (2007). White matter plasticity and enhanced remyelination in the maternal CNS. The Journal of Neuroscience, 27(8), 1812–1823. [3] Lebel, C., & Beaulieu, C. (2011). Longitudinal development of human brain wiring continues from childhood into adulthood. The Journal of Neuroscience, 31(30), 10937–47. [4] Mukherjee, P., Miller, J. H., Shimony, J. S., Conturo, T. E., Lee, B. C. P., Almli, C. R., & Mckinstry, R. C. (2001). Normal Brain Maturation during Childhood?: Developmental Trends Characterized with. Radiology, 221(2), 349–58. [5] Barnea-Goraly, N., Menon, V., Eckert, M., Tamm, L., Bammer, R., Karchemskiy, A., Dant, C. C., & Reiss, A. L. (2005). White matter development during childhood and adolescence: a cross-sectional diffusion tensor imaging study. Cerebral Cortex, 15(12), 1848–54. [6] Zhang, H., Schneider, T., Wheeler-Kingshott, C. A., & Alexander, D. C. (2012). NODDI: practical in vivo neurite orientation dispersion and density imaging of the human brain. NeuroImage, 61(4), 1000–16. [7] Fieremans, E., Jensen, J. H., & Helpern, J. A. (2011). White matter characterization with diffusional kurtosis imaging. NeuroImage, 58(1), 177–88. [8] Jelescu, I. O., Veraart, J., Adisetiyo, V., Milla, S., Novikov, D. S., & Fieremans, E. (2014). One diffusion acquisition and different white matter models: How does microstructure change in human early development based on WMTI and NODDI? NeuroImage, 107, 242–256. [9] Wakana, S., Caprihan, A., Panzenboeck, M. M., Fallon, J. H., Perry, M., Gollub, R. L., Hua, K., Zhang, J., Jiang, H., Dubey, P., Blitz, A., van Zijl, P., & Mori, S. (2007). Reproducibility of quantitative tractography methods applied to cerebral white matter. NeuroImage, 36(3), 630–644. [10] Tournier, J.-D., Calamante, F., & Connelly, A. (2012). MRtrix: Diffusion tractography in crossing fiber regions. International Journal of Imaging Systems and Technology, 22(1), 53–66.
Figures