0810
Socioeconomic Status Influences Early Longitudinal Cortical and Subcortical Development1Advanced Baby Imaging Lab, Department of Engineering, Brown University, Providence, RI, United States, 2Waisman Center, University of Wisconsin Madison, Madison, WI, United States, 3Department of Pediatric Radiology, Children's Hospital Colorado, Aurora, CO, United States
Synopsis
Brain development may be influenced by socioeconomic status (SES), a marker of a family’s income and parental education. SES differences may result in exposure to extra stress during critical periods of neurodevelopment. We performed the first longitudinal analysis of differential brain development in 70 healthy infants and young children (1 year to 6 years of age) stratified by familial SES using high resolution T1 MRI. We demonstrated that trajectories of subcortical and cortical maturation are significantly different between infants and children from low and high SES families over the first 6 years of life.
Introduction: Brain development may be influenced by socioeconomic status, a marker based on a family’s income and/or parental education. SES variability leads to varying cognitive and social-emotional development as infants and young children are possibly exposed to extra stress during critical periods of neurodevelopment1-3. Greater cortical thickness has been reported in children and adolescents 3 to 20 years of age with significant differences arising in regions supporting language, memory, and executive function4. These prior results provide insight on the neuroanatomical differences during later childhood and adolescent development, but fail to consider early brain development in infants and young children where both cortical and subcortical structures undergo dynamic change5-6.
Purpose: In this work, we performed the first
longitudinal analysis of differential brain development in healthy infants and
young children (1 year to 6 years of age) stratified by familial socioeconomic
status, an aggregate metric of familial income and education. Using mixed
effects modeling, we examined subcortical volume and cortical thickness
maturation profiles in participants with high and low SES. We show that cortical thickness and
subcortical volume differ in children over the first 6 years of life with
respect to familial SES.
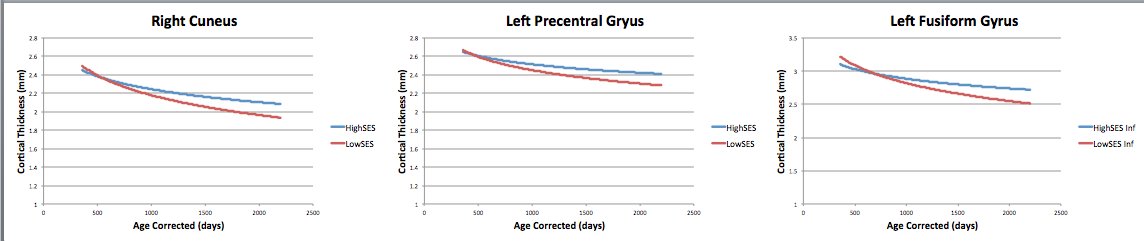
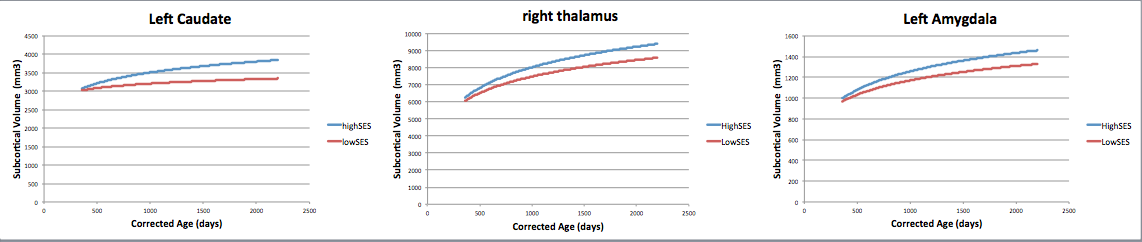
Materials/Methods: Longitudinal high-resolution T1 images were successfully obtained from 70 infants and young children (total of 95 imaging data sets) grouped according to SES. SES was determined through a questionnaire that ranked participants according to highest educational level and income category achieved by parents using the Hollingshead index7. Low SES was considered a Hollingshead index below 4 (less than 7th grade to partial high school education) and high SES was considered above 5 (college graduate to graduate training). Subjects were 1 to 6 years of age and all data was acquired on a Siemens Tim Trio scanner during non-sedated sleep or while watching a movie8. Advanced Normalization Tools (ANTs) bias correction (N3) was performed on all the data9, and cortical thickness and subcortical volume values were calculated and analyzed using Freesurfer10. Cortical thickness values were obtained in millimeters (mm) and characterized as the distance between the pia and the gray/white matter boundary for each specific image. Non-linear mixed-effects models were fit to the data in order to characterize regional cortical development from 34 brain regions per hemisphere and 34 subcortical regions. Initial analysis consisted of exploratory hypothesis testing of all 68 distinct brain regions between groups of high and low SES. Next, we investigated differential neurodevelopment in subcortical regions associated with altered brain development in older cohorts. Significance was defined as p < 0.0003 (p < 0.05 corrected for 68 brain regions and 2 parameters per model)
Results: Our sample included 46 subjects with high SES and 24 subjects with low SES. Groups were matched for race, ethnicity, birth weight, gestational duration, maternal age, delivery type, breast vs. bottle feeding, in utero smoke exposure. Subcortical volume growth curves showed significant developmental differences with a decreased rate of subcortical maturation observed in the left caudate, left amygdala, and right thalamus for subjects with low SES. Cortical thickness growth curves showed significant developmental difference with decreased thickness values observed in the left caudal anterior cingulate, left entorhinal cortex, bilateral fusiform gyrus, left lateral orbitofrontal cortex, bilateral lingual gyrus, left parahippocampal gyrus, left precentral gyrus, left temporal pole, left insula, and right cuneus. Discussion: The longitudinal findings on differential brain development based on SES, presented here extend prior results in older cohorts with respect to cortical and subcortical structures4. Consistent with prior studies4, we demonstrate that SES significantly influences the development of the fusiform gyrus bilaterally before 3 years of age and starts as early as 1 year of age. This is consistent with the hypothesis that SES moderates age-related changes in cortical thickness in regions that support language and reading1-5. Our results further extend observed differences in amygdala1 development in older children to our cohort of infants and young children. Data presented here furthers the theory that possible stress and altered social-emotional environment has influences on brain development as early as one year of age1-4.
Conclusion: In this study we have sought to identify the impact familial socioeconomic status has on longitudinal subcortical and cortical development in a young cohort of infants and children. We have demonstrated that trajectories of subcortical and cortical development are significantly different between infants and children from low SES and high SES families over the first 6 years of life. While the relationship of these findings and long term brain differences remains unclear, family education and income play an important role shaping early neurodevelopment.
Acknowledgements
No acknowledgement found.References
1. Noble, Kimberly G., et al. "Family income, parental education and brain structure in children and adolescents." Nature neuroscience 18.5 (2015): 773-778.
2. Noble, Kimberly G., et al. "Neural correlates of socioeconomic status in the developing human brain." Developmental science 15.4 (2012): 516-527.
3. Noble, Kimberly G., Bruce D. McCandliss, and Martha J. Farah. "Socioeconomic gradients predict individual differences in neurocognitive abilities." Developmental science 10.4 (2007): 464-480.
4. Piccolo, Luciane R., et al. "Age-Related Differences in Cortical Thickness Vary by Socioeconomic Status." PloS one 11.9 (2016): e0162511.
5. Gilmore, John H., et al. "Longitudinal development of cortical and subcortical gray matter from birth to 2 years." Cerebral Cortex 22.11 (2012): 2478-2485.
6. Croteau-Chonka, Elise C., et al. "Examining the relationships between cortical maturation and white matter myelination throughout early childhood." NeuroImage 125 (2016): 413-421.
7. Hollingshead, A. A. (1975). Four-factor index of social status. Unpublished manuscript, Yale University, New Haven, CT.
8. Dean III, Douglas C., et al. "Pediatric neuroimaging using magnetic resonance imaging during non-sedated sleep." Pediatric radiology 44.1 (2014): 64-72.
9. Sled, John G., Alex P. Zijdenbos, and Alan C. Evans. "A nonparametric method for automatic correction of intensity nonuniformity in MRI data." IEEE transactions on medical imaging 17.1 (1998): 87-97.
10. Fischl, Bruce. "FreeSurfer." Neuroimage 62.2 (2012): 774-781.
Figures