0809
Multimodal thalamocortical connectivity patterns in early brain development1Newborn Medicine, Boston Children's Hospital, Boston, MA, United States, 2Radiology, Boston Children's Hospital, Boston, MA, United States, 3Massachussetts General Hospital, Boston, MA, United States, 4University of Illinois at Urbana-Champaign, Urbana, IL, United States
Synopsis
Understanding normal thalamocortical organization in early brain development has significant clinical relevance as it could provide early indicators of neurodevelopmental disorders which could originate from alterations in functional and structural brain maturation. Here we show structural and functional thalamocortical connectivity patterns derived from twenty healthy term infants scanned within the first weeks of life. Our results show that while there is a general good spatial agreement between both modalities, there are certain regions that exhibit different thalamocortical patterns. These discrepancies are possibly mediated by maturational processes such as axonal myelination and synaptogenesis.
Introduction
Cortical specification occurs primarily through thalamocortical afferents that develop prenatally. For this reason, the thalamocortical system is a suitable target for detection and assessment of abnormal brain development originating prenatally (1). Despite recent interest in exploring the cortical-subcortical organization in infants and children using diffusion-weighted MRI (DWI) and resting-state functional MRI (rs-fMRI) (1-5), little is known about the relationship between brain structure and function in early life. While function is determined by structure, structure is constantly shaped by functional activity influenced by the environment. Here we show structural and functional connectivity maps derived from healthy term infants scanned within the first weeks of life. Our results show that while there is a general good spatial agreement between both modalities, there are certain regions that exhibit different thalamocortical patterns of functional and structural connectivity.Methods
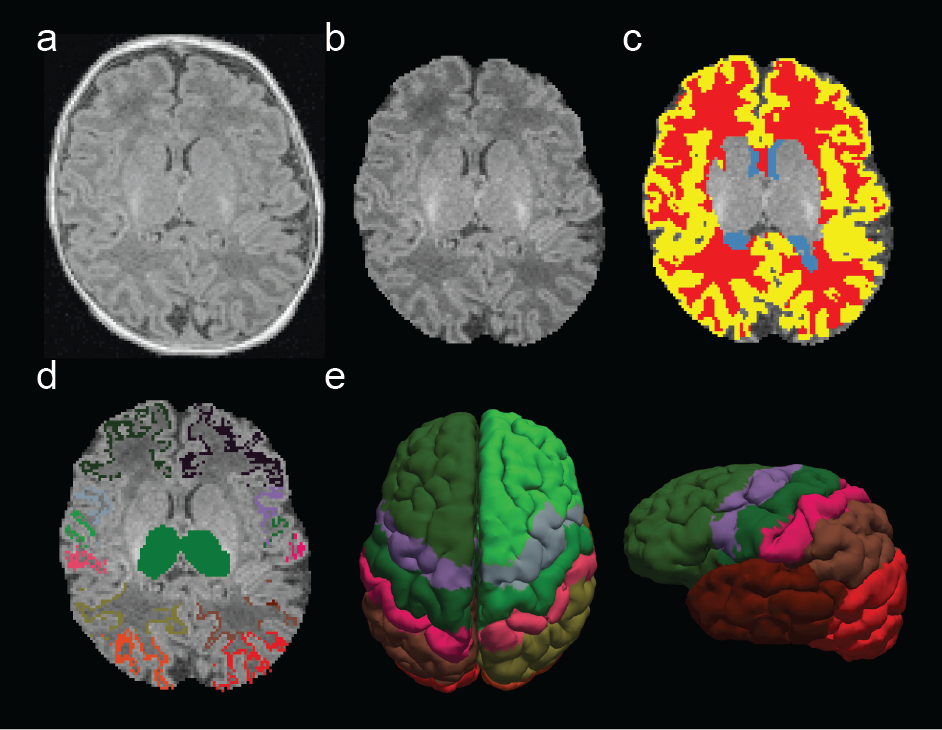
Twenty full-term infants (gestational age: 38-41 weeks) were scanned within the first month of life. Written consent was obtained from parents in accordance with Boston Children’s Hospital IRB guidelines. Infants were not sedated during scans. All sequences were acquired using a Siemens 3T Skyra: motion-compensated multi-echo MPRAGE, 1 mm3 voxel size; DWI (TE = 104 ms, TR = 3700 ms; thirty directions were acquired at b = 1000 and 2000 s/mm2) accelerated with 2 x GRAPPA and simultaneous multi-slice (SMS) factor of 2, 2 mm3 voxel size; rs-fMRI (TE = 36 ms, TR = 1360 ms) with SMS factor of 3, 350 frames, and 2 mm3 voxel size. After skull stripping (Figure 1b), cerebrospinal fluid (CSF), white matter (WM), and gray matter (GM) masks were automatically segmented from individual MPRAGE scans (Figure 1c). Thalamic and cortical regions of interest (ROIs) were extracted from individual MPRAGE scans through detailed semi-automatic segmentation (Figure 1d). DWI processing included: extraction of diffusion gradients and b-values, eddy current correction, and probabilistic tractography between pre-determined manually defined seed and target ROIs. Seed ROIs were left and right thalamus and target ROIs were a set of cortical labels (Figure 1e). The probability of structural connectivity was computed as the proportion of tracts that propagated from a particular thalamic voxel to a given target ROI. rs-fMRI processing included: slice timing correction for SMS acquisition, head motion correction, estimation of motion regressors, and intensity normalization. Motion regressors and mean signals from cerebrospinal fluid (CSF) and white matter (WM) masks were regressed out. Band-pass filtering (0.008 - 0.09 Hz) and spatial smoothing (Gaussian kernel, FWHM = 4 mm) were applied after nuisance regression. Frames with FD > 0.25 mm and DVARS > 3% were removed from further analysis. A minimum of 5 minutes of usable fMRI data were required for subject inclusion. Partial correlations were computed between mean cortical signals (extracted from cortical ROIs) and time-series extracted from each thalamic voxel. Individual connectivity maps for each modality were converted to a normal distribution by Fisher’s z-transformation, registered to a neonatal template and averaged across subjects. Group maps were corrected for multiple comparisons (FDR, p < 0.01). Spatial overlap between modalities was quantified using overlap percentage and dice’s coefficients.Results
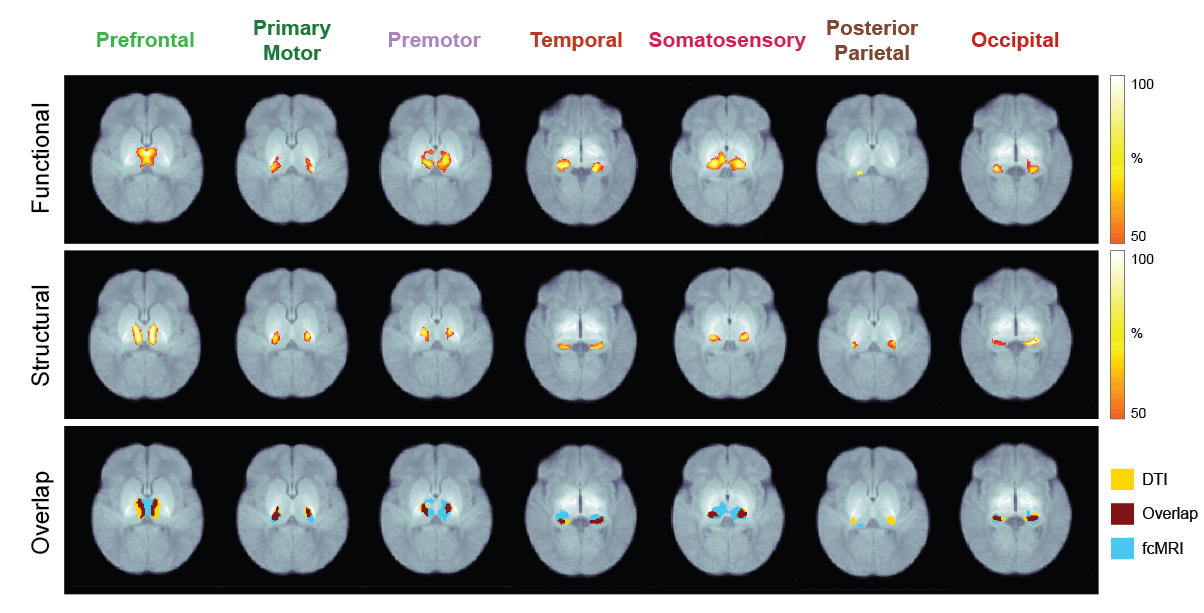
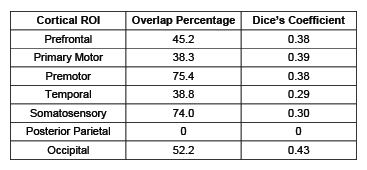
Seven thalamocortical connectivity maps were obtained for each modality (Figure 2). Spatial comparisons between modalities show variable degrees of spatial agreement depending on the cortical ROI considered (Figure 2, Table 1). The largest spatial overlap is observed between DWI and rs-fMRI connectivity maps for the occipital region, followed by premotor, primary motor and prefrontal regions. In contrast, the somatosensory region shows different spatial patterns, with the DWI connectivity maps being more focal than rs-fMRI. Spatial differences are also observed in the connectivity maps obtained for the temporal region, with DWI maps located more posteriorly than rs-fMRI maps. Finally, the most striking mismatch is observed in the posterior-parietal region, where no overlap is observed between modalities.Conclusions
Thalamocortical connectivity patterns have been well studied in adults (7), showing overall a good overlap between functional and structural connectivity. While our multimodal patterns in healthy neonates are robust, they show regional variations in spatial agreement that could be potentially mediated by myelination and synaptogenesis processes. Characterizing normal structural and functional thalamocortical connectivity during early brain development is the first step in detecting alterations in pathologic cases and in understanding the complex interplay between structural and functional thalamocortical organization in early development.Acknowledgements
This work was supported by a grant from Abbott Nutrition through the Center for Nutrition, Learning, and Memory at the University of Illinois.References
1. Ball, G. (2015), “Thalamocortical connectivity predicts cognition in children born preterm”, Cerebral Cortex, vol. 5, no. 11, pp. 4310-8.
2. Fair, D.A. (2010), “Maturing thalamocortical functional connectivity across development”, Frontiers in Systems Neuroscience, vol. 4, no. 10, pp. 1-10.
3. Greene, D.J. (2014), “Developmental changes in the organization of functional connections between the basal ganglia and cerebral cortex”, J Neuroscience, vol. 34, no. 17, pp. 5842-54.
4. Toulmin, H. (2015), “Specialization and integration of functional thalamocortical connectivity in the human infant”, Proc Natl Acad Science, vol. 112, no. 20, pp. 6485-90.
5. Alcauter, S. (2014), “Development of thalamocortical connectivity during infancy and its cognitive correlations”, J Neuroscience, vol. 34, no. 27, pp. 9067-75.
6. FreeView. Available from: http://surfer.nmr.mgh.harvard.edu/fswiki/FreeviewGuide.
7. Zhang, D. (2010), “Noninvasive functional and structural connectivity mapping of the human thalamocortical system”, Cerebral Cortex, vol. 20, no. 5, pp. 1187-94.
Figures