0808
The short-range association fibers underlie brain network reconfiguration in typically and atypically developing children1Radiology, Children's Hospital of Philadelphia, Philadelphia, PA, United States, 2Radiology, Beijing Children's Hospital, Capital Medical University, Beijing, People's Republic of China, 3Radiology, Perelman School of Medicine, University of Pennsylvania, Philadelphia, PA, United States, 4Neurology, Perelman School of Medicine, University of Pennsylvania, Philadelphia, PA, United States
Synopsis
Short-range association fibers (SAF) or U-fibers, connect adjacent gyri and constitute the majority of brain white matter. During development, SAF undergo dramatic changes in conjunction with brain network reconfiguration. How SAF reshape the brain network configuration during typical and atypical development is unknown. In this study, SAF was quantified with an index defined as normalized short-range association fibers (NSAF). We found that NSAF decreases were associated with increases in brain network efficiency in the typical developing brain from 2-7 years. Similar association were not observed in children with autism.
Purpose
Short-range association fibers (SAF), also known as U-fibers, connect adjacent gyri and constitute the majority of white matter(WM) in the human brain[1]. Long-range association fibers(LAF) in the developing brain have been well characterized[2-3]. During brain development, SAF undergo dramatic changes[4] in parallel to the brain network reconfiguration[5-6]. However, how SAFs reshape the brain network configuration during typical and atypical development is unknown. The perturbation of the developmental trajectory of SAF may cause mental disorders such as autism spectrum disorder(ASD) and schizophrenia[7-8]. Here, we quantified SAF with an index defined as normalized SAF (NSAF), which is the ratio of the number of SAFs to the number of entire brain cortico-cortical connectivity fibers (sum of SAF and LAF) traced with diffusion MRI(dMRI) tractography. The goal is to understand the role of SAFs in reshaping the brain network configuration of typically and atypically developing children. Children aged 2-7 years with typical development(TD) and those with ASD were studied.Methods
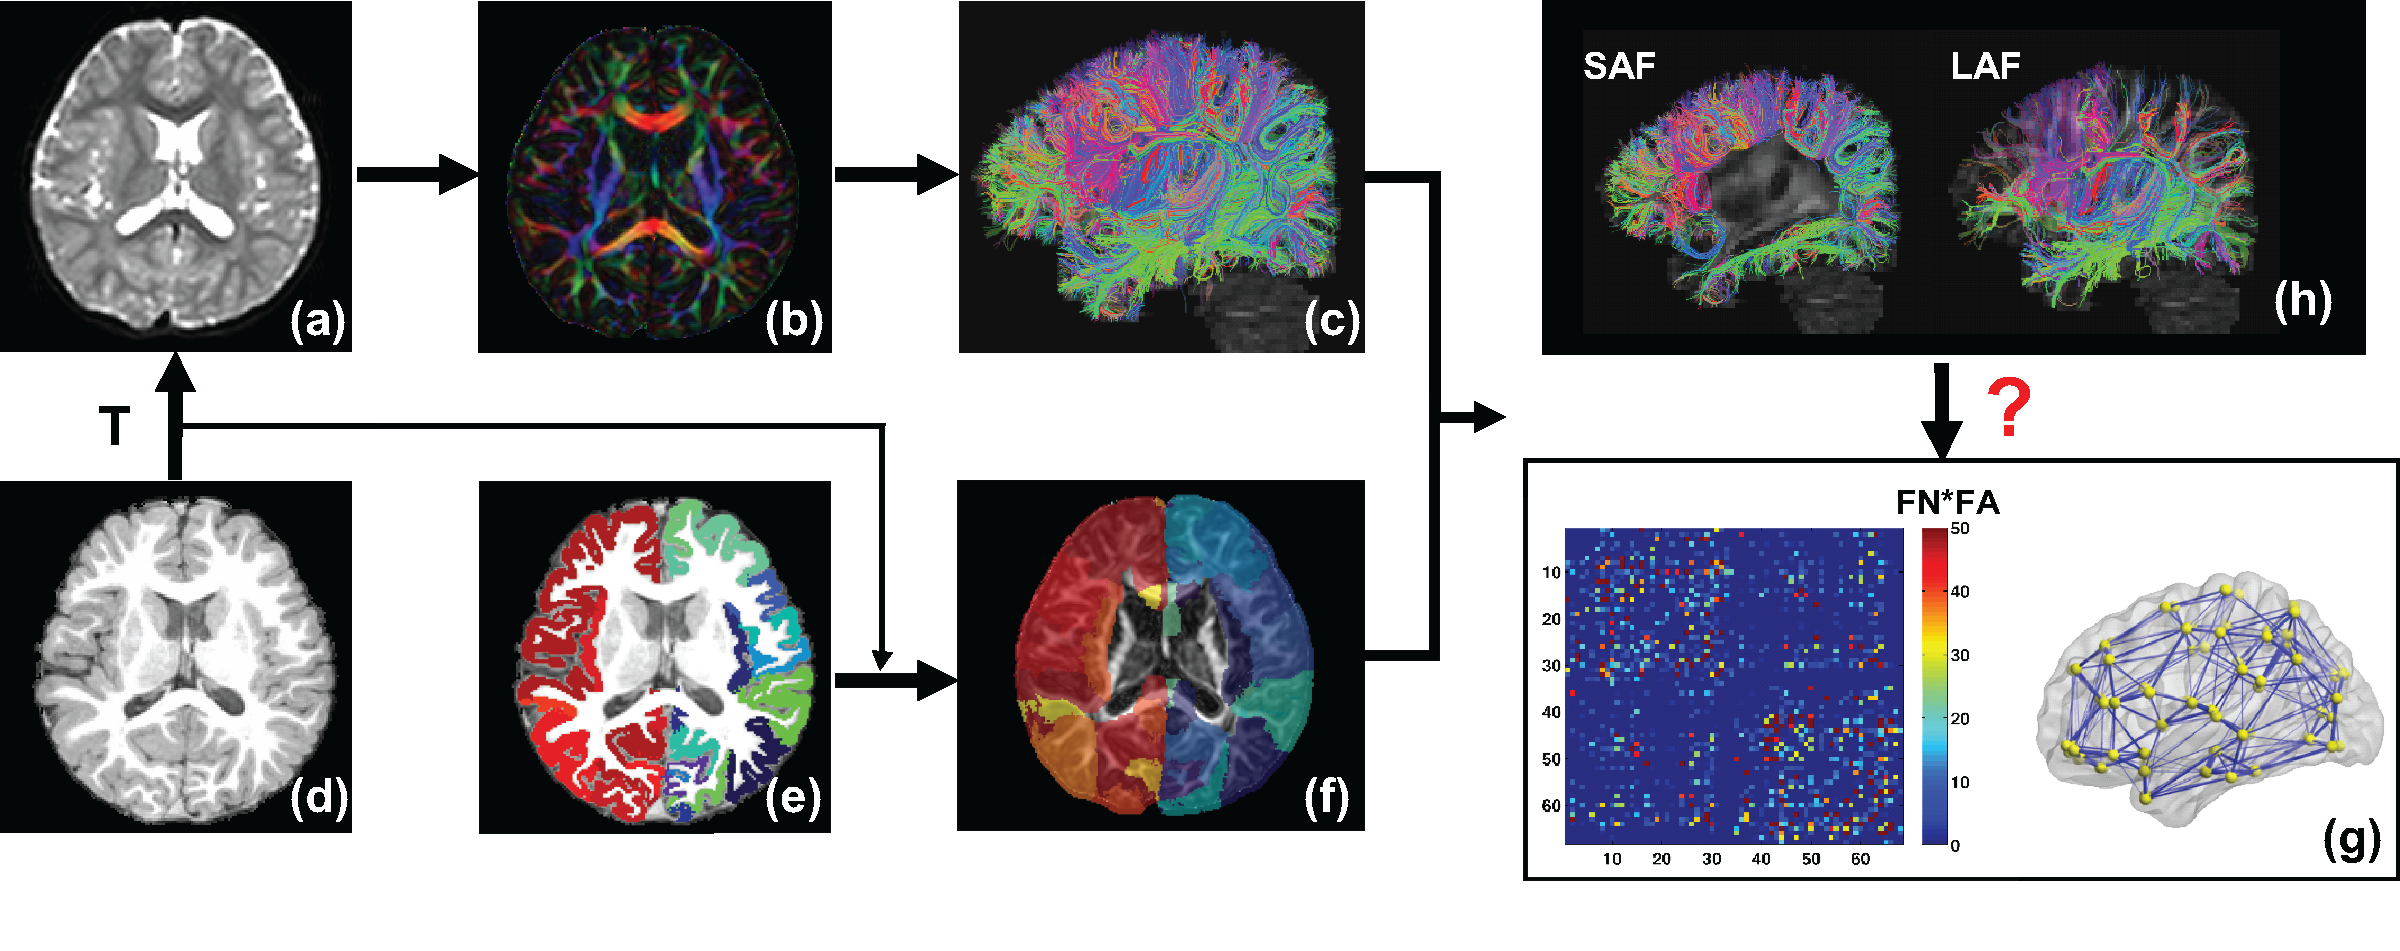
Participants: 30 children with ASD(aged 2-7 years) and 20 age-matched children with TD participated. Acquisition of dMRI and T1-weighted image: All MR scans were performed on a 3T Philips Achieva MR system. dMRI were acquired using single-shot EPI with SENSE=2.3. Other parameters were: TR/TE=7960/83ms, FOV=256x256mm2, imaging resolution=2x2x2mm3, 70 slices, 30 independent diffusion-weighted directions, b-value=1000 sec/mm2. T1-weighted images were acquired using MPRAGE sequence with imaging resolution=1x1x1mm3. Fiber tracing from parcellated cortical gyri and brain network construction: Using the T1-weighted image, the brain cortical surface was rendered and parcellated into 68 gyral labels[9] using Freesurfer(http://surfer.nmr.mgh.harvard.edu)(Fig 1d-1e). The parcellated cortical ribbon transformed from T1-weighted image space(Fig 1d) to dMRI space(Fig 1a) was then dilated by 8mm (overlaid on FA image in Fig 1f) with in-house program to get through the dense WM zone for initiating fiber tracking[10]. Fiber assignment of continuous tractography[11] was used to trace the whole brain fibers for all subjects in DiffusionToolkit(http://www.trackvis.org/dtk/) with an angular threshold of 60o(Fig 1a-1c). A symmetric 68x68 brain connection matrix was constructed using the number of fibers multiplied by mean FA(FNxFA) of all connected fibers between two regions to define the weight of the edge(Fig 1c, 1f-1g). 3D representation of WM structural network is shown using BrainNetViewer(Fig 1g). All network analyses (e.g. global efficiency metric calculation) were performed using Gretna(http://www.nitrc.org/projects/gretna/). Categorization of long- and short-range fibers based on termination location of the other end of fibers: The adjacent and non-adjacent gyral labels of each cortical gyrus were identified. Once identified, association fibers initiating from a given cortical gyrus can be categorized into SAF and LAF based on whether the other end of the fibers terminate in adjacent or non-adjacent gyri, respectively. Whole brain NSAF was calculated as the ratio between the total number of SAFs and total number of entire brain cortico-cortical fibers(sum of SAF and LAF, Fig 1h) from all 68 gyri. Statistical analysis: To investigate the relationship between whole brain NSAF and global network efficiency, linear regression was performed.Results
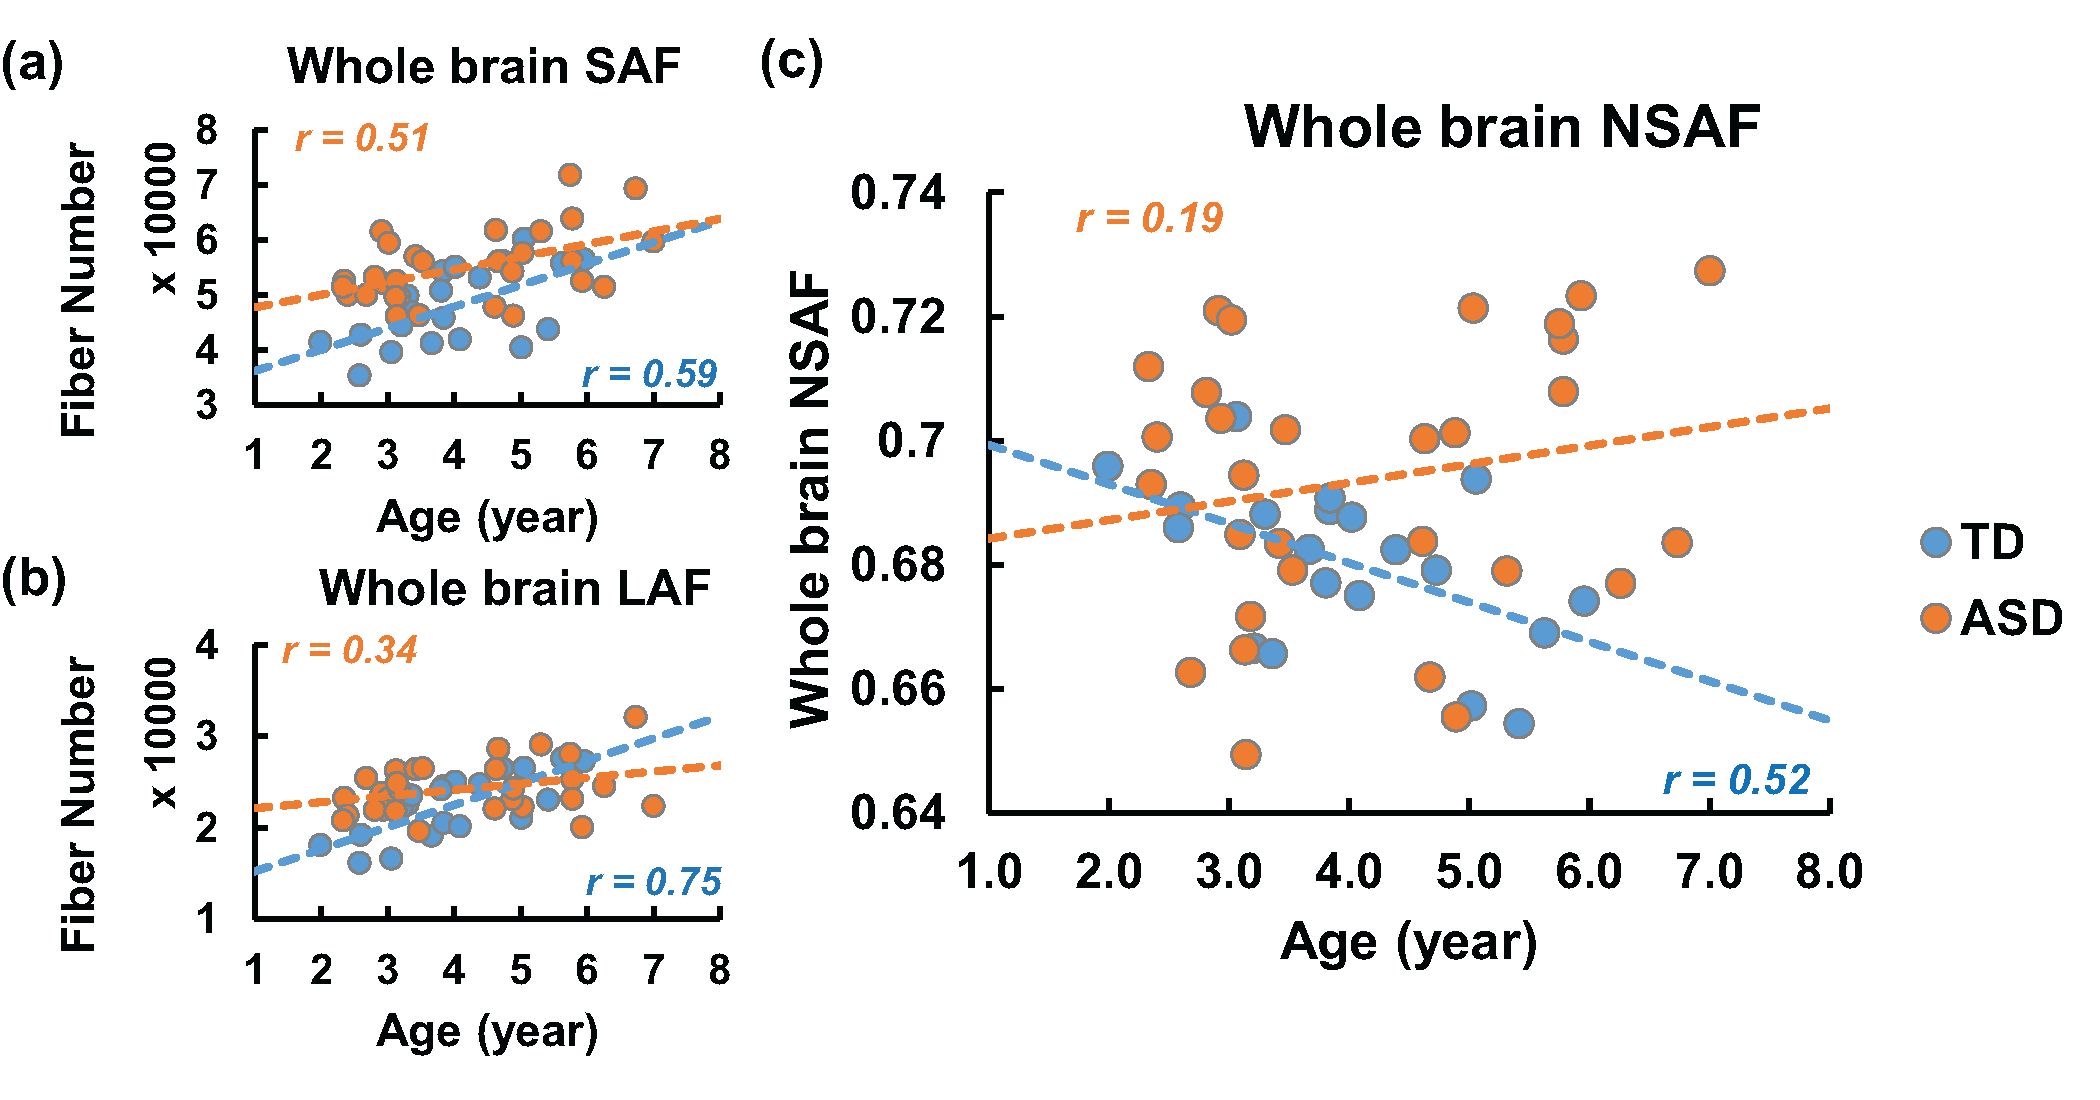
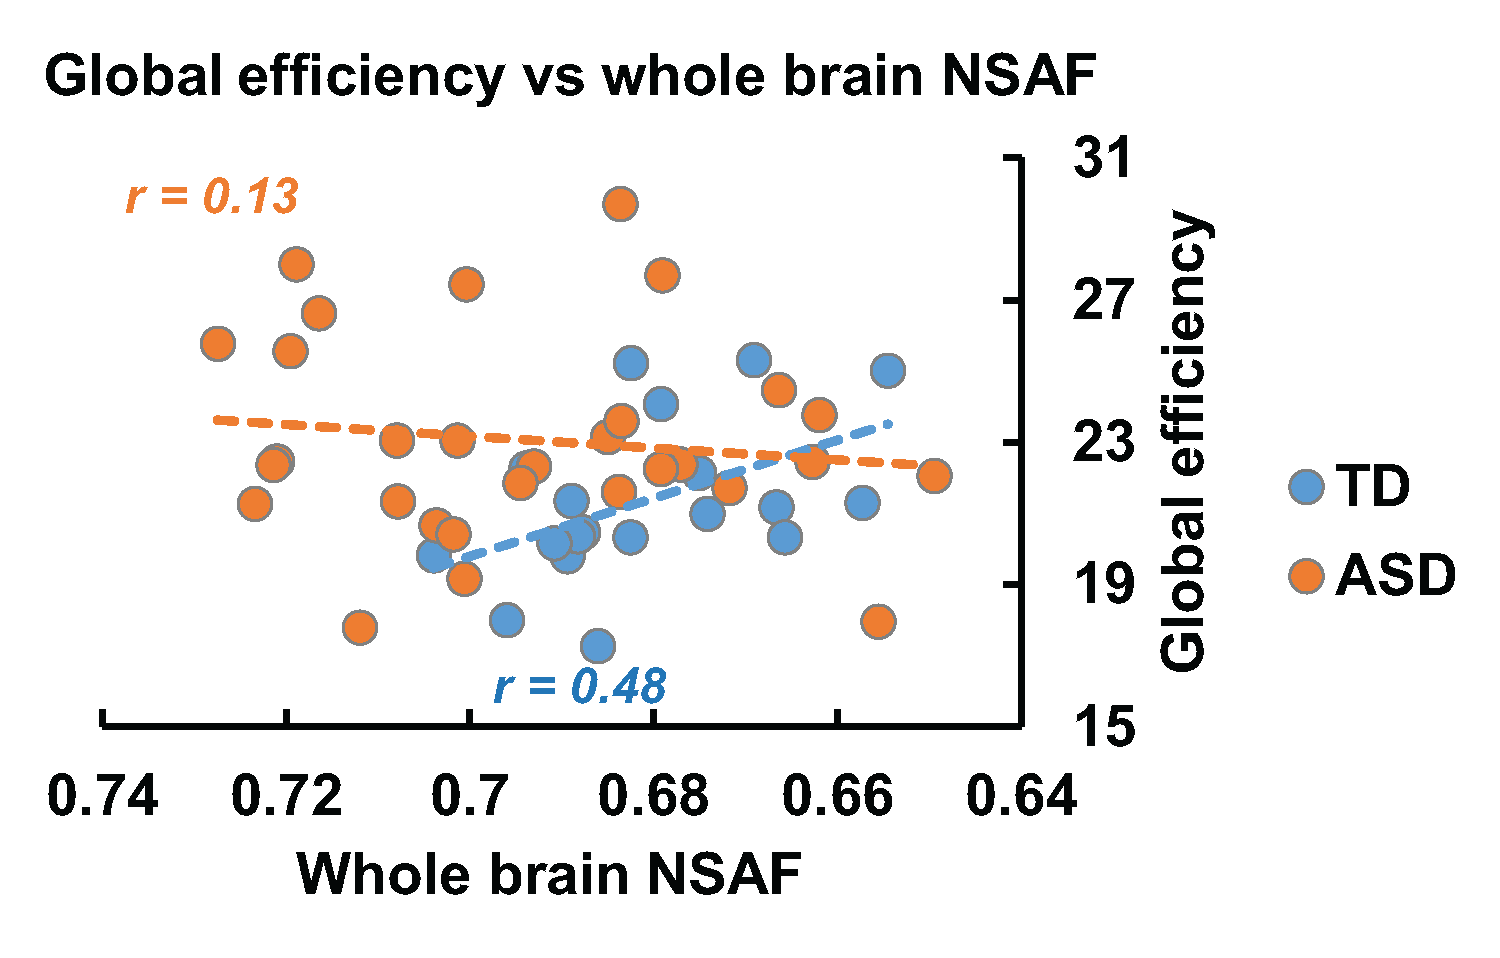
Fig 2 demonstrates the developmental curve of whole brain fiber numbers of SAF and LAF as well as whole brain NSAF in ASD and TD groups. Absolute fiber numbers of whole brain SAF and LAF significantly increase with age in both groups (p < 0.05, Fig 2a-2b). All subjects’ whole brain NSAF values are larger than 0.5, indicating the number of SAF is more than half of the whole brain cortico-cortical fiber number. Whereas the whole brain NSAF value significantly decreased from 2-7 years of age in the TD group (p=0.018), the whole brain NSAF value in ASD showed no association with age (p=0.48, Fig 2c). Similarly, whereas a significant negative correlation (p=0.03) was observed between whole brain NSAF and global efficiency in the TD group, no correlation was found in the ASD group (p=0.78), shown in Fig 3.
Discussion and conclusion
SAFs comprise the majority of the cortico-cortical WM fibers in the human brain. To explore its role in reshaping the brain network, a metric NSAF was defined and measured as the ratio of SAF in the entire brain cortico-cortical connectivity fibers. In typical development, whole brain NSAF was observed to decrease during early childhood, and significantly correlated with increase in network efficiency. Specifically, in older TD children, lower whole brain NSAF was associated with less SAFs, showing higher global network efficiency in these children. However, an atypical whole brain NSAF trajectory was found in the children aged 2-7 years with ASD, and no significant association was found between NSAF and network efficiency in these children. The analysis of the relationship between NSAF and regional network properties is under way.Acknowledgements
This study is funded by NIH MH092535, MH092535-S1, HD086984 and MH107506.References
[1] Schüz and Braitenberg (2002) Cortical Areas: Unity and
Diversity, 377. [2] Lebel et al (2012) Neuroimage 60:340.
[3] Wakana et al (2007) Neuroimage 36:630. [4] Ouyang et al (2016) ISMRM, Singapore, 560. [5]Gong
et al (2008) Cerebral Cortex 19:524. [6]Sepulcre et al (2010) PloS Comput Biol
6: e1000808. [7]Paus et al (2008) Nature Rev Neurosci 9:947. [8]
Courchesne and Pierce (2005) Curr Opin Neurobiol 15:225. [9] Desikan et al (2006) Neuroimage 31:968. [10]
Reveley et al (2015) Proc Natl Acad Sci USA 112:E2802. [11] Mori et al (1999) Ann Neurol 45:265.
Figures