0806
Quantitative assessment of the fetal brain myelination in vivo using fast macromolecular proton fraction mapping1Medical Diagnostics, International Tomography Center of the Siberian Branch of the Russian Academy of Sciences, Novosibirsk, Russian Federation, 2International Tomography Center of the Siberian Branch of the Russian Academy of Sciences, Novosibirsk, Russian Federation, 3Radiology, University of Washington, Seattle, WA, United States, 4Tomsk State University, Tomsk, Russian Federation
Synopsis
Macromolecular proton fraction (MPF) is a biophysical parameter describing cross-relaxation and closely correlated with myelin content in neural tissues. This study presents the first evaluation of the fast MPF mapping method in prenatal clinical neuroimaging and suggests that MPF in the fetal brain structures is sensitive to the earliest stages of myelin development.
Purpose:
Macromolecular proton fraction (MPF) is a biophysical parameter describing the amount of macromolecular protons in tissues involved into cross-relaxation with free water protons. Animal studies have demonstrated the utility of MPF as a quantitative biomarker of myelin1-5. A fast method allowing whole-brain MPF mapping based on a single MT-weighted image was recently developed6. This approach showed promising clinical results in adult brain studies7,8, as well as allowed the development of an ultra-fast MPF mapping protocol for non-brain applications9. In utero brain development is a promising area of MPF applications, where this method may help in identifying earliest brain tissue changes associated with myelin growth. The objective of this study was to develop a fast clinically targeted technique for MPF mapping of the fetal brain in vivo and test its capability to characterize prenatal brain myelination.Methods:
Participants: The study population included 28 pregnant women (mean gestational age ± standard deviation (SD): 27.6 ± 5.8 weeks, range 18-38 weeks) referred to fetal MRI for clinical indications. Patients were consecutively recruited between December 2015 and October 2016. An MPF mapping protocol was performed at the end of clinical MRI and took 5-6 minutes. Data from six patients were excluded due to severe structural brain malformations (three cases) and unacceptable image quality (three cases).
MRI Protocol: MRI data acquisition was performed on a 1.5 Tesla Philips Achieva scanner with an 8-channel phased-array body coil. A fast 3D MPF mapping protocol was implemented using standard manufacturer’s sequences and included the following scans: dynamic magnetization transfer (MT) spoiled gradient echo (GRE) with sequentially acquired MT-weighted and reference scans (TR/TE=32/6.3 ms, flip angle (FA)=8°, scan time 38 s); T1-weighted spoiled GRE (TR/TE=20/6.3 ms, FA= 20°, scan time 12 s); and proton-density-weighted spoiled GRE (TR/TE=20/6.3 ms, FA= 4°, scan time 12 s). Off-resonance saturation was achieved by three-lobe sinc pulse with Gaussian apodization, offset frequency 1.1 kHz, effective saturation FA=1040°, and duration 15 ms. All images were acquired in the transverse plane with FOV = 250x250x60 mm3, actual voxel size of 1.5x1.5x5mm3 (interpolated to 0.8x0.8x2.5 mm3), two signal averages, and multi-shot echo-planar readout (acceleration factor 9). To minimize fetal motion problems, the above sequences were repeated in separate acquisition blocks four times followed by exclusion of motion-corrupted images (if present) and averaging the rest of data during post-processing.
Image processing and analysis: MPF maps were reconstructed using the single-point algorithm6. MPF values were manually measured in regions-of-interest placed in the following brain structures: brain stem, cerebellum, thalamus, and frontal, temporal, and occipital white matter (WM).
Statistical analysis: Distinctions in MPF between brain structures across a range of gestational ages were assessed using repeated measures analysis of covariance with gestational age as a covariate. Associations between MPF and gestational age were tested using Pearson’s correlation coefficient (r). Significance was defined as P<0.05 with Bonferroni correction for multiple comparisons.
Results:
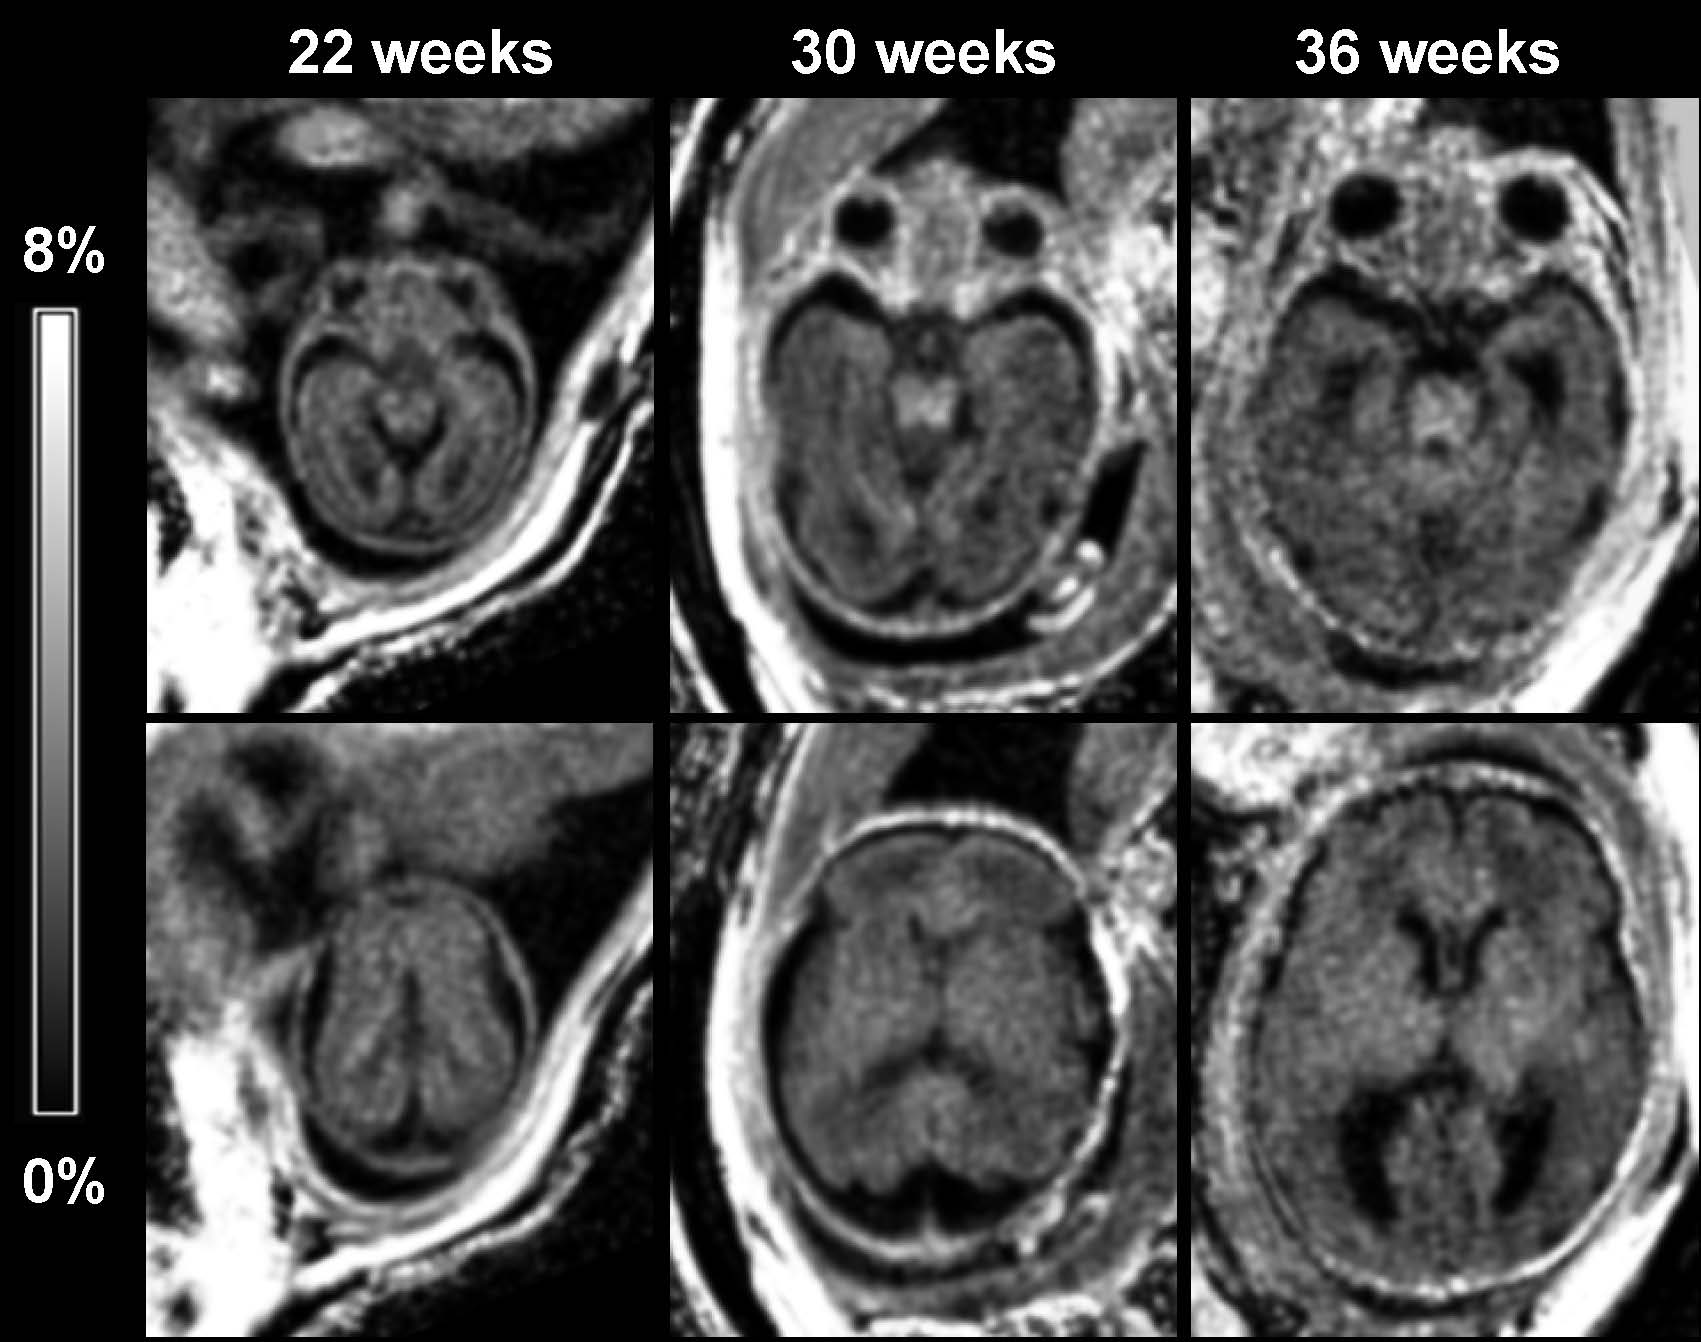
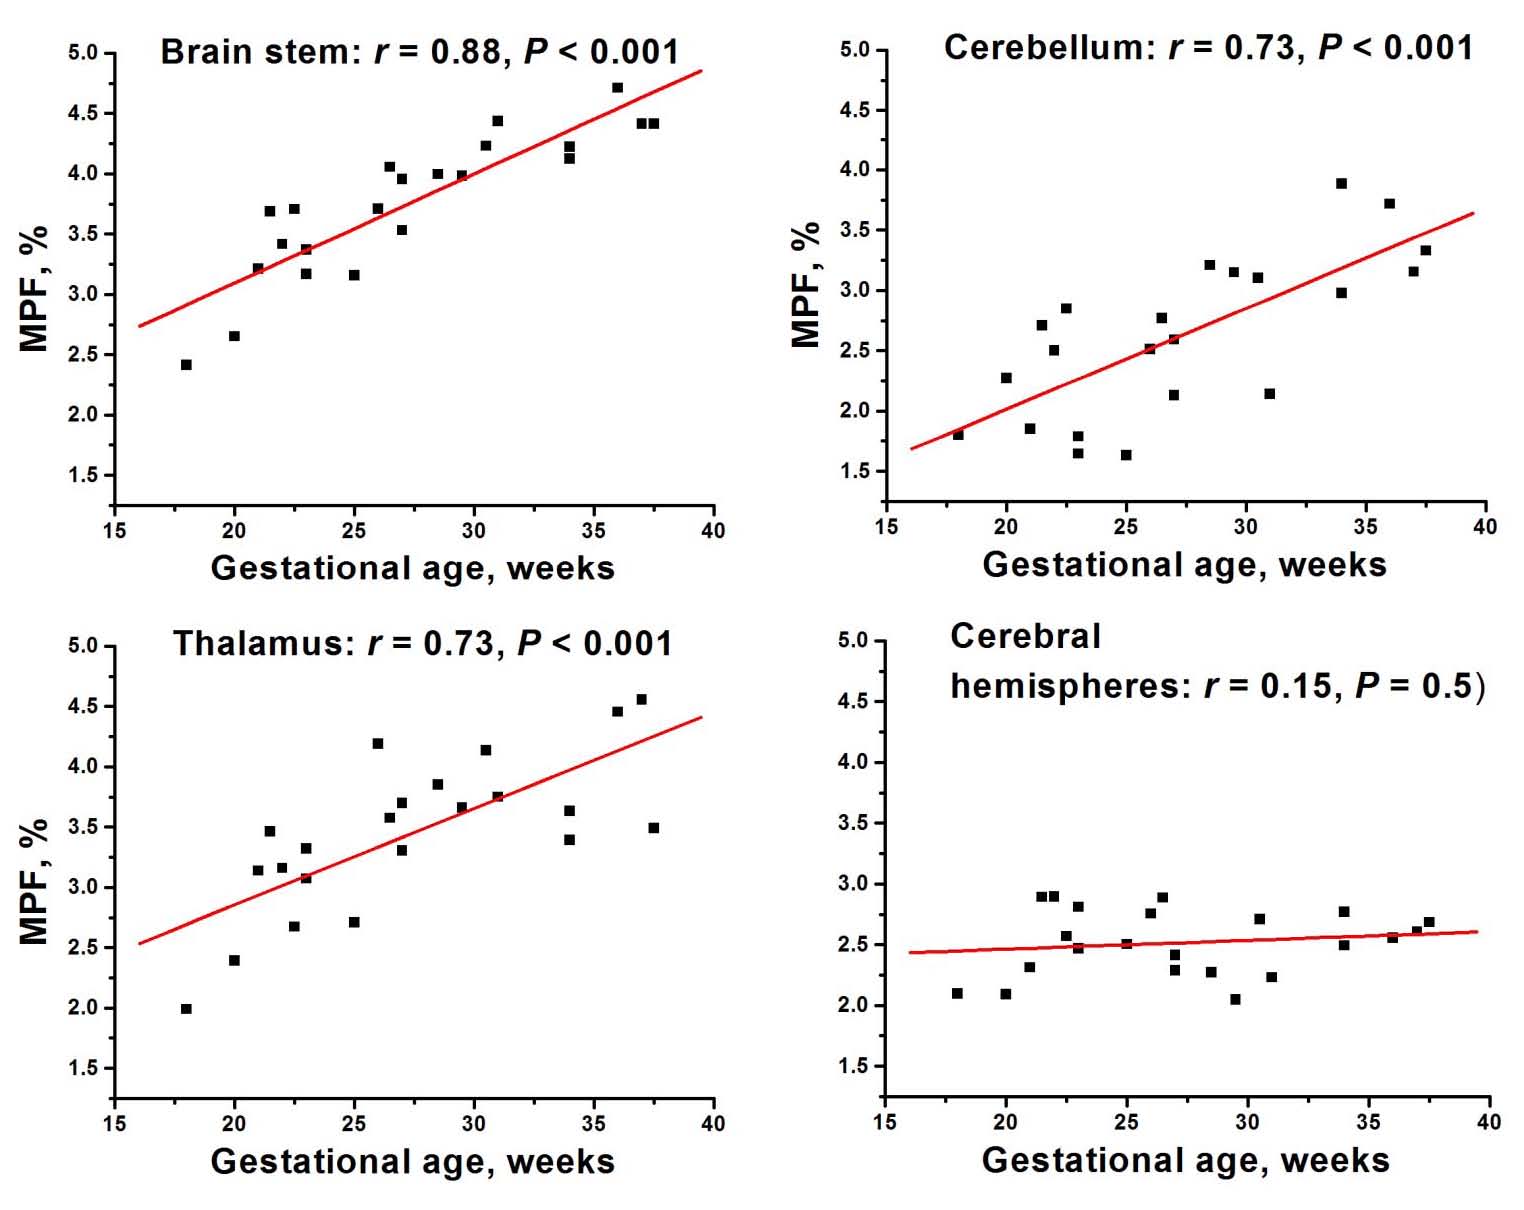
Example MPF maps of fetuses of different gestational ages are shown in Fig. 1. Overall, the maps depict minor variations in the brain with the most noticeable elevation of MPF in the brainstem in fetuses of older ages. Highly significant global effects of the brain structure (F=6.1, P<0.001) and interaction between structure and gestational age (F=12.7, P<0.001) were found. No significant distinctions were found between cerebral WM regions, and these data were averaged into a single variable. Mean MPF±SD in the fetal brain structures were as follows: brain stem: 3.8±0.6%, cerebellum: 2.6±0.7%, thalamus: 3.4±0.6%; and cerebral WM: 2.5±0.3%. Pairwise comparisons identified significant distinctions (P<0.005) between all structures except for MPF values in the cerebellum and cerebral WM. Significant (P<0.001) positive correlations with gestational age were identified for the brain stem, cerebellum, and thalamus, while no correlation was found for cerebral WM (Fig. 2).Discussion:
MPF values in the fetal brain appeared 4-6-fold lower compared to WM in the adult brain6-8 thus confirming that myelination provides the main determinant of MPF. The patterns of correlations between MPF and gestational age are in good agreement with the histological evidence of the myelination onset at the end of the first trimester and progression in the caudal to rostral direction in the central brain structures10. The absence of age-related MPF changes in cerebral WM is also concordant with its later (postnatal) myelination10.Conclusions:
This study demonstrated the feasibility of fast MPF mapping in the fetal brain in a clinical setting and confirmed the critical effect of myelination on MPF values. MPF in fetal brain structures is sensitive to the earliest stages of myelination and may be useful for characterization of normal and abnormal prenatal brain development.Acknowledgements
This study was supported by the Russian Science Foundation project #14-45-00040 for software and protocol development, Russian Science Foundation project #14-35-00020 for image analysis, and Federal Agency for Scientific Organizations of the Russian Federation project #0333-2014-0003 for data acquisition.References
1. Underhill HR, et al. Fast bound pool fraction imaging of the in vivo rat brain: Association with myelin content and validation in the C6 glioma model. Neuroimage. 2011;54:2052–2065.
2. Samsonov A, et al. Quantitative MR imaging of two-pool magnetization transfer model parameters in myelin mutant shaking pup. Neuroimage. 2012;62:1390–1398.
3. Thiessen JD, et al. Quantitative MRI and ultrastructural examination of the cuprizone mouse model of demyelination. NMR Biomed. 2013;26:1562–1581.
4. Janve VA, et al. The radial diffusivity and magnetization transfer pool size ratio are sensitive markers for demyelination in a rat model of type III multiple sclerosis (MS) lesions. Neuroimage. 2013;74:298–305.
5. Turati L, et al. In vivo quantitative magnetization transfer imaging correlates with histology during de- and remyelination in cuprizone-treated mice. NMR Biomed. 2015;28:327–337.
6. Yarnykh VL. Fast macromolecular proton fraction mapping from a single off-resonance magnetization transfer measurement. Magn Reson Med 2012;68:166-178.
7. Yarnykh VL, et al. Fast Whole-Brain Three-dimensional Macromolecular Proton Fraction Mapping in Multiple Sclerosis. Radiology 2015;274:210-220.
8. Petrie EC, et al. Neuroimaging, Behavioral, and Psychological Sequelae of Repetitive Combined Blast/Impact Mild Traumatic Brain Injury in Iraq and Afghanistan War Veterans. J Neurotrauma 2014;31:425-436.
9. Yarnykh VL, et al. Fast macromolecular proton fraction mapping of the human liver in vivo for quantitative assessment of hepatic fibrosis. NMR Biomed 2015;28(12):1716-1725.
10. Rorke-Adams L, et al. Central Nervous System. Development. In: Potter's Pathology of the Fetus, Infant, and Child, Gilbert-Barness E, Ed., 2007. Philadelphia, United States: Mosby Elsevier; Vol. 2, p. 1959-1977.
Figures