0804
In Vivo Magnetic Resonance Elastography of Abdominal Aortic Aneurysm in A Porcine Model1Department of Radiology, The Ohio State University Wexner Medical Center, Columbus, OH, United States, 2Department of Biomedical Engineering, The Ohio State University, Columbus, OH, United States, 3Dorthy M. Davis Heart and Lung Research Institute Interventional Cardiology Cath Core Lab, The Ohio State University Wexner Medical Center, Columbus, OH, United States, 4Center for Biostatistics, The Ohio State University Wexner Medical Center, Columbus, OH, United States, 5Department of Internal Medicine-Cardiology, The Ohio State University Wexner Medical Center, Columbus, OH, United States, 6Department of Electrical and Computer Engineering, The Ohio State University, Columbus, OH, United States
Synopsis
Abdominal aortic aneurysm (AAA) can result in life-threatening aortic rupture. Although AAA diameter is utilized for assessing rupture risk clinically, it is a poor indicator of rupture potential. Aortic stiffness is an important biomechanical property that can provide critical information about the overall mechanical integrity of AAA and thus results in more accurate rupture risk evaluation.Therefore, the aim of this study is to utilize non-invasive in vivo MRE to estimate aortic stiffness in AAA-induced animal models, and compare it with the stiffness obtained from ex vivo mechanical testing as well as AAA diameters.
Purpose
Abdominal aortic aneurysm (AAA) is an abnormal vascular enlargement in the abdominal aorta which can lead to aortic rupture, making it one of the leading causes of death in the United States [1]. Clinically, AAA diameter is utilized as gold standard for assessing rupture risk: AAAs with diameter >5.5 cm are considered high-risk, indicating the need for endovascular or surgical repair. However, several studies have shown that small AAAs (<5.5 cm) also rupture while large ones (>5.5 cm) may remain stable, suggesting that diameter is a poor indicator of rupture potential [2-4]. Aortic stiffness is an important biomechanical property that is able to provide critical information about (1) overall mechanical integrity of AAA, (2) aortic wall microstructure and (3) extracellular matrix (ECM) remodeling process, and thus potentially provides more accurate rupture risk evaluation [5-7]. However, conventional mechanical testing is invasive and clinically impractical. On the other hand, the established pulse wave velocity (PWV) based aortic stiffness measurements only provide a global stiffness estimation without crucial spatial information [8]. Magnetic resonance elastography (MRE) is a novel non-invasive phase-contrast MR imaging technique by which the shear stiffness of soft tissues can be spatially estimated. Non-invasive in vivo MRE of AAA has not yet been performed and validated in animal models. Therefore, the aim of this study is to use in vivo MRE to estimate the aortic stiffness in AAA-induced porcine model, and compare it with the stiffness obtained from mechanical testing as well as the diameter of AAAs.Methods
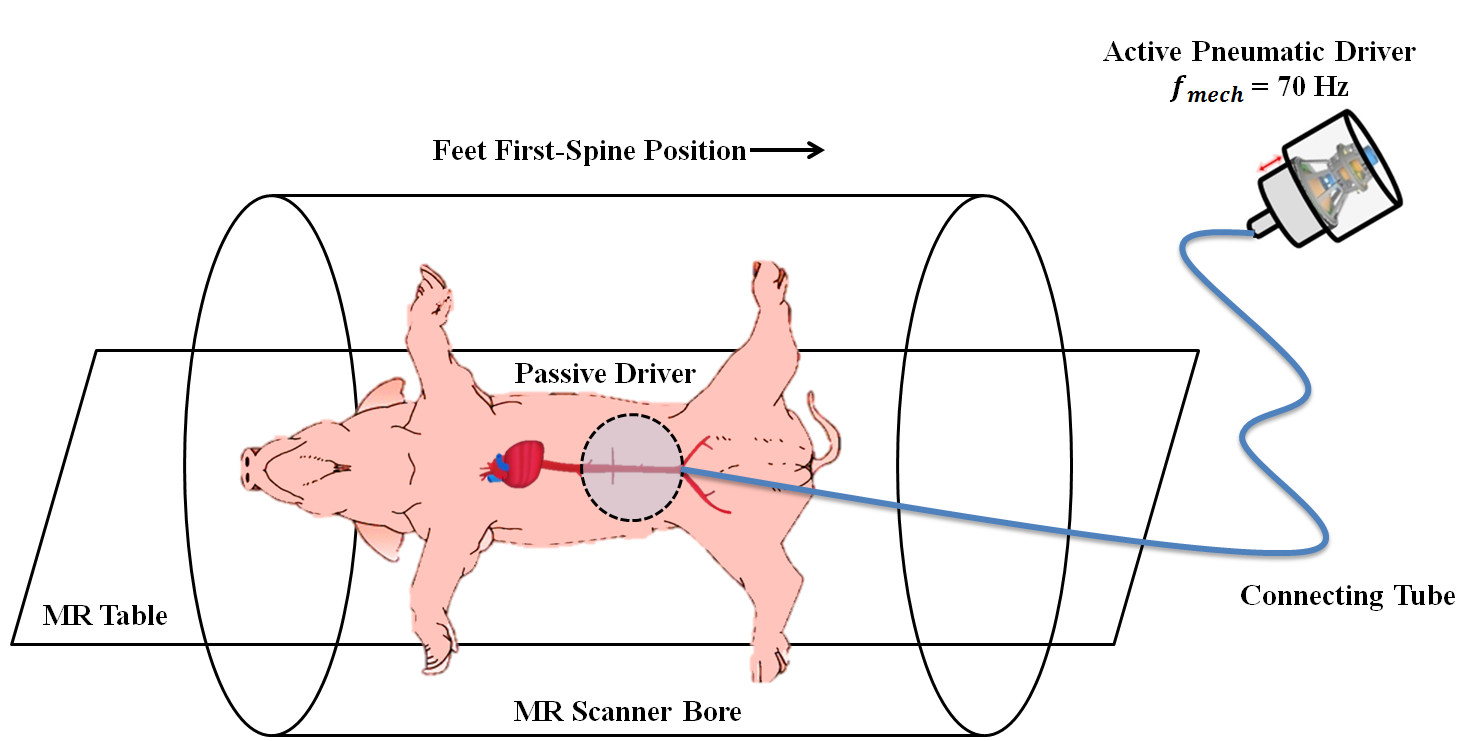
AAA was induced via an endovascular procedure in 10 Yorkshire pigs using elastase and calcium chloride after mechanically stretching the abdominal aortic wall. All animals were sacrificed 4 weeks post surgery and aorta specimens were harvested for mechanical test. The animals were placed in feet first-spine position on the scanner table as demonstrated in Figure 1. MRE was performed prior to the surgery (baseline) and each week after the surgery (week 1 to week 4) on a 1.5T MRI scanner (Avanto, Siemens Healthcare, Erlangen, Germany). A retrospectively pulse-gated gradient echo MRE sequence with flow compensation was employed. Imaging parameters included: TE/TR=10.62/14.29 ms; FOV=400x400 mm2; slice thickness=6 mm; No. of slices=3; acquisition matrix size=128x64; mechanical frequency=70 Hz; MEG frequency=120 Hz; three-directional motion encoding; No. of phase offsets=4. Images were masked to extract normal aorta and AAA region. Subsequently, effective aortic stiffness was obtained using local frequency estimation (LFE). In advance to mechanical testing, specimens were prepared and dimensions were measured. The specimens were then secured in cryogrips. Uniaxial tension test was performed at a stretching rate of 10 mm/min until specimen failure. Consequently, peak load, stress, and stiffness were obtained.Results and Discussion
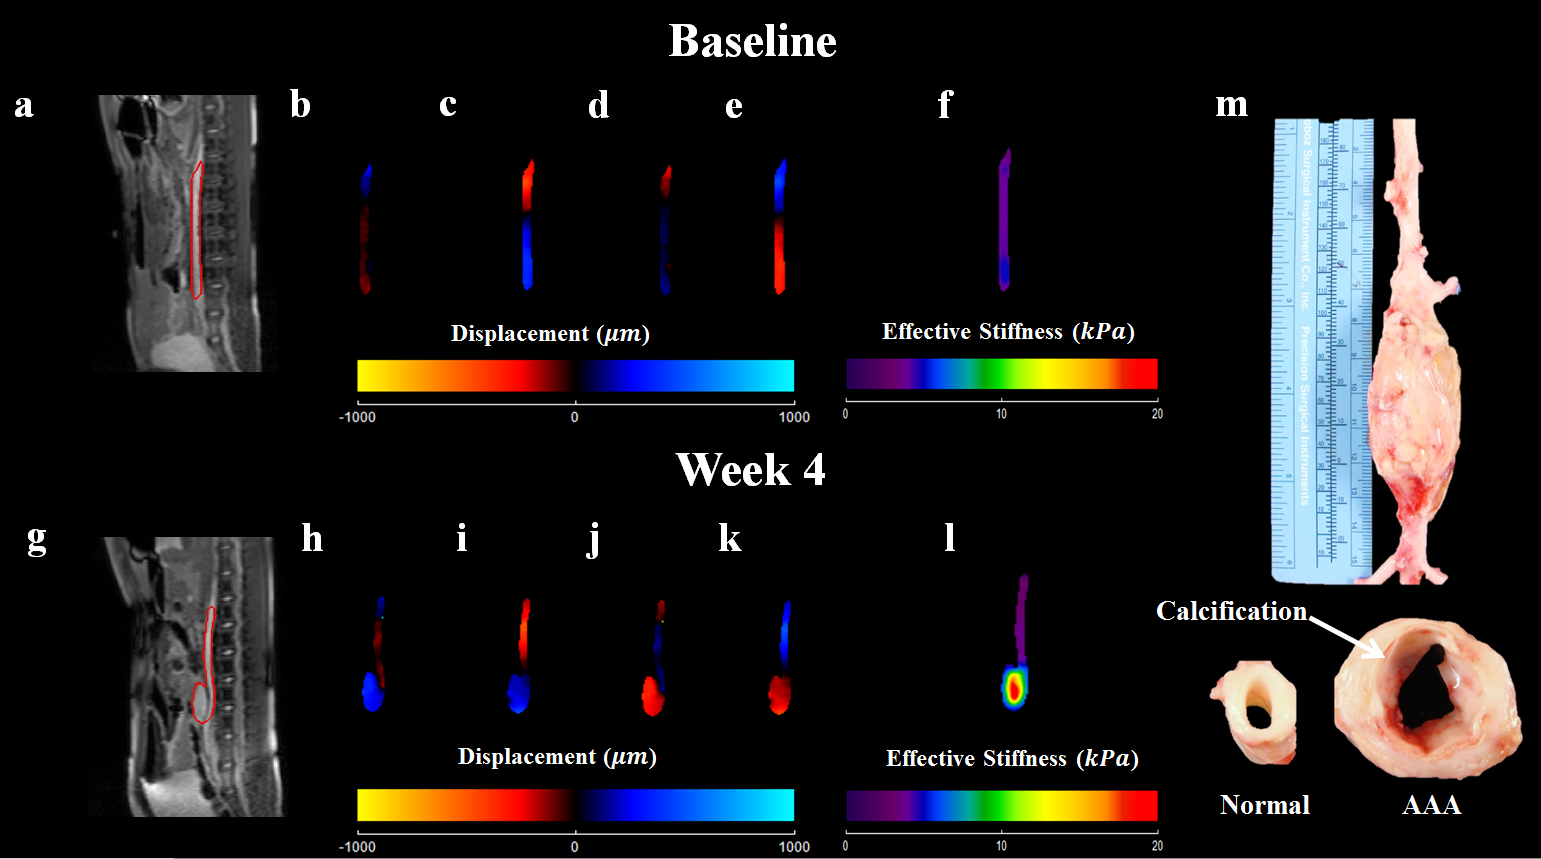
Both AAA development and stiffness increase can be clearly observed at week 4. Figure 2 demonstrates magnitude, wave images, corresponding MRE-derived aortic stiffness maps and harvested AAA specimen of the same animal at baseline and week 4. Aortic wall thickening and calcification can be observed in the specimen.
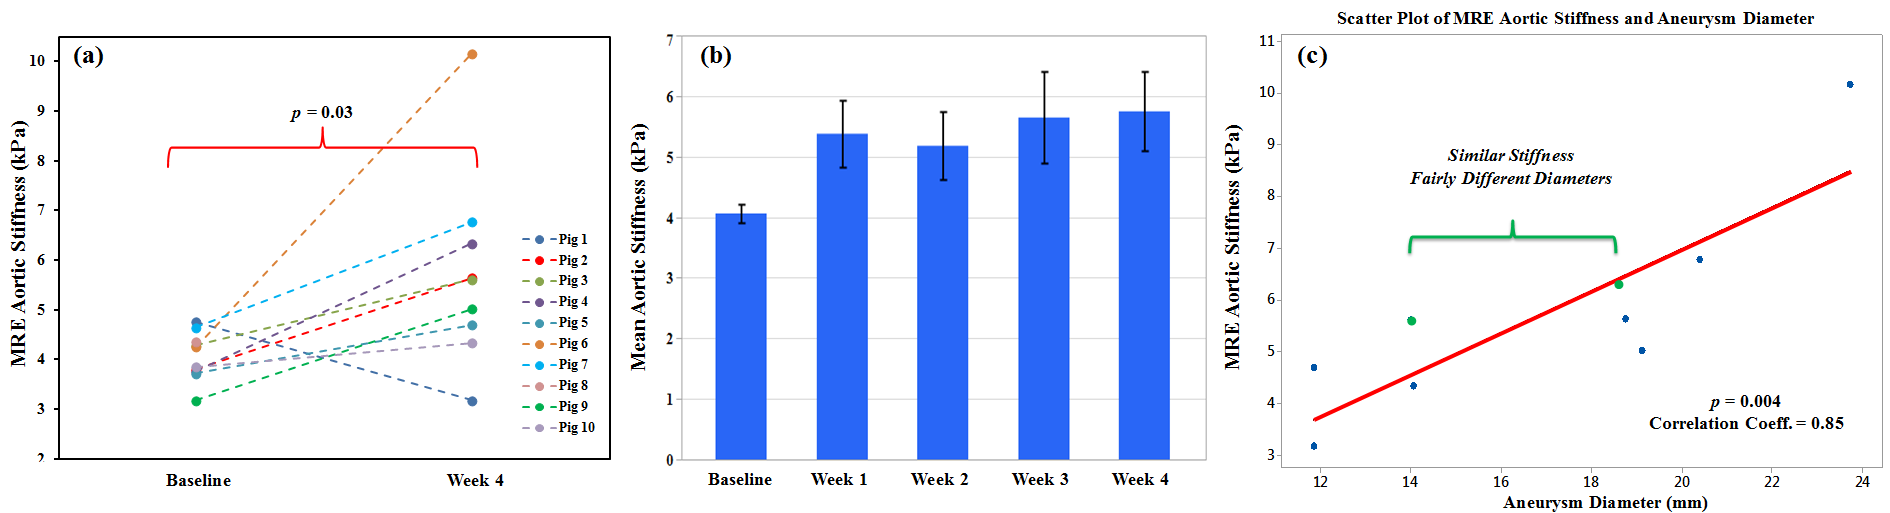
Aortic stiffness has significantly increased as AAA progresses. Figure 3a displays the aortic wall stiffness at baseline and week 4, showing AAA stiffness is significantly (p=0.03) higher than the normal aorta. Mean aortic stiffness by pooling all animals at baseline and week 4 is 4.06±0.48 kPa and 5.75±1.97 kPa, respectively. Figure 3b demonstrates the mean aortic stiffness at each week. Elastin degradation and collagen increase induced by AAA resulted in compliance reduction in aortic wall which contributed to the observed wall thickening and stiffness elevation at week 4 in this study [9]. Moderate correlation was observed between the MRE-derived aortic stiffness and aneurysm diameters in Figure 3c (p=0.004; correlation coeff.=0.85).
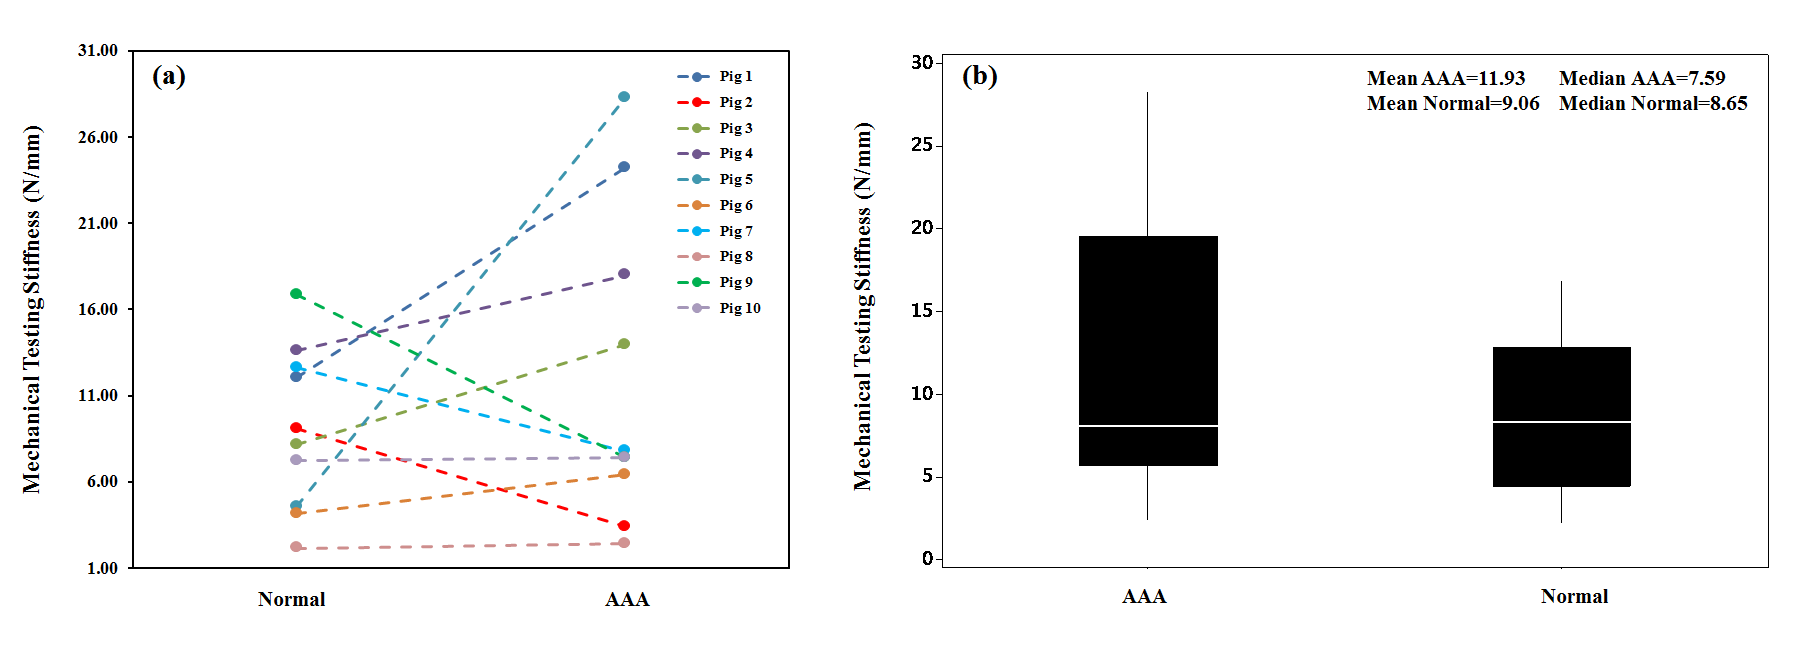
The mean AAA specimen stiffness obtained from mechanical testing is higher than the mean normal aorta specimen stiffness (See Figure 4). Similar trend was observed in MRE-measured aortic stiffness.
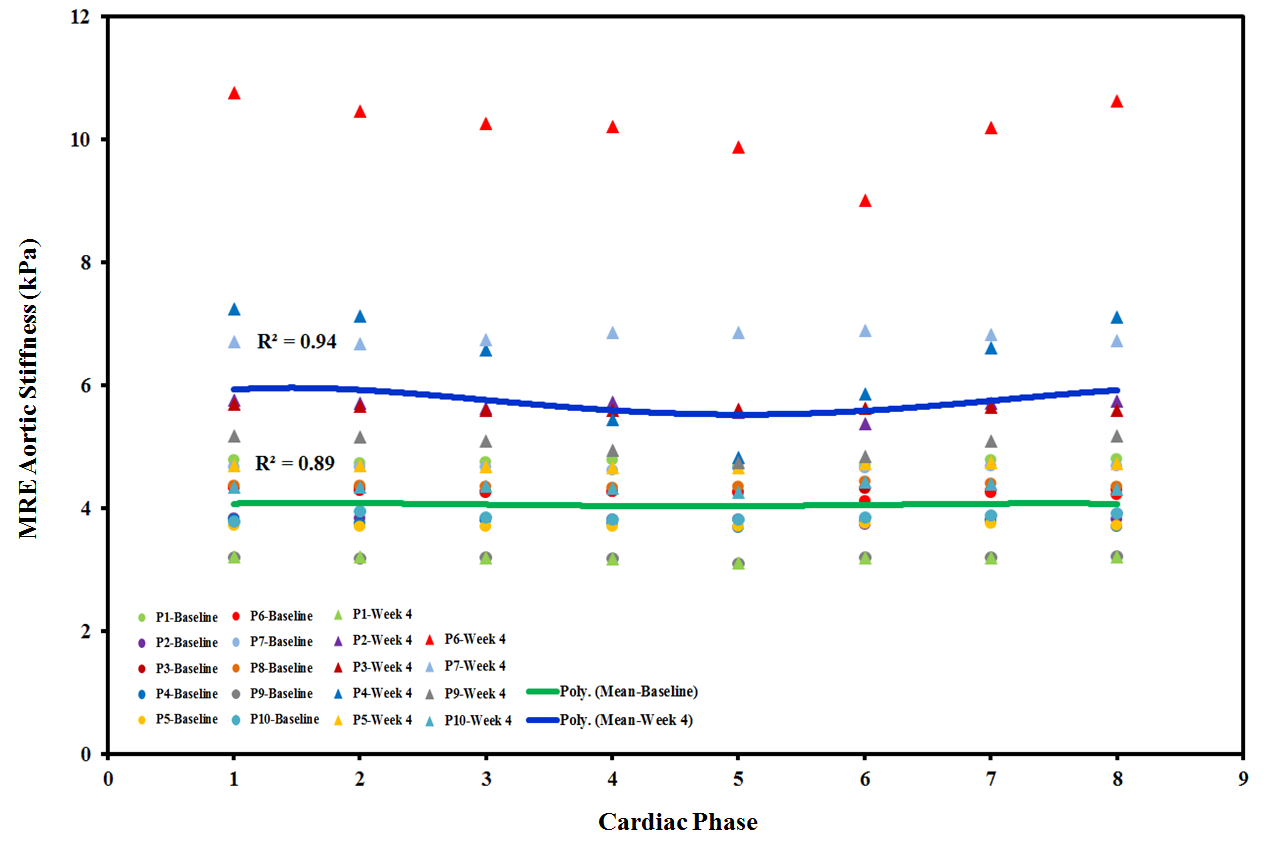
MRE-derived aortic stiffness varied cyclically across the whole cardiac cycle. Figure 5 shows the polynomial function used to fit the mean stiffness of all animals across one cardiac cycle with a goodness of fit of R2=0.89 for baseline and R2=0.94 for week 4. The polynomial curves demonstrates that mean aortic stiffness increased from baseline (green curve) to week 4 (blue curve) across the entire cardiac cycle. The observed stiffness variation pattern can be explained by the cyclic fluctuation of central aortic blood pressure within a cardiac cycle [10,11].
Conclusion
This study demonstrated that aortic stiffness measured from MRE and mechanical testing increased with the progression of AAA in a porcine model, suggesting the potential of using MRE for understanding the physiology of AAA and accurate rupture risk assessment.Acknowledgements
The authors particularly acknowledge Brian Raterman BSRT (MR), Department of Radiology, The Ohio State University Wexner Medical Center, for his help in this study.
References
[1] Kuivaniemi H, Platsoucas CD, Tilson 3rd MD. Aortic aneurysms: an immune disease with a strong genetic component. Circulation 2008;117(2):242-252.
[2] Brewster DC, Cronenwett JL, Hallett JW Jr, Johnston KW, Krupski WC, Matsumura JS. Guidelines for the treatment of abdominal aortic aneurysms. Report of a subcommittee of the Joint Council of the American Association for Vascular Surgery and Society for Vascular Surgery. J Vasc Surg 2003;37:1106-17.
[3] Nicholls SC, Gardner JB, Meissner MH, Johansen HK. Rupture in small abdominal aortic aneurysms. J Vasc Surg 1998;28:884-8.
[4] Lederle FA, Wilson SE, Johnson GR, Reinke DB, Littooy FN, Acher CW, et al. Immediate repair compared with surveillance of small abdominal aortic aneurysms. N Engl J Med 2002;346:1437-44.
[5] Kolipaka A, Illapani VS, Kenyhercz W, Dowell JD, Go MR, Starr JE, Vaccaro PS, White RD. Quantification of abdominal aortic aneurysm stiffness using magnetic resonance elastography and its comparison to aneurysm diameter. J Vasc Surg 2016.
[6] Raghavan ML, Webster MW, Vorp DA. Ex vivo biomechanical behavior of abdominal aortic aneurysm: assessment using a new mathematical model. Ann Biomed Eng 1996;24:573-82.
[7] Vorp DA, Vande Geest JP. Biomechanical determinants of abdominal aortic aneurysm rupture. Arterioscler Thromb Vasc Biol 2005;25:1558-66.
[8] Kenyhercz WE, Raterman B, Illapani VS, Dowell J, Mo X, White RD, Kolipaka A. Quantification of aortic stiffness using magnetic resonance elastography: Measurement reproducibility, pulse wave velocity comparison, changes over cardiac cycle, and relationship with age. Magn Reson Med 2016;75(5):1920-1926.
[9] Rizzo RJ, McCarthy WJ, Dixit SN, Lilly MP, Shively VP, Flinn WR, et al. Collagen types and matrix protein content in human abdominal aortic aneurysms. J Vasc Surg 1989;10:365-73.
[10] Stewart AD, Jiang B, Millasseau SC, Ritter JM, Chowienczyk PJ. Acute reduction of blood pressure by nitroglycerin does not normalize large artery stiffness in essential hypertension. Hypertension 2006;48(3):404-410.
[11] Histand MB, Anliker M. Influence of flow and pressure on wave propagation in the canine aorta. Circ Res 1973;32(4):524-529.
Figures