0801
Automatically Identify Plaque Components in Carotid Artery using Simultaneous Non-Contrast Angiography and intraPlaque hemorrhage (SNAP) imaging1Center for Biomedical Imaging Research, Department of Biomedical Engineering, School of Medicine, Tsinghua University, Beijing, People's Republic of China, 2Department of Radiology, University of Washington
Synopsis
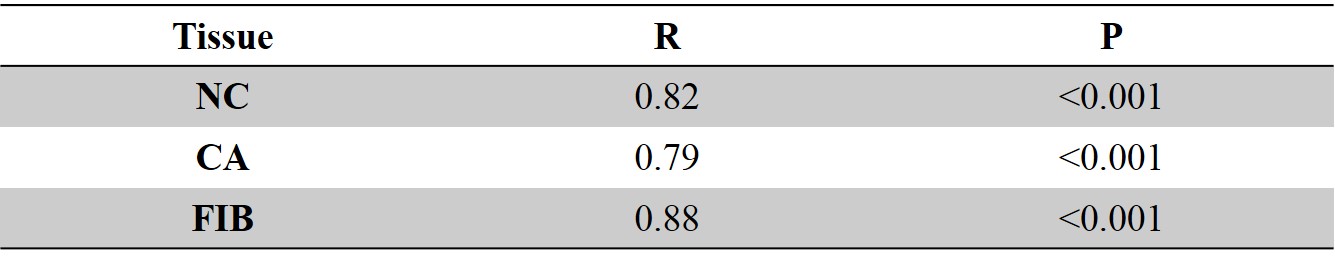
The purpose of this study is to develop an automatic method to identify plaque components using a single 3D Simultaneous Non-Contrast Angiography and intraPlaque hemorrhage (SNAP) acquisition. Using artifact neural network classifier with the intensities of multiple images generated from SNAP and the morphology information, the automatic identified components area has a high correlation with manual segmentation on 2D multi-contrast MR images: 0.82 (necrotic core), 0.79 (calcification) and 0.88 (fibrous tissue). This study further enhanced ability of 3D SNAP sequence in plaque components identification, suggesting SNAP would be a practical clinical solution for carotid atherosclerotic plaque evaluation.
Introduction:
Atherosclerosis is a major cause of mortality and morbidity worldwide [1]. Plaque components imaged by multi-contrast MRI [2] were considered to be important indicators for ischemic events [3] in addition to luminal stenosis However, current 2D multi-contrast imaging technique suffers from small coverage, long scan time and complex post processing. Recently, a SNAP technique [4] has been propose, which can evaluate carotid plaque in a single scan, including detecting intraplaque hemorrhage (IPH) [4] and calcification (CA) [5]. However, previous studies all relied on manual review, which is time-consuming and highly dependent on the reviewers’ experience. Moreover, the ability of SNAP in detecting lipid rich/necrotic core (NC) has not been studied. Thus, this study aims to develop an automatic method to identify plaque components, including NC, CA and fibrous tissue (FIB) using SNAP images.Methods:
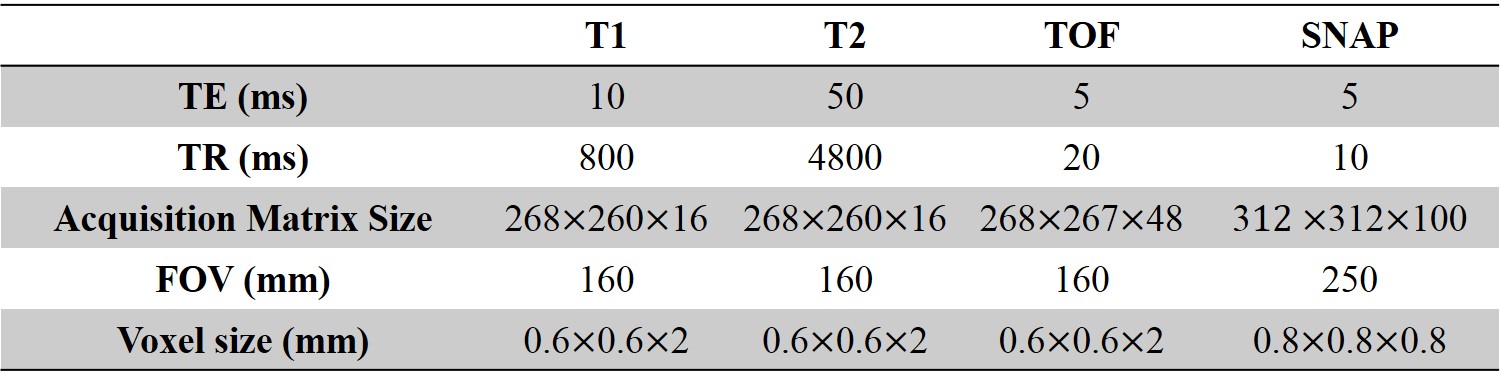
In this retrospective study, 68 patients (44 males, mean SD$$$\pm$$$age: 61.67$$$\pm$$$9.49 years) with carotid plaque were included. Imaging: All patients were scanned on a 3T Philips MR scanner using SNAP and traditional multi-contrast protocol [6], including TOF, T1W and, T2W. The scan parameters used were shown in Table 1. Image analysis: In 134 carotid arteries, the lumen, outer wall and plaque components (NC (including IPH) and CA) were delineated in the multi-contrast images by two experienced reviewers in consensus based on an established review protocol [6]. The rest part of vessel wall was considered as FIB. The SNAP sequence consists of an inversion pulse followed by two fast field echo (FFE) acquisitions: an inversion recovery acquisition (IR) and a reference acquisition (REF). From these two acquisitions, phase-corrected images (CR) can be calculated by phase-sensitive reconstruction. In this study, we chose the magnitude of IR, the real part of IR, the imaginary part of IR, the magnitude of REF, CR, and calculated SNAP2 [7] as the main features for plaque components segmentation. The flowchart of SNAP image analysis was shown in Fig. 1. The SNAP images were reformatted, and the lumen, outer wall, and components contours were mapped from multi-contrast to SNAP automatically allowing manual adjustment. Therefore, each pixel in SNAP image inside the vessel wall can be labeled as NC, CA or FIB. The slices that cannot be registered or having low image quality were excluded. All the accepted images were resampled to 0.3125mm in-plane resolution and smoothed by Gaussian filter. The intensity normalization was done based on an established method [8]. In this study, we used a 3 layer artifact neural network (ANN) to automatically classify each pixel with the previous described six features and the morphology features [9]. Finally, a level set method [10] was used to outline each components based on the ANN classification results. Leave-one-out cross validation was used to test the performance of the proposed segmentation method, where each carotid artery was used as the test set and others as the training set. Statistical analysis: The area of each plaque component generated by the proposed automatic method was compared with the manual results from multi-contrast images using correlation, and pixel-wise sensitive and specificity of the proposed method were reported.Result:
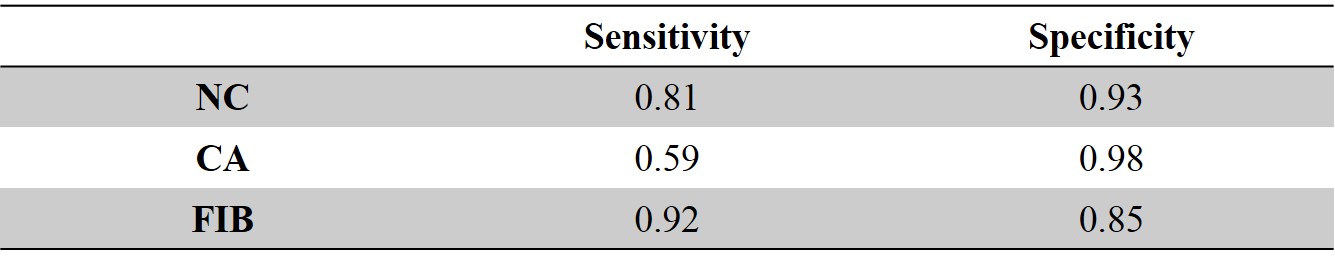
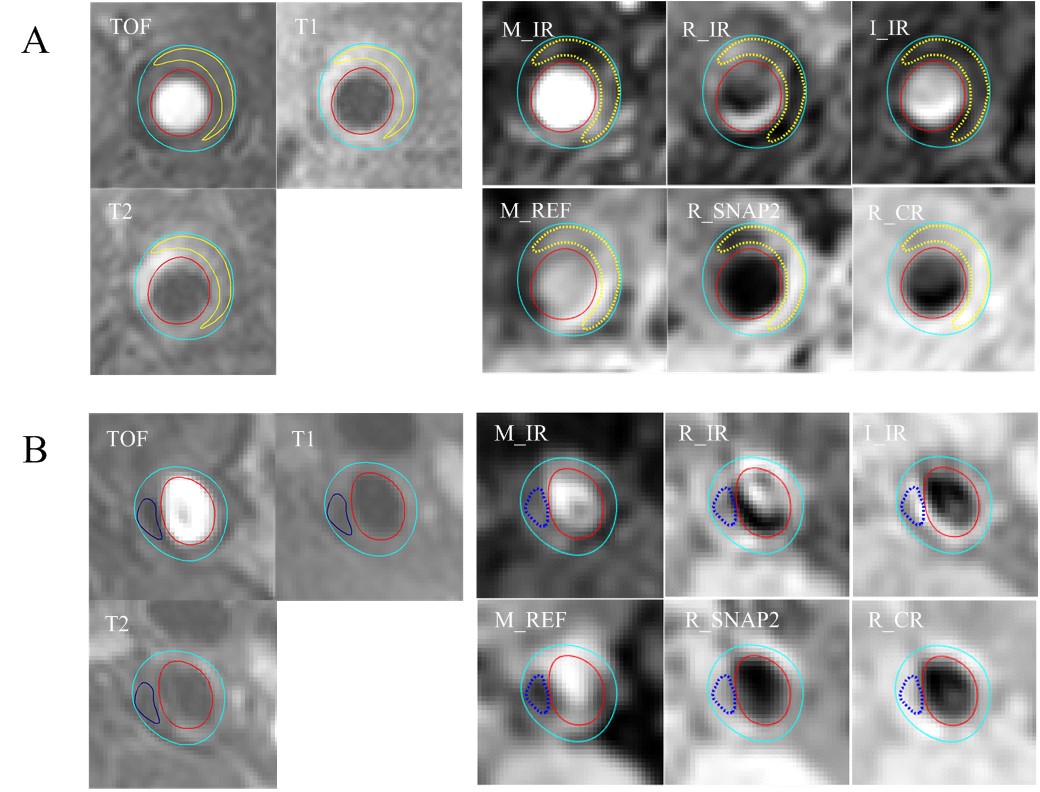
Finally, 1532 slices were included in this study, and 498804 pixels were used, consisting of 7626 CA pixels, 25704 NC pixels and 465474 FIB pixels. Fig. 2 shows examples of the NC and CA segmentation results generated by proposed automatic method using SNAP and the manually drawn results on multi-contrast images. The NC, CA and FIB areas of the automatic segmentation using SNAP were significantly correlated (All R values larger than 0.79) with that of the manual segmentation on multi-contrast images (Table 2). The pixel-wise sensitivity and specificity of the proposed segmentation of SNAP were shown in Table 3. The sensitivity and specificity of NC and FIB segmentation were high (all larger than 0.81). The CA segmentation of the proposed method has a moderate specificity (0.59) and a high sensitivity (0.98).Discussion:
In this study, the feasibility of using a single SNAP sequence to automatically segment the lipid rich/necrotic core, calcification and fibrous tissue has been validated. Combining the intensity of SNAP images and the morphology information, good segmentation performance can be achieved. Since SNAP has been proven applicable in assessing stenosis [4], identifying IPH [4] and CA [5], our study further proves its ability in NC identification. More importantly, all these plaque components can be segmented automatically using a single 5 min SNAP sequence with good accuracy and short processing time, making SNAP a practical clinical solution for carotid atherosclerotic plaque evaluation.Acknowledgements
No acknowledgement found.References
1. Kim, A.S. and S.C. Johnston, Global Variation in the Relative Burden of Stroke and Ischemic Heart Disease. Circulation, 2011. 124(3): p. 314-323.
2. Yuan, C., et al., In Vivo Accuracy of Multispectral Magnetic Resonance Imaging for Identifying Lipid-Rich Necrotic Cores and Intraplaque Hemorrhage in Advanced Human Carotid Plaques. Circulation, 2001. 104(17): p. 2051-2056.
3. Choi, Y.J., S.C. Jung, and D.H. Lee, Vessel Wall Imaging of the Intracranial and Cervical Carotid Arteries. Journal of Stroke, 2015. 17(3): p. 238-255.
4. Wang, J., et al., Simultaneous Non-contrast Angiography and intraPlaque hemorrhage (SNAP) imaging for carotid atherosclerotic disease evaluation. Magnetic resonance in medicine : official journal of the Society of Magnetic Resonance in Medicine / Society of Magnetic Resonance in Medicine, 2013. 69(2): p. 337-345.
5. Chen, S., et al., Carotid Atherosclerotic Plaque Surface Condition Evaluation Utilizing Simultaneous non-contrast Angiography and intraPlaque hemorrhage (SNAP) Sequence, in International Society for Magnetic Resonance in Medicine. 2015.
6. Saam, T., et al., Quantitative evaluation of carotid plaque composition by in vivo MRI. Arterioscler Thromb Vasc Biol, 2005. 25(1): p. 234-9.
7. Balu, N., et al., Measurement of Plaque Burden using 3D SNAP vessel wall MRI, in International Society for Magnetic Resonance in Medicine. 2014.
8. Liu, J., et al., Semi-automatic carotid intraplaque hemorrhage detection and quantification on Magnetization-Prepared Rapid Acquisition Gradient-Echo (MP-RAGE) with optimized threshold selection. Journal of Cardiovascular Magnetic Resonance, 2016. 18: p. 41.
9. Liu, F., et al., Automated in vivo segmentation of carotid plaque MRI with Morphology-Enhanced probability maps. Magn Reson Med, 2006. 55(3): p. 659-668.
10. Chunming, L., et al. Level set evolution without re-initialization: a new variational formulation. in 2005 IEEE Computer Society Conference on Computer Vision and Pattern Recognition (CVPR'05). 2005.
Figures