0800
Measuring Local Pulse Wave Velocity in the Carotid Arteries using a Compressed Sensing reconstruction for high temporal resolution (4 ms) 2D PC CINE MRI1Department of Radiology, Academic Medical Center, Amsterdam, Netherlands, 2Neurologie en Klinische Neurofysiologie, Academic Medical Center, Amsterdam, Netherlands, 3Imaging Clinical Applications and Platform, Philips Healthcare, Netherlands, 4Department of Biomedical Engineering & Physics, Academic Medical Center, Amsterdam, Netherlands
Synopsis
Measuring PWV with MRI would provide a useful tool to measure arterial stiffness locally. However, the limitation of MRI for this implementation is temporal resolution. This study validates a technique to measure local PWV at up to only 5 cm of the carotid arteries using 2D PC CINE MRI data of a high temporal resolution compressed sensing (CS) reconstruction. The method is validated using a pulsatile flow phantom and two groups of 10 elderly and 10 younger healthy volunteers. A significant difference between age groups was found.
Introduction
We developed a method to measure local pulse wave velocity (PWV) in the carotid arteries using compressed sensing (CS) for a high temporal resolution (4ms) reconstruction of 2D PC CINE MRI. The method was validated in a flow phantom, and in two groups of 10 elderly and 10 younger healthy volunteers.Methods
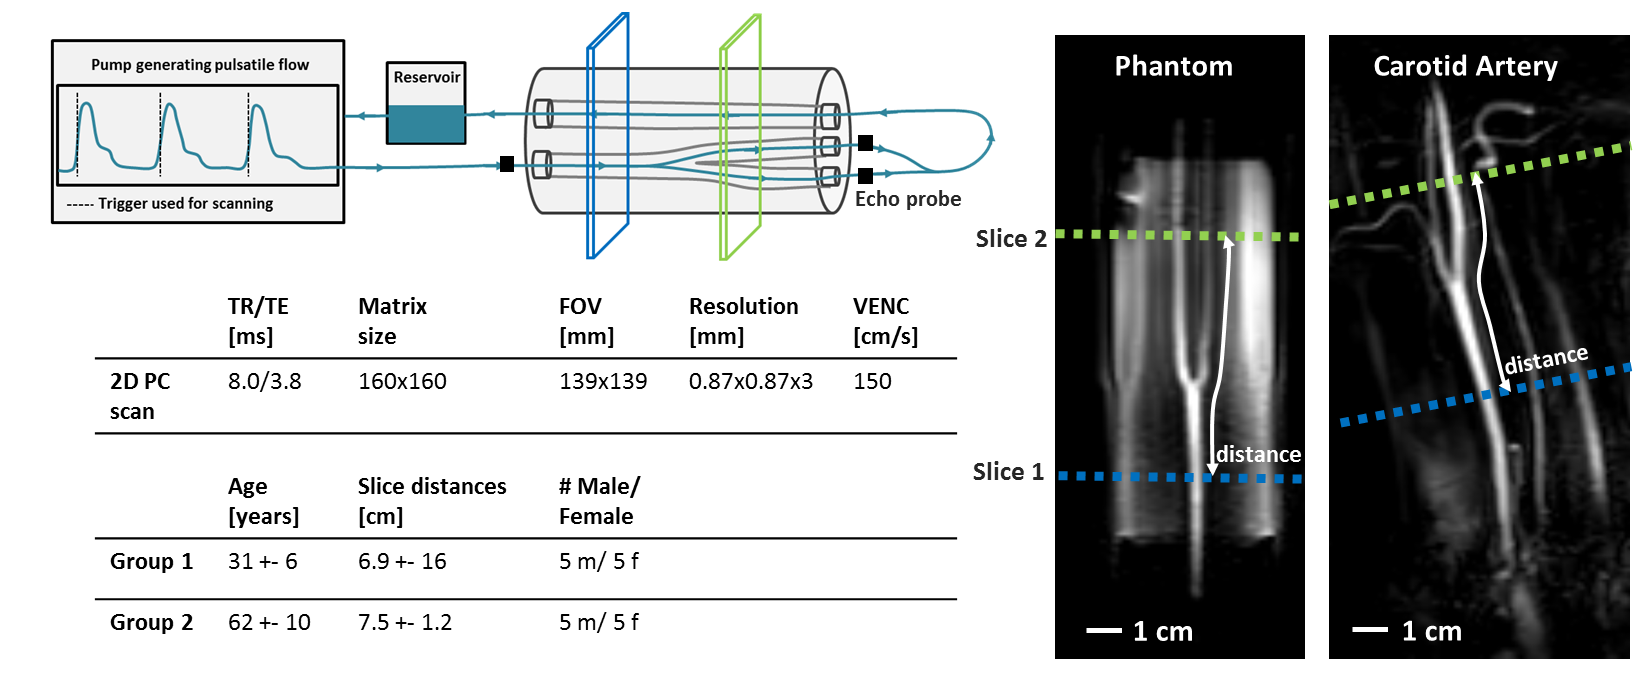
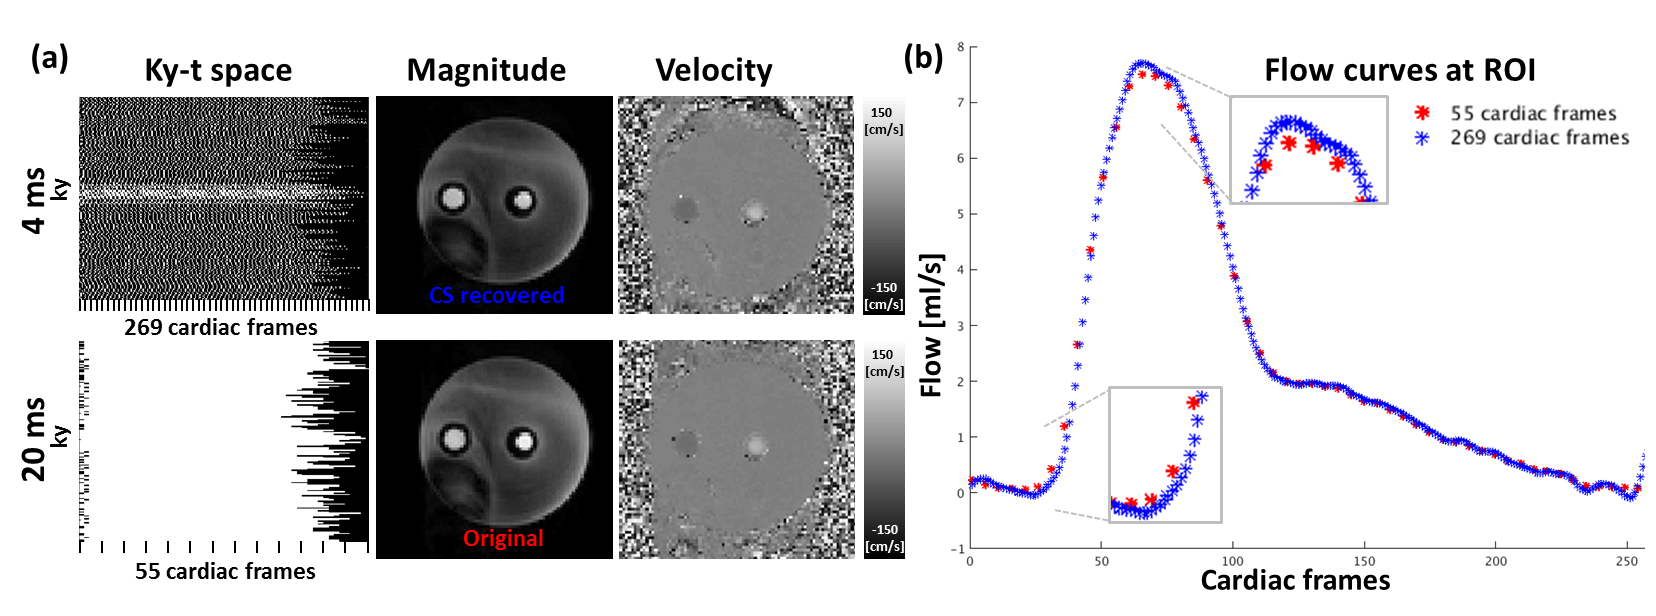
Sequence: 2D PC-MRI data was acquired with an 8-channel carotid coil with flow encoding in FH-direction (VENC 150 cm/s). Scans were acquired with a spatial resolution of 0.86x0.86x3 mm3 and TR/TE/FA = 8.0ms/3.9ms/8°. Retrospectively triggering was done using an ECG signal. For the flow phantom ECG was provided by an external trigger synchronized with the flow pump. To measure PWV, two slices perpendicular to the common carotid artery (CCA) and internal carotid artery (ICA) with an inter-slice distance of typically 7 cm were acquired (figure 1). Flow phantom: The flow phantom (LifeTec Group BV, The Netherlands), consisted of a silicon tube of 8 cm length, mimicking a human carotid bifurcation (figure 1). A pulsatile water flow was created at a heart rate of 60 beats/minute and a simulated heart rate variability of 10%. A temporal mean flow of 300 ml/min was created with a peak systolic flow rate of 1000 ml/min in the CCA. Flow was also measured with a gold standard ultrasound echo probe (UEP) before and after the phantom connections. In vivo scans: In-vivo scans were performed in 10 young (age = 31±6, 5 women) and 10 elderly (age = 62±10, 5 women) healthy volunteers. Reconstruction and PWV analysis: Raw data was processed using Matlab (MathWorks, USA) and MRecon (Gyrotools, Zürich). Data was retrospectively binned to cardiac frames of 4 ms, giving on average 250 frames/heartbeat. Note that the narrow temporal binning led to gaps in k-t space corresponding to an undersampling factor of 5 on average (figure 2a). CS reconstruction was performed using the BART toolbox1. A L1 regularization was performed under a total variation (TV) sparsifying transform over time with a regularization parameter of 0.2. PWV was calculated and compared for two methods, foot-to-foot (FF) and correlation, measuring the time difference between flow curves2,3. Additionally a normalization or a sigmoid fit was applied providing more information on the accuracy of the measured time shift (figure 3). The path length between the two slices were determined on 3D black-blood anatomical MR images using OsiriX4.Results
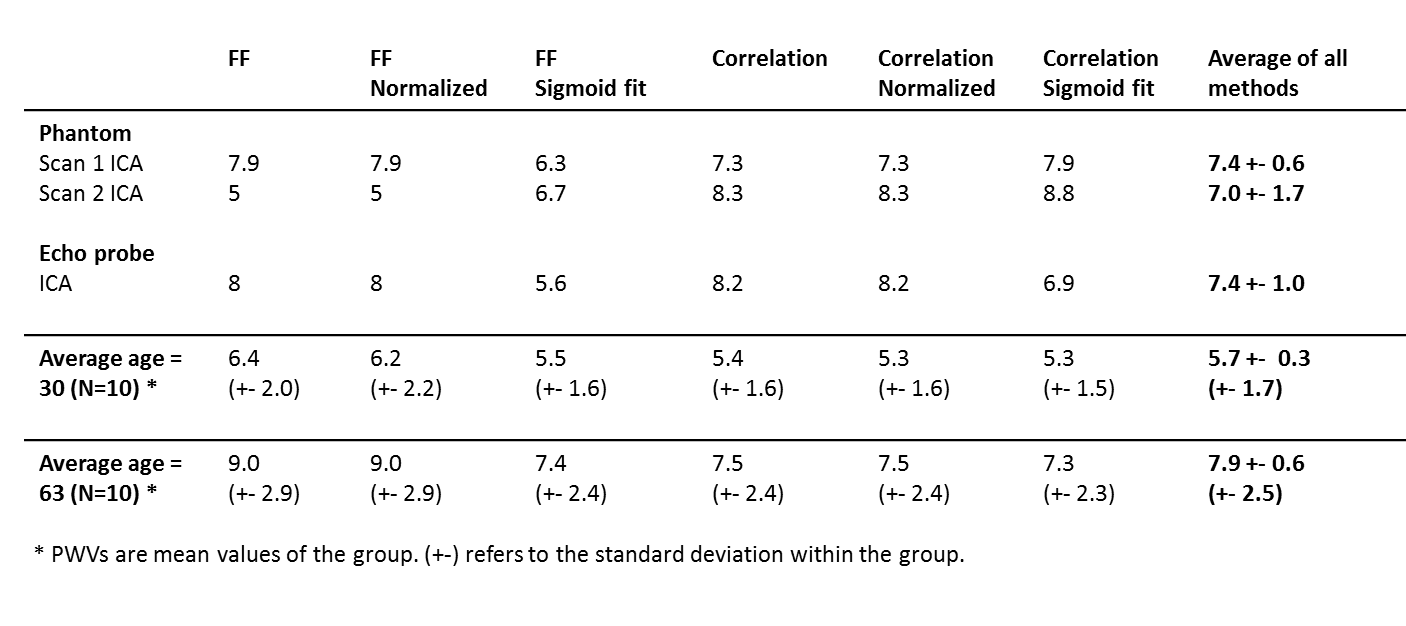
Figure 3 shows the mean flow in the phantom vessel region plotted over time, as well as the time shift measurements using foot-to-foot (a) and correlation methods (b). PWV in the pulsatile phantom was in good agreement with PWV measured with the UEP (figure 4). On average, local carotid PWVs for young (5.7±1.7 m/s) and elderly (7.9 ±1.5 m/s) healthy volunteers were significantly different (p=0.031). Comparing the results of each method independently all were significant, except for the FF method including a sigmoid fit (p=0.053).Discussion
For PWV, high temporal resolution is needed to resolve small time shifts that occur within a small vessel region. In order to measure flow with a temporal resolution of 4 ms, k-t space was undersampled randomly by exploiting heart rate variability5. Variable density sampling patterns were implemented to ensure sufficient center k-space filling for all reconstructed frames. For some methods (FF and FF normalized) we noticed that the UEP measurement could not be reliably reproduced in the phantom (figure 4). The idea was however to include all methods in the calculation of PWV to ensure they on average provide a stable result. We measured significantly higher PWV in the elderly volunteers than in the younger ones independent of the method. The standard deviation of measured PWVs in the elderly group was higher, which might reflect the more heterogeneous stiffening of the arteries with age. Average PWV values were in agreement with previously reported numbers (5.7 and 6.9 m/s6,7) determined from flow curves in aorta and carotids in subjects with similar age.Conclusion
In this study a high temporal resolution pulse wave velocity measurement method was presented, which enables PWV quantification in short vessel segments, such as locally in the carotid arteries. The feasibility of this technique was demonstrated in a flow phantom and in a comparison of two groups of elderly and younger healthy volunteers. Results are in line with similar studies on larger distances in the carotid artery. This new technique opens up new opportunities for studying and characterizing local vessel disease.Acknowledgements
No acknowledgement found.References
1. M. Uecker et al., Berkeley advanced reconstruction toolbox., Proc. Intl. Soc. Mag. Reson. Med. 2015
2. A.L. Wentland et al., Review of MRI-based measurements of pulse wave velocity: a biomarker of arterial stiffness. Cardiovasc. Diagn. Ther., 2014, 4:193-206
3. A. Dogui et al., Measurement of Aortic Arch Pulse Wave Velocity in Cardiovascular MR: Comparison of Transit Time Estimators and Description of a new Approach. Journal of Magn. Res. Imaging, 2011, 33:1321-1329
4. A. Rosset et al., OsiriX: An Open-Source Software for Navigating in Multidimensional DICOM Images. Journal of Digit. Imaging, 2004, 17:205-216
5. B. F. Coolen et al., High resolution frame rate retrospectively triggered Cine MRI for assessment of murine diastolic function. Magn. Res. Med., 2013, 69:648-656
6. E. Kröner et al., Pulse Wave Velocity and Flow in the Carotid Artery Versus the Aortic Arch: Effects of Aging. Journal of Magn. Res. Imaging, 2014, 40:287-293
7. W. A. Riley et al., Ultrasonic Measurement of the Elastic Modulus of the Common Carotid Artery. The Atherosclerosis Risk in Communities Study. Stroke, 1992, 23:952-956
Figures