0798
Multi-contrast Acquisition in a Single Scan (MASS) for Three-dimensional Quantitative T1 Mapping of Carotid Atherosclerosis1Center for Biomedical Imaging Research, School of Medicine, Tsinghua University, Beijing, People's Republic of China, 2Philips Research China, Shanghai, People's Republic of China, 3Department of Radiology, University of Washington School of Medicine, Seattle, WA, United States
Synopsis
Intra-plaque hemorrhage (IPH) is a dynamic process and change of the IPH MR signal was found to be correlated with plaque developments. So quantitative T1 mapping of plaque is essential to monitor plaque progression. In this study, we proposed an IR prepared 3D golden angle radial sampling sequence, enabling multiple T1 contrasts acquisition in a single scan (MASS) with application to carotid artery T1 mapping. The accuracy and feasibility of MASS was demonstrated in phantom studies and in vivo imaging experiments on healthy volunteers and carotid atherosclerosis patients. MASS may be a one-stop solution to carotid atherosclerotic plaque imaging.
Purpose
Carotid atherosclerosis has become the major cause of ischemic cerebrovascular event (1). Intra-plaque hemorrhage (IPH) is considered a characterization of vulnerable plaque, and can be detected by T1 weighted (T1W) MR sequences, such as MPRAGE (2), or SNAP (3). Recently, studies found that the T1 signal of IPH is changing across time (4), indicating IPH is a dynamic process. Moreover, the signal change of IPH on T1W MR images was found to be associated with plaque developments (5). Therefore, quantitative T1 mapping of plaque is important to better assess atherosclerotic plaque. In this study, we have developed a sequence enabling Multiple T1 contrasts Acquisition in a Single Scan (MASS) for 3D T1 mapping of carotid vessel wall.Methods
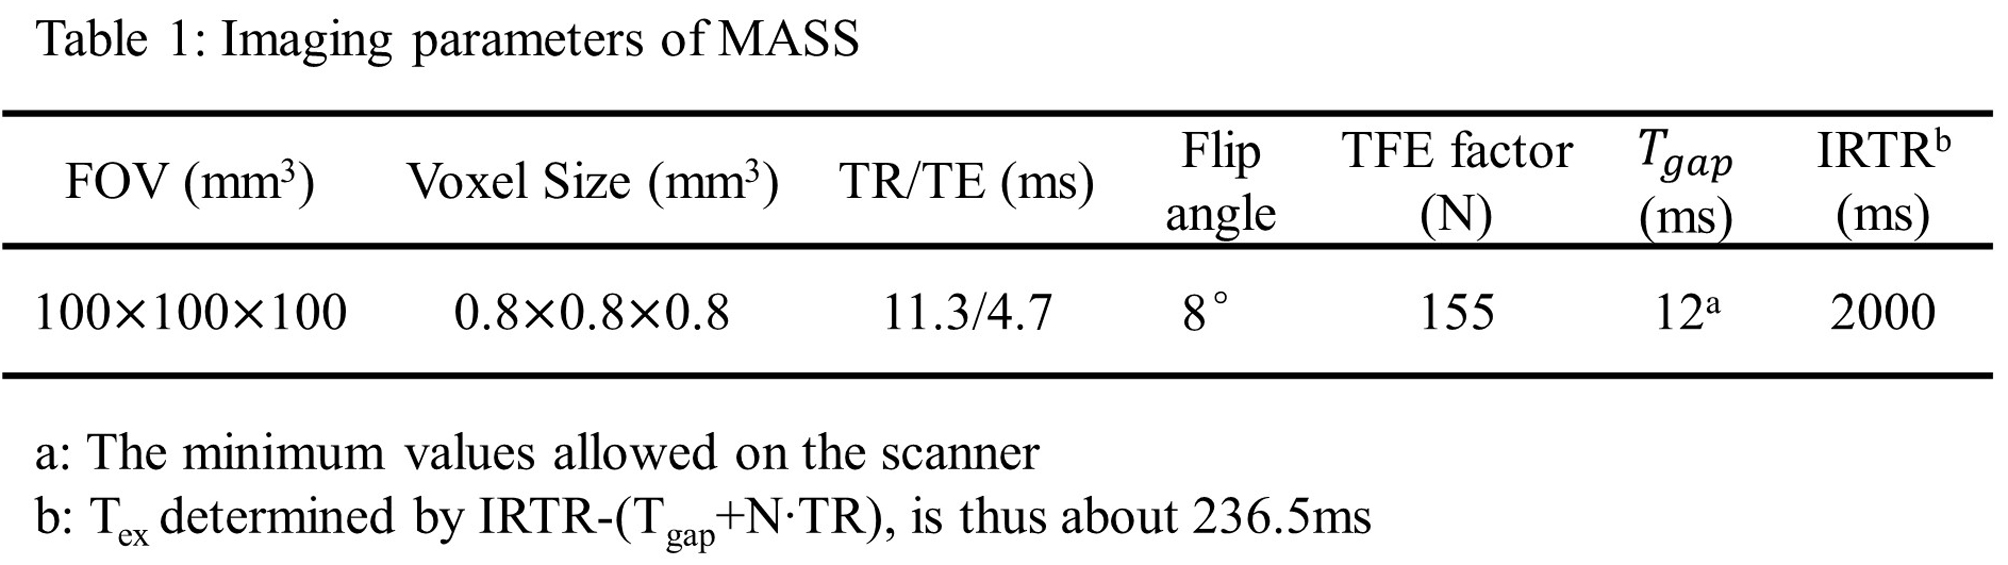
Sequence Design: The proposed sequence consists of an IR preparation pulse and a 3D radial sampling acquisition (Fig. 1). Spokes of the same Inversion Time (TI) in different IRTRs conform to the golden angle distribution (6), to achieve a uniformly distributed k-space at certain TI for reconstruction. Water excitation pulse was used to suppress fat signal. MR Imaging: All scans were performed on a 3T Philips Scanner. For phantom studies, 9 tubes containing diluted Gd-DTPA with different concentrations were designed. T1 mapping of phantoms were performed using both MASS and a standard 2D IR-SE sequence (7). For in vivo experiments, after institutional review board approval, 6 healthy volunteers and 5 patients with carotid atherosclerotic plaques were imaged using a custom-designed 36-channel neurovascular coil (8). The scan included the T1W QIR-TSE black-blood sequence (9), SNAP (3), and a 5 min MASS scan with imaging parameters shown in Table 1. Image Reconstruction: Sliding window and narrow-KWIC filter with CG-SENSE (10) were used together to generate image series along the inversion recovery curve. For coil sensitivities estimation, MASS image at TI=1300ms was reconstructed with temporal window width (TW)=35 and KWIC filter (11). Because image contrast is dominated by the central parts of k-space, the reconstructed image intensity is determined by averaging the signal at spoke number of n to n+TW-1, where n is the start spoke index, ranging from 1 to N-TW+1 with an interval of TW, and N is the TFE factor. By setting TW=19, 8 frames of images were reconstructed. The last frame was used to remove the background phase in phase-sensitive reconstruction. Then, T1 mapping was performed by fitting the signal curve from the reconstructed image series to the theoretically calculated signal equation (3) voxel-by-voxel. Image Analysis: MASS images were reformatted to 2mm axial slices with the same geometry to QIR-TSE, and matched to QIR-TSE based on carotid bifurcation. Then, for healthy arteries, 5 axial slices were selected from CCA. For atherosclerotic arteries, 5 axial slices centered at the carotid bifurcation were selected. The lumen, outer wall and adjacent muscle contours were drawn on QIR-TSE images of the selected slices. Then the mean T1 of the carotid vessel wall or plaque, and muscle region were calculated for each slice. The slice-averaged T1 values for healthy vessel wall and muscle were reported. For each atherosclerotic artery, the mean T1 of the slices with plaque were averaged to generate the overall T1 of the plaque. Moreover, the corresponding SNAP images were reviewed to identify IPH.Results
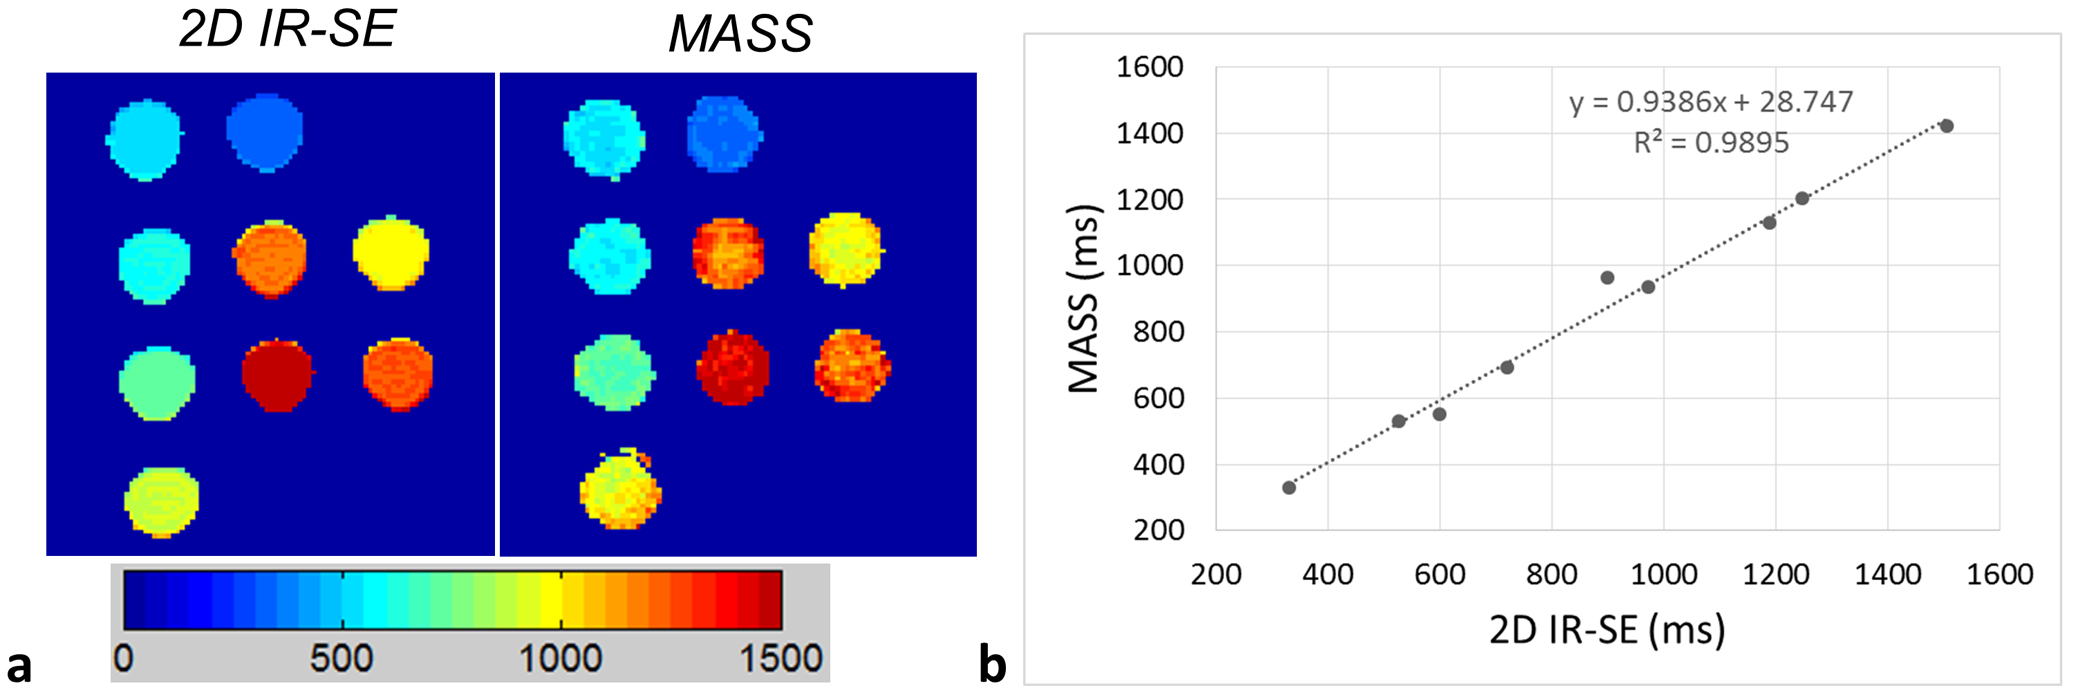
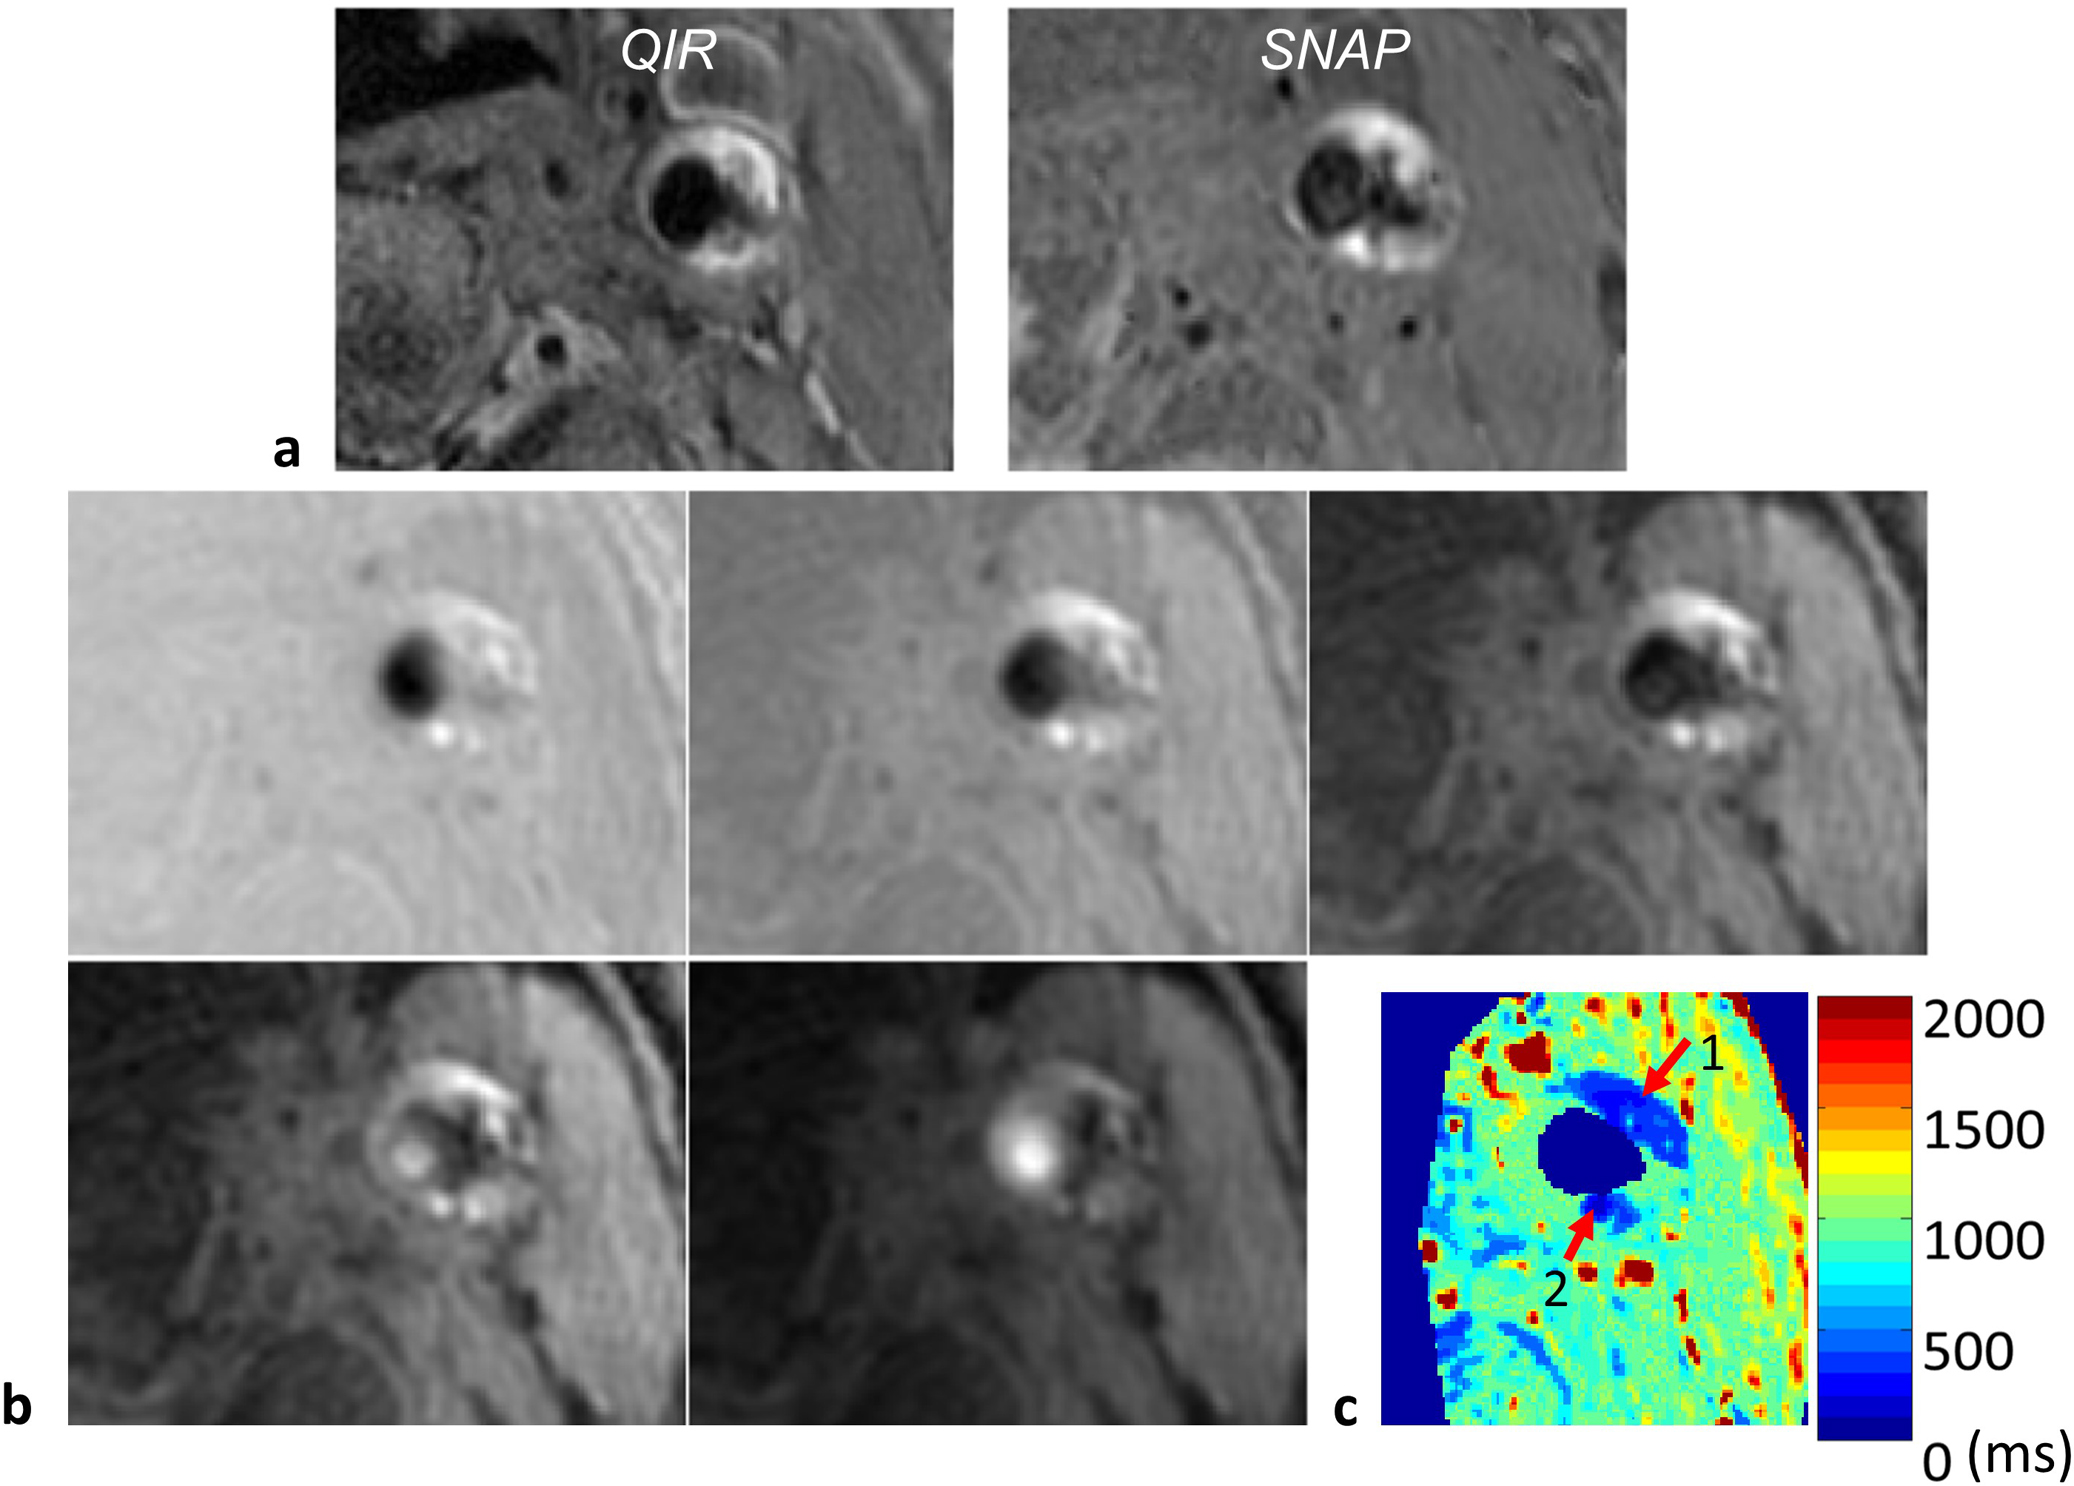
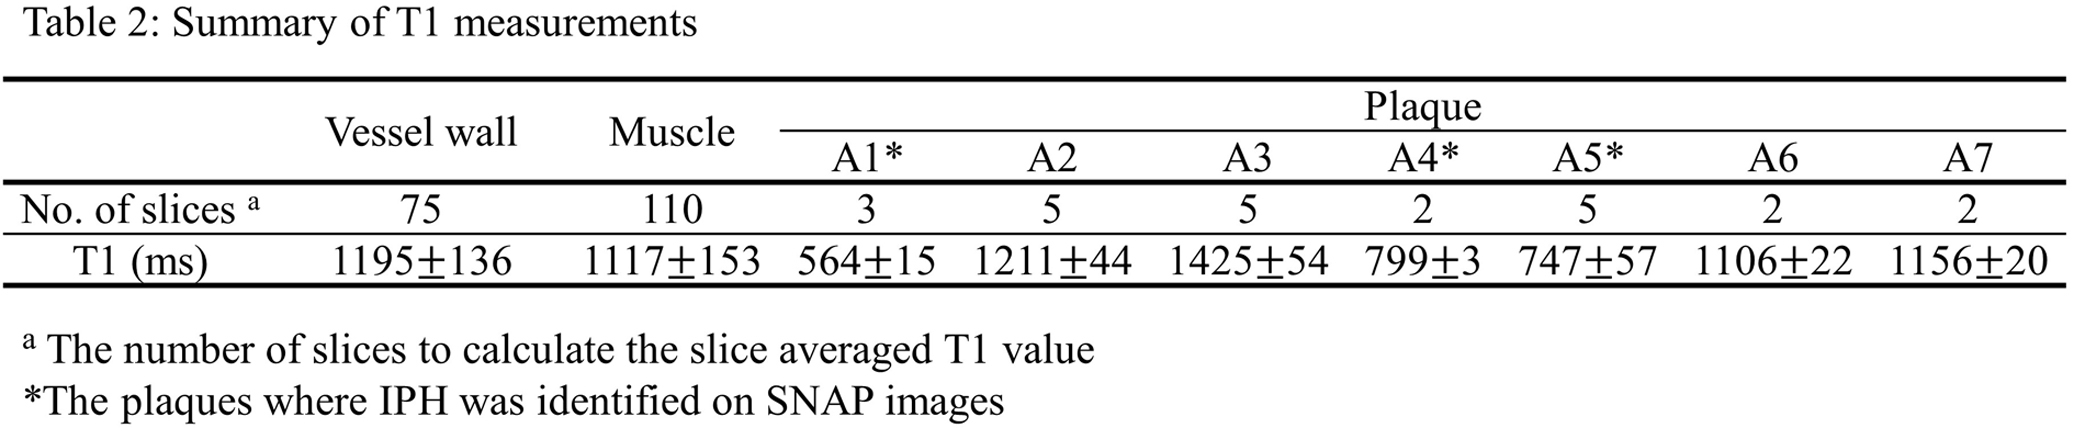
The T1 mapping results of phantom are shown in Fig. 2. The T1 values from MASS were in good agreement with 2D IR-SE with measurement bias of 4.3%±2.5%. For in vivo imaging, 7 carotid arteries were detected with plaque in the 5 patients, among which 3 arteries were identified to have IPH on SNAP images. An example of MASS images at multiple TIs and the generated T1 map of an artery with IPH are shown in Fig. 3. Strong hyperintensities were seen in the plaque on the SNAP image, and the IPH regions showed strongly reduced values on the T1 map (IPH1: 412ms; IPH2: 353ms). The T1 measurements were summarized in Table 2. The plaque with IPH has lower T1 value than healthy vessel wall and the plaque without IPH.Discussion and Conclusions
In this study, we have developed a 3D technique that can acquire co-registered images with multiple T1 contrasts in a single scan in short scan time (5min). The feasibility of MASS in quantitative T1 mapping of carotid artery has been demonstrated in healthy volunteers and atherosclerotic patients. In conclusion, MASS may be a useful tool to detect T1 changes of atherosclerotic plaque, and thus monitor its progression.Acknowledgements
No acknowledgement found.References
1. Takaya N, Yuan C, Chu BC, et al. Association between carotid plaque characteristics and subsequent ischemic cerebrovascular events - A prospective assessment with MRI - Initial results. Stroke. 2006; 37(3):818-23.
2. Zhu DC, Ferguson MS, DeMarco JK. An optimized 3D inversion recovery prepared fast spoiled gradient recalled sequence for carotid plaque hemorrhage imaging at 3.0 T. Magn Reson Imaging. 2008; 26(10):1360-6.
3. Wang JN, Bornert P, Zhao HL, et al. Simultaneous noncontrast angiography and intraPlaque hemorrhage (SNAP) imaging for carotid atherosclerotic disease evaluation. Magn Reson Med. 2013; 69(2):337-45.
4. van den Bouwhuijsen QJ, Selwaness M, Tang H, et al. Change in Carotid Intraplaque Hemorrhage in Community-dwelling Subjects: A Follow-up Study Using Serial MR Imaging. Radiology. 2016; Aug 19:151806. [Epub ahead of print].
5. Sun J, Liu J, Balu N, et al. Dynamic Changes in MR Signals of Intraplaque Hemorrhage are Strongly Correlated with Plaque Progression: a Serial Imaging Study on Carotid Atherosclerosis. The 84th European Atherosclerosis Society Congress. Innsbruck, Austria2016; p.248.
6. Chan RW, Ramsay EA, Cunningham CH, Plewes DB. Temporal Stability of Adaptive 3D Radial MRI Using Multidimensional Golden Means. Magn Reson Med. 2009; 61(2):354-63.
7. Deoni SCL, Rutt BK, Peters TM. Rapid combined T-1 and T-2 mapping using gradient recalled acquisition in the steady state. Magn Reson Med. 2003; 49(3):515-26.
8. Wang X, Li R, Hayes C, Balu N, Zhao X, Yuan C. A New Designed 36-Channel Neurovascular Coil at 3T. Proceedings of the 20th Annual Meeting of ISMRM2012; p.2787.
9. Yarnykh VL, Yuan C. T-1-insensitive flow suppression using quadruple inversion-recovery. Magn Reson Med. 2002; 48(5):899-905.
10. Neumann D, Breuer FA, Volker M, et al. Reducing Contrast Contamination in Radial Turbo-Spin-Echo Acquisitions by Combining a Narrow-Band KWIC Filter with Parallel Imaging. Magn Reson Med. 2014; 72(6):1680-6.
11. Song HK, Dougherty L. k-space weighted image contrast (KWIC) for contrast manipulation in projection reconstruction MRI. Magn Reson Med. 2000; 44(6):825-32.
Figures