0796
Volumetric blood flow measurement with territorial segmentation of time-resolved contrast enhanced magnetic resonance angiography of the brain1Functional Brain Center, The Wohl Institute for Advanced Imaging, Tel Aviv Sourasky Medical Center, Tel Aviv, Israel, 2Sagol School of Neuroscience, Tel Aviv University, Tel Aviv, Israel, 3Department of Radiology, Tel Aviv Sourasky Medical Center, Tel Aviv, Israel, 4Department of NeuroSurgery, Tel Aviv Sourasky Medical Center, Tel Aviv, Israel, 5Sackler Faculty of Medicine, Tel Aviv University, Tel Aviv, Israel
Synopsis
We propose a method for territorial segmentation and volumetric flow rate (VFR) measurement based on time-resolved contrast enhanced MR-angiography. Eight territories: right/left internal carotid arteries; the two anterior cerebral arteries (combined); the right/left external carotid arteries; the right/left posterior cerebral arteries; and the vertebrobasilar territory, were segmented using an iterative region-growing algorithm based on the bolus-arrival-time with increased temporal resolution. VFR was measured based on the territorial volume as a function of time. Healthy subjects' VFR results were similar to literature values. The clinical potential of this method is demonstrated on one patient with Moyamoya before and after surgery.
Purpose
The ability to examine the vascular territory structure and the volumetric flow rate (VFR) of a specific artery is of central importance in the diagnosis and evaluation of many cerebrovascular diseases. A few methods have been proposed including territorial mapping using arterial spin labeling (ASL) and phase contrast. However, there are several drawbacks to these methods that limit their use in clinical practice. The aims of this study were to develop an analysis method for (1) territorial segmentation based on Time-resolved contrast enhanced angiography with Interleaved Stochastic Trajectories (TWIST) data, and (2) measurement of the VFR in the major cerebral arteries.Methods
Subjects: Six healthy subjects (ages 25-28) were scanned twice with an interval of 1-3 weeks. One five year old child with Moyamoya syndrome was scanned before and after bypass surgery.
MR protocol: MR Scans were performed on 3T Prisma or Skyra Siemens scanners. TWIST data was acquired with coronal orientation, spatial resolution of 0.9X0.9X1mm and temporal resolution of 2.3-2.7sec. A power injector (MEDRAD) was used to infuse 0.2cc/kg (0.5M) of contrast agent (Gadolinum Dotarem), followed by a flush of 20cc saline, at a constant rate of 2cc/sec. Fifty-four measurements were acquired with a total scan time of 2 minutes and 14 seconds.
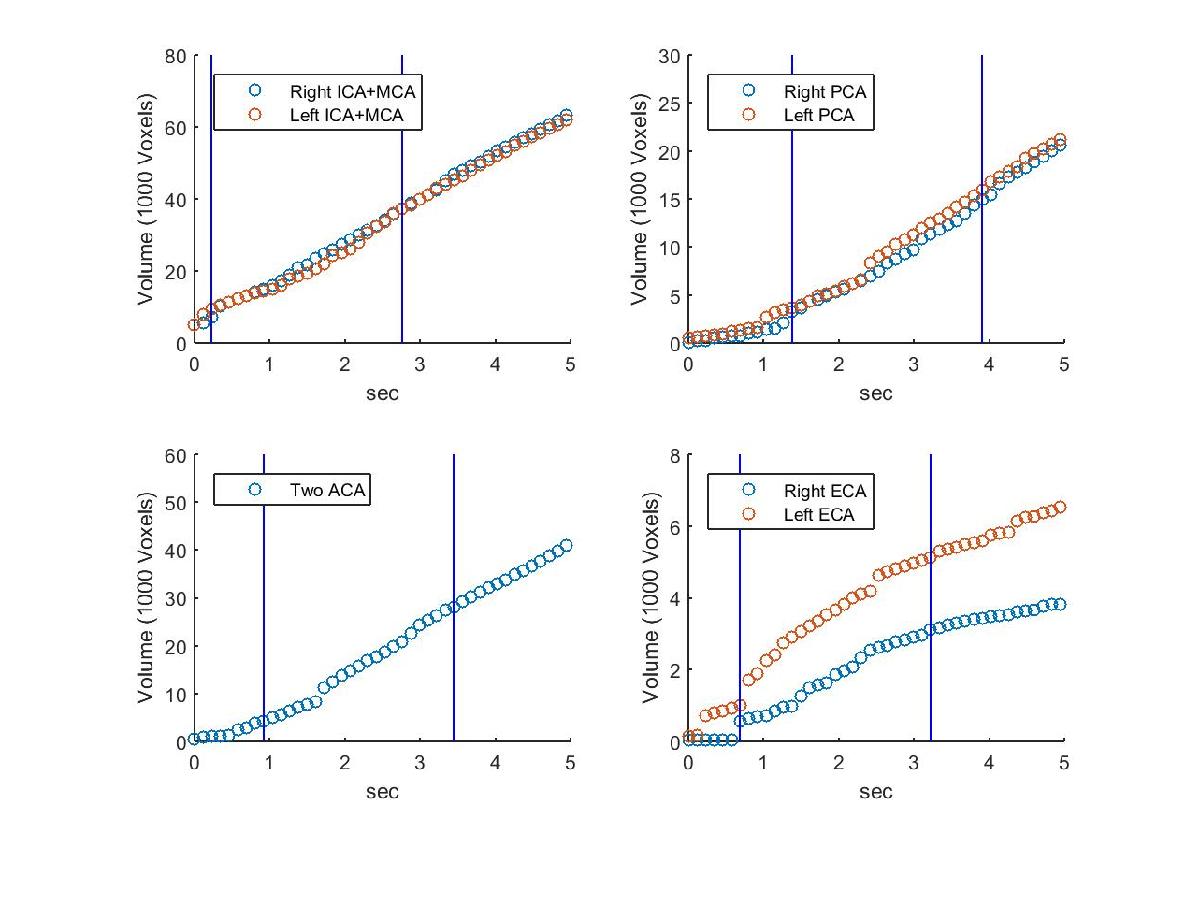
Territorial segmentation: the developed method included five steps: (1) Creation of angiography mask by including only voxels with peak value >5% of maximum peak value. (2) Estimation of bolus arrival-time (BAT) in higher temporal resolution than the acquired resolution using curve fitting of each voxel's signal time course to a function composed of two Gaussian peaks (similar to Liberman et al.1). (3) Manual definition of seed regions for each territory. (4) Creation of blocking zones which prevent territories from breaching the circle of Willis, or the opposite hemisphere (for the lateral territories). (5) Territorial segmentation using a region-growing algorithm with additional temporal boundaries (similar to Christensen et al.2). Eight different territories were segmented: right/left internal carotid arteries, mainly the middle cerebral arteries (ICA-MCA); the two anterior carotid arteries (ACA) (combined); the right/left external carotid arteries (ECA); the right/left posterior cerebral arteries (PCA); and the vertebrobasilar territory. Calculation of VFR was done for each territory according to the change of the territory volume as a function of time (Figure 1) (while the PCA territories were included in the vertebrobasilar territory). The VFR of each territory was normalized by dividing it with the total VFR. Between and within subjects’ standard deviation and least detectable difference (LDD) were calculated3.
Results & Discussion
The method was successfully applied to all subjects, enabling segmentation of eight different territories, covering the entire brain with spatial resolution of about 1 mm3, and providing high temporal resolution BAT maps along with measurement of VFR distribution.
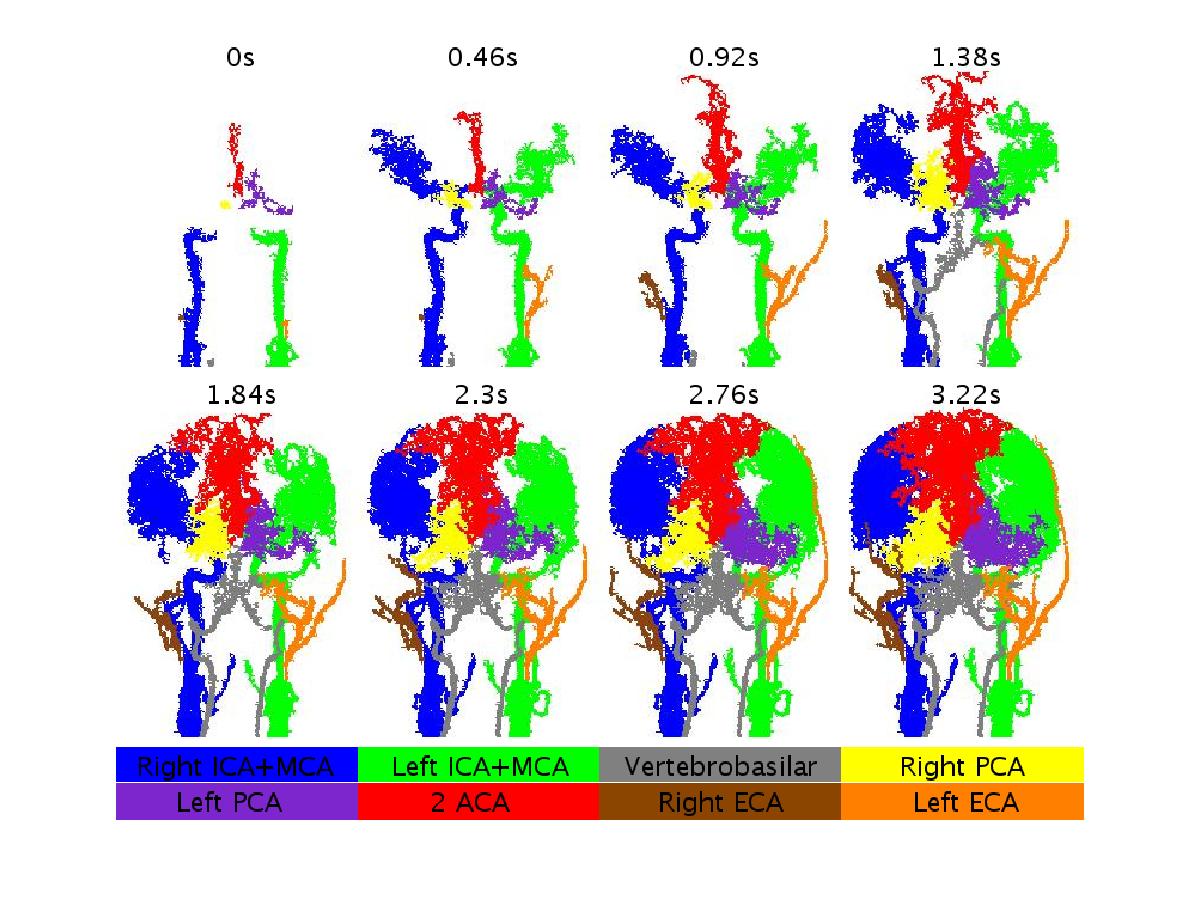
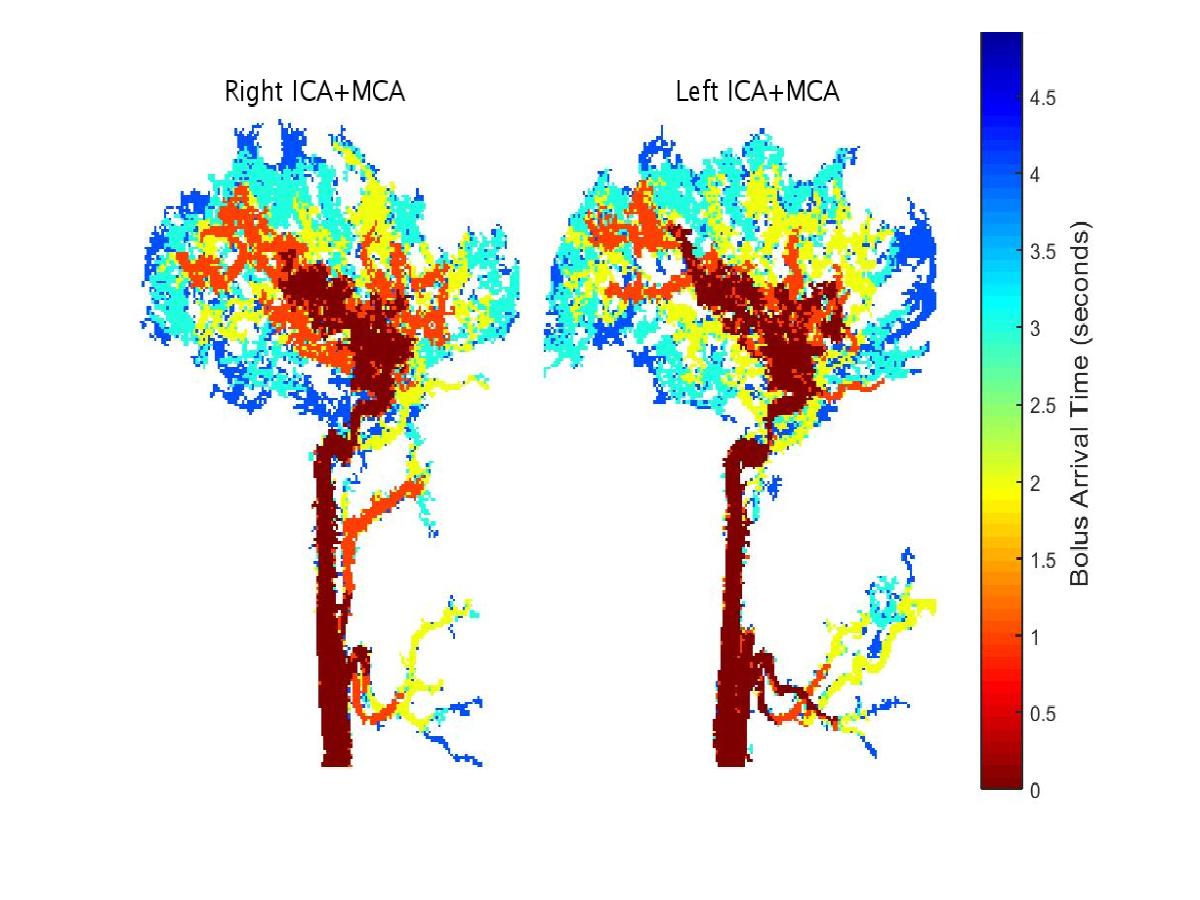
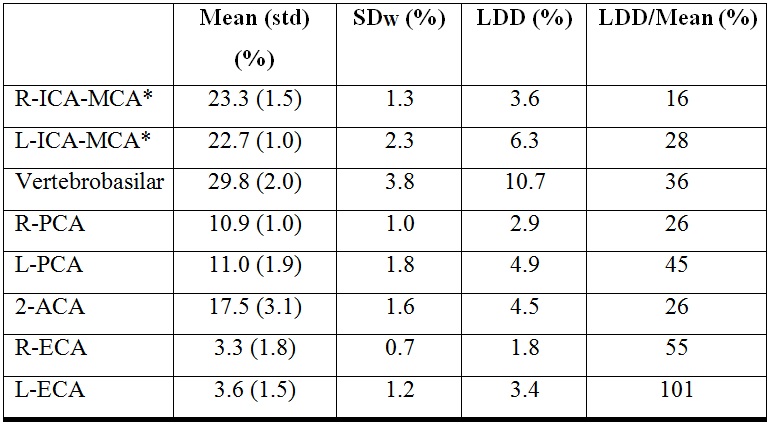
Results of the healthy subjects: Figure 2 presents territorial segmentation and Figure 3 presents sagittal projections of BAT images for the right and left ICA territories, of a healthy subject. Table 1 presents the mean VFR, the inter-subject standard deviation, the intra-subject standard deviation (SDw), the LDD and the LDD/mean for each territory. The calculated VFR values are similar to previously reported VFR values using phase contrast4 for all territories (10-40% difference) except the ECA VFR which is underestimated using our method. Our preliminary results suggest that the method’s reproducibility is comparable and even higher than phase contrast VFR reproducibility5.
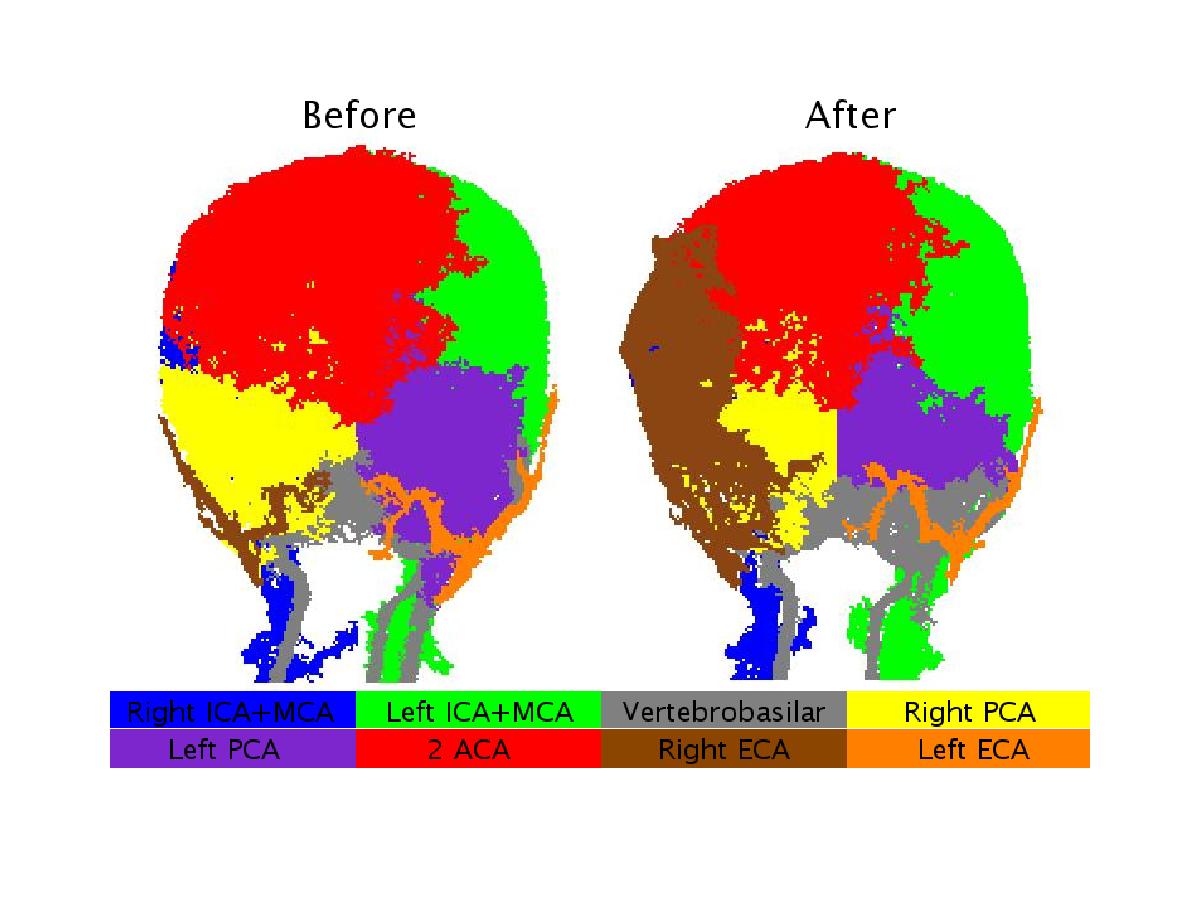
Results of the patient with Moyamoya: Territorial segmentation of the patient with Moyamoya is presented in Figure 4. As can be seen, before surgery, there is only a small supply from the right ICA, and the right hemisphere is supplied by collaterals from ACA and the right PCA. After the surgery, a dominant contribution of the right ECA bypass can be seen. The calculated VFR of the right ECA was 0.4% before surgery and 11.6% after surgery (relative to 3.3% in healthy subjects).
Conclusion
This is the first study that propose an analysis method for territorial segmentation and quantitative VFR measurements from TWIST, a routinely used clinical scan, taking about two minutes of acquisition during contrast agent injection. Preliminary results suggest the potential of this method to provide quantitative evaluation of patients with occlusive conditions, including occlusion severity, collateral contribution, and follow-up of disease progression and treatment response.Acknowledgements
No acknowledgement found.References
1. Liberman, Gilad, et al. "DUSTER: dynamic contrast enhance up-sampled temporal resolution analysis method." Magnetic resonance imaging 34.4 (2016): 442-450.
2. Christensen, Søren, et al. "Improved dynamic CT angiography visualization by flow territory masking." Brain Circulation 1.1 (2015): 114
3. Bland, J. Martin, and Douglas G. Altman. "Statistics notes: measurement error." Bmj 313.7059 (1996): 744.
4. Zarrinkoob, Laleh, et al. "Blood flow distribution in cerebral arteries." Journal of Cerebral Blood Flow & Metabolism 35.4 (2015): 648-654.
5. Correia de Verdier M, Wikström J (2016) Normal ranges and testretest reproducibility of flow and velocity parameters in intracranial arteries measured with phase-contrast magnetic resonance imaging. Neuroradiology 58(5):521–31. doi:10.1007/s00234-016-1661-6
Figures