0793
Detecting DISC1 Related Microstructural Abnormalities using Non-Gaussian Diffusion (DKI & NODDI) and QSM: with Histological Validation1Electrical Engineering and Computer Sciences, University of California Berkeley, Berkeley, CA, United States, 2Brain Imaging and Analysis Center, Duke University School of Medicine, 3Duke University School of Medicine, 4Johns Hopkins University School of Medicine
Synopsis
Metrics provided by DKI could be used to detect microstructural changes. However, they bear no explicit neurobiological interpretations. In contrast, the biophysical model of NODDI could provide metrics sensitive to density of neuron. The magnetic susceptibility derived from QSM method can sever as a sensitive biomarker for quantifying density of cells including both neurons and neuroglia.
Introduction
Disrupted-in-Schizophrenia-1 (DISC1) was first identified as a candidate gene for mental illness by the analysis of a chromosome translocation, which segregated with schizophrenia (1). In spite of a few studies that investigated DISC1-related macrostructural abnormalities such as volume of the hippocampus and ventricle as well as thickness of cerebral cortex (2-4), mutant DISC1 induced alterations at the microscopic level remain largely unexplored, especially in gray matter regions. The objectives of this study are to utilized diffusion kurtosis imaging (DKI) (5-8), Neurite Orientation Dispersion and Density Imaging (NODDI) (9) and quantitative susceptibility mapping (QSM) (10-12) to detect and quantify cerebral microstructural change, and to validate the imaging findings with histological measurements.Materials and Methods
The Tet-off double transgenic system was used to generate a mouse model of inducible expression of mutant truncated human DISC1 (hDISC1) (13). In the present study, double transgenic mutant hDISC1 mice were included in the mutant group (n = 5), whereas their single tetracycline-transactivator transgenic littermates were included in the control group (n = 5).
Brain specimens from these two groups were scanned at a 9.4 T (400 MHz) 8.9-cm vertical bore Oxford magnet. For reconstruction of quantitative susceptibility maps, magnitude and phase data were acquired using a GRE sequence with 8 echoes. DKI metrics including mean kurtosis (MK), mean diffusivity (MD), and fractional anisotropy (FA), as well as NODDI metrics inducing neurite density index (NDI) and orientation dispersion index (ODI) were calculated from diffusion-weighted images were acquired with 30 gradient directions and two b-values (2.5 and 5.0 ms/μm2).
Mice brains were cut, mounted and stained for Nissl body. Measurement of density of neuron, density of neuroglia and density of neuron plus neuroglia were recorded.
Results
In hDISC1 group, significant decrease in FA was observed in was observed in the anterior commissure (control: 0.41 ± 0.04, hDISC1: 0.34 ± 0.03, P = 0.009). Significant increase in susceptibility was found in the hippocampus (control: 2.11 ± 0.65 ppb, hDISC1: 2.87 ± 0.28 ppb, P = 0.042). Significant increase in NDI was observed in the hippocampus (control: 0.78 ± 0.04, hDISC1: 0.88 ± 0.06, P = 0.020).
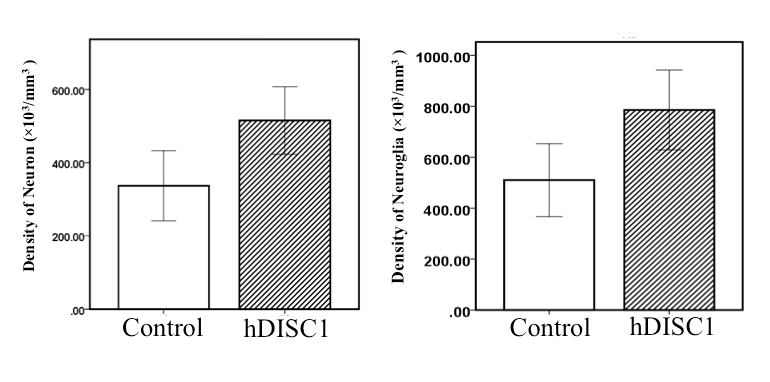
Significant difference in density of neurons between groups was observed in the hippocampus (control: 336.69 ± 95.78 ×10³/mm3, hDISC1: 515.00 ± 92.15 ×10³/mm3, P = 0.017). Significant difference in density of neurons plus neuroglia between groups was observed in the hippocampus (control: 510.34 ± 143.28, hDISC1: 785.61 ± 156.90, P = 0.020). Figure 1.
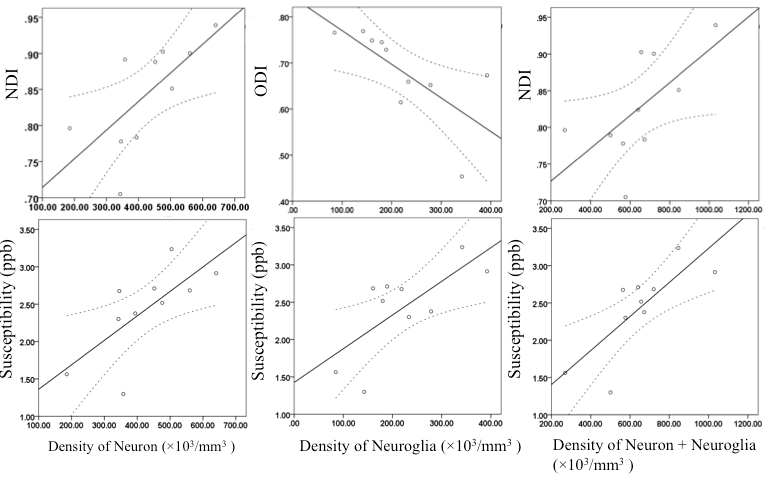
Positive correlation between density of neurons and NDI in the hippocampus was observed (r = 0.783, P = 0.007). Negative correlation between density of neuroglia and ODI in the hippocampus was observed (r = - 0.647, P = 0.043). Positive correlation between density of neurons plus neuroglia and NDI was observed in the hippocampus (r = 0.636, P = 0.048).
Correlation between density of neurons and susceptibility in the hippocampus was significant (r = 0.657, P = 0.039). Correlation between density of neuroglia and susceptibility in the hippocampus is significant (r = 0.750, P = 0.013). Correlation between density of neurons plus neuroglia and susceptibility is significant in the hippocampus (r = 0.764, P = 0.010). Figure 2.
Discussion and Conclusion
In gray matter of the hippocampus, an increase in susceptibility is a reflection of possible increase in ferritin content, which further indicated a possible increase in cell density in hDISC group. Histological measurement of neuronal density and glia density validated this speculation, showing higher neuronal density and overall cell density.
It is worth noting that susceptibility correlated with both density of neurons and density of neuroglia. Since paramagnetic ferritin is an essential protein that is present in every cell type, the observed strong positive correlations between susceptibility and cell density are expected.
In terms of the non-Gaussian diffusion metrics, NDI derived from the NODDI model has more explicit neurobiological interpretation as compared to DKI metrics, which are not sensitive to any particular biophysical measurement. Therefore significant correlation between NDI and density of neurons was observed, while no correlation between DKI metrics and histological measurements were observed. However, DKI metrics could be sensitive in capturing microstructural abnormalities other than change in neurite density as observed in the anterior commissure.
In conclusion, metrics provided by DKI could be used to detect microstructural changes. However, they bear no explicit neurobiological interpretations. In contrast, the biophysical model of NODDI could provide metrics sensitive to density of neuron. The magnetic susceptibility derived from QSM method can sever as a sensitive biomarker for quantifying density of cells including both neurons and neuroglia.
Acknowledgements
No acknowledgement found.References
1. Hodgkinson CA, Goldman D, Jaeger J, et al. Disrupted in schizophrenia 1 (DISC1): association with schizophrenia, schizoaffective disorder, and bipolar disorder. Am J Hum Genet. 2004;75(5):862-72. 2. Duff BJ, Macritchie KA, Moorhead TW, Lawrie SM, Blackwood DH. Human brain imaging studies of DISC1 in schizophrenia, bipolar disorder and depression: a systematic review. Schizophr Res. 2013;147(1):1-13. 3. Ohnishi T, Hashimoto R, Mori T, et al. The association between the Val158Met polymorphism of the catechol-O-methyl transferase gene and morphological abnormalities of the brain in chronic schizophrenia. Brain. 2006;129(Pt 2):399-410. 4. Sprooten E, Sussmann JE, Moorhead TW, et al. Association of white matter integrity with genetic variation in an exonic DISC1 SNP. Mol Psychiatr. 2011;16(7):688-9. 5. Liu CL, Bammer R, Acar B, Moseley ME. Characterizing non-Gaussian diffusion by using generalized diffusion tensors. Magnet Reson Med. 2004;51(5):924-37. 6. Jensen JH, Helpern JA. MRI quantification of non-Gaussian water diffusion by kurtosis analysis. NMR Biomed. 2010;23(7):698-710. 7. Gong NJ, Wong CS, Chan CC, Leung LM, Chu YC. Correlations between microstructural alterations and severity of cognitive deficiency in Alzheimer's disease and mild cognitive impairment: a diffusional kurtosis imaging study. Magn Reson Imaging. 2013;31(5):688-94. 8. Gong NJ, Wong CS, Chan CC, Leung LM, Chu YC. Aging in deep gray matter and white matter revealed by diffusional kurtosis imaging. Neurobiol Aging. 2014;35(10):2203-16. 9. Zhang H, Schneider T, Wheeler-Kingshott CA, Alexander DC. NODDI: practical in vivo neurite orientation dispersion and density imaging of the human brain. Neuroimage. 2012;61(4):1000-16. 10. Liu C, Li W, Johnson GA, Wu B. High-field (9.4 T) MRI of brain dysmyelination by quantitative mapping of magnetic susceptibility. Neuroimage. 2011;56(3):930-8. 11. Gong NJ, Wong CS, Hui ES, Chan CC, Leung LM. Hemisphere, gender and age-related effects on iron deposition in deep gray matter revealed by quantitative susceptibility mapping. NMR Biomed. 2015;28(10):1267-74. 12. Li W, Wu B, Batrachenko A, et al. Differential developmental trajectories of magnetic susceptibility in human brain gray and white matter over the lifespan. Hum Brain Mapp. 2014;35(6):2698-713. 13. Ayhan Y, Abazyan B, Nomura J, et al. Differential effects of prenatal and postnatal expressions of mutant human DISC1 on neurobehavioral phenotypes in transgenic mice: evidence for neurodevelopmental origin of major psychiatric disorders. Mol Psychiatry. 2011;16(3):293-306.Figures