0792
7 Tesla imaging of microstructural brainstem changes in REM sleep behavior disorder1Department of Radiology, A.A. Martinos Center for Biomedical Imaging, MGH and Harvard Medical School, Boston, MA, United States, 2Department of Neurology, MGH and Harvard Medical School, Boston, MA, United States
Synopsis
REM-sleep-behavior-disorder (RBD) is characterized by the absence of muscle-atonia during REM-sleep and is thought to be related to a dysfunction of brainstem-nuclei (Bn) of the arousal/motor networks. Yet, a precise identification of the Bn involved in vivo is still missing, thus limiting our understanding of this disease. Through multi-contrast high-spatial-resolution 7Tesla-MRI and a recently developed stereotaxic-Bn-atlas, we consistently detected across RBD-patients microstructural-changes in a subregion of the substantia nigra, consistent with pars reticulata, and in a peri-nigral area. Interestingly, these changes were compatible with the presence of lacunar infarcts, finding that differs from recent reports of nigral iron-accumulation in RBD.
Introduction
REM-sleep-behavior-disorder (RBD) is a sleep disorder characterized by the absence of muscle-atonia during REM sleep [1]. RBD represents an early (prodromal) clinical manifestation of evolving motor neurodegenerative synucleinopathies. RBD patients have up to an 80% risk of developing Parkinson’s disease (PD) after 10 years from RBD-diagnosis [2]. It is know from lesion and connectivity studies in animals [1] that RBD displays a network dysfunction of brainstem nuclei (Bn) involved in arousal and motor function (e.g. the locus-coeruleus area, reticular-formation, raphe-nuclei, pedunculotegmental nuclei, and substantia nigra SN). The hypothesis that Bn are involved in RBD is also supported by an ex-vivo human clinical-pathological staging model of PD progression (the so called Braak hypothesis [3]), which predicts that neuro-degeneration of Bn of the arousal and motor systems occurs much earlier (mainly pre-symptomatic stages 1-3) than in the striatum and in the neocortex (symptomatic stages 4-6). A few human MRI studies of non-idiopathic RBD [4-8] and one recent study of idiopathic RBD [9] report the presence of structural changes in pontine/midbrain areas compatible with animal RBD studies and with the Braak hypothesis. Yet, a precise identification of the Bn involved and of their connections in-vivo is still missing, thus limiting our understanding of idiopatic RBD/prodromal PD.Purpose
To investigate the presence of microstructural brainstem changes in RBD by the use of: (i) high resolution (.75 mm isotropic) multi-contrast (T1 and T2*-weighted) MRI at 7 Tesla; (ii) our recently developed [10] stereotaxic probabilistic structural atlas in MNI space of several Bn of the arousal and motor systems (including: two subregions of the SN, i.e. subregion 1 and 2, compatible with SN pars reticulata –SNPR– and compacta –SNPC, respectively; two subregions of the red nucleus and of the subthalamic nucleus; median-raphe; dorsal-raphe; raphe-magnus, periaqueductal gray, and inferior olivary nucleus).Methods
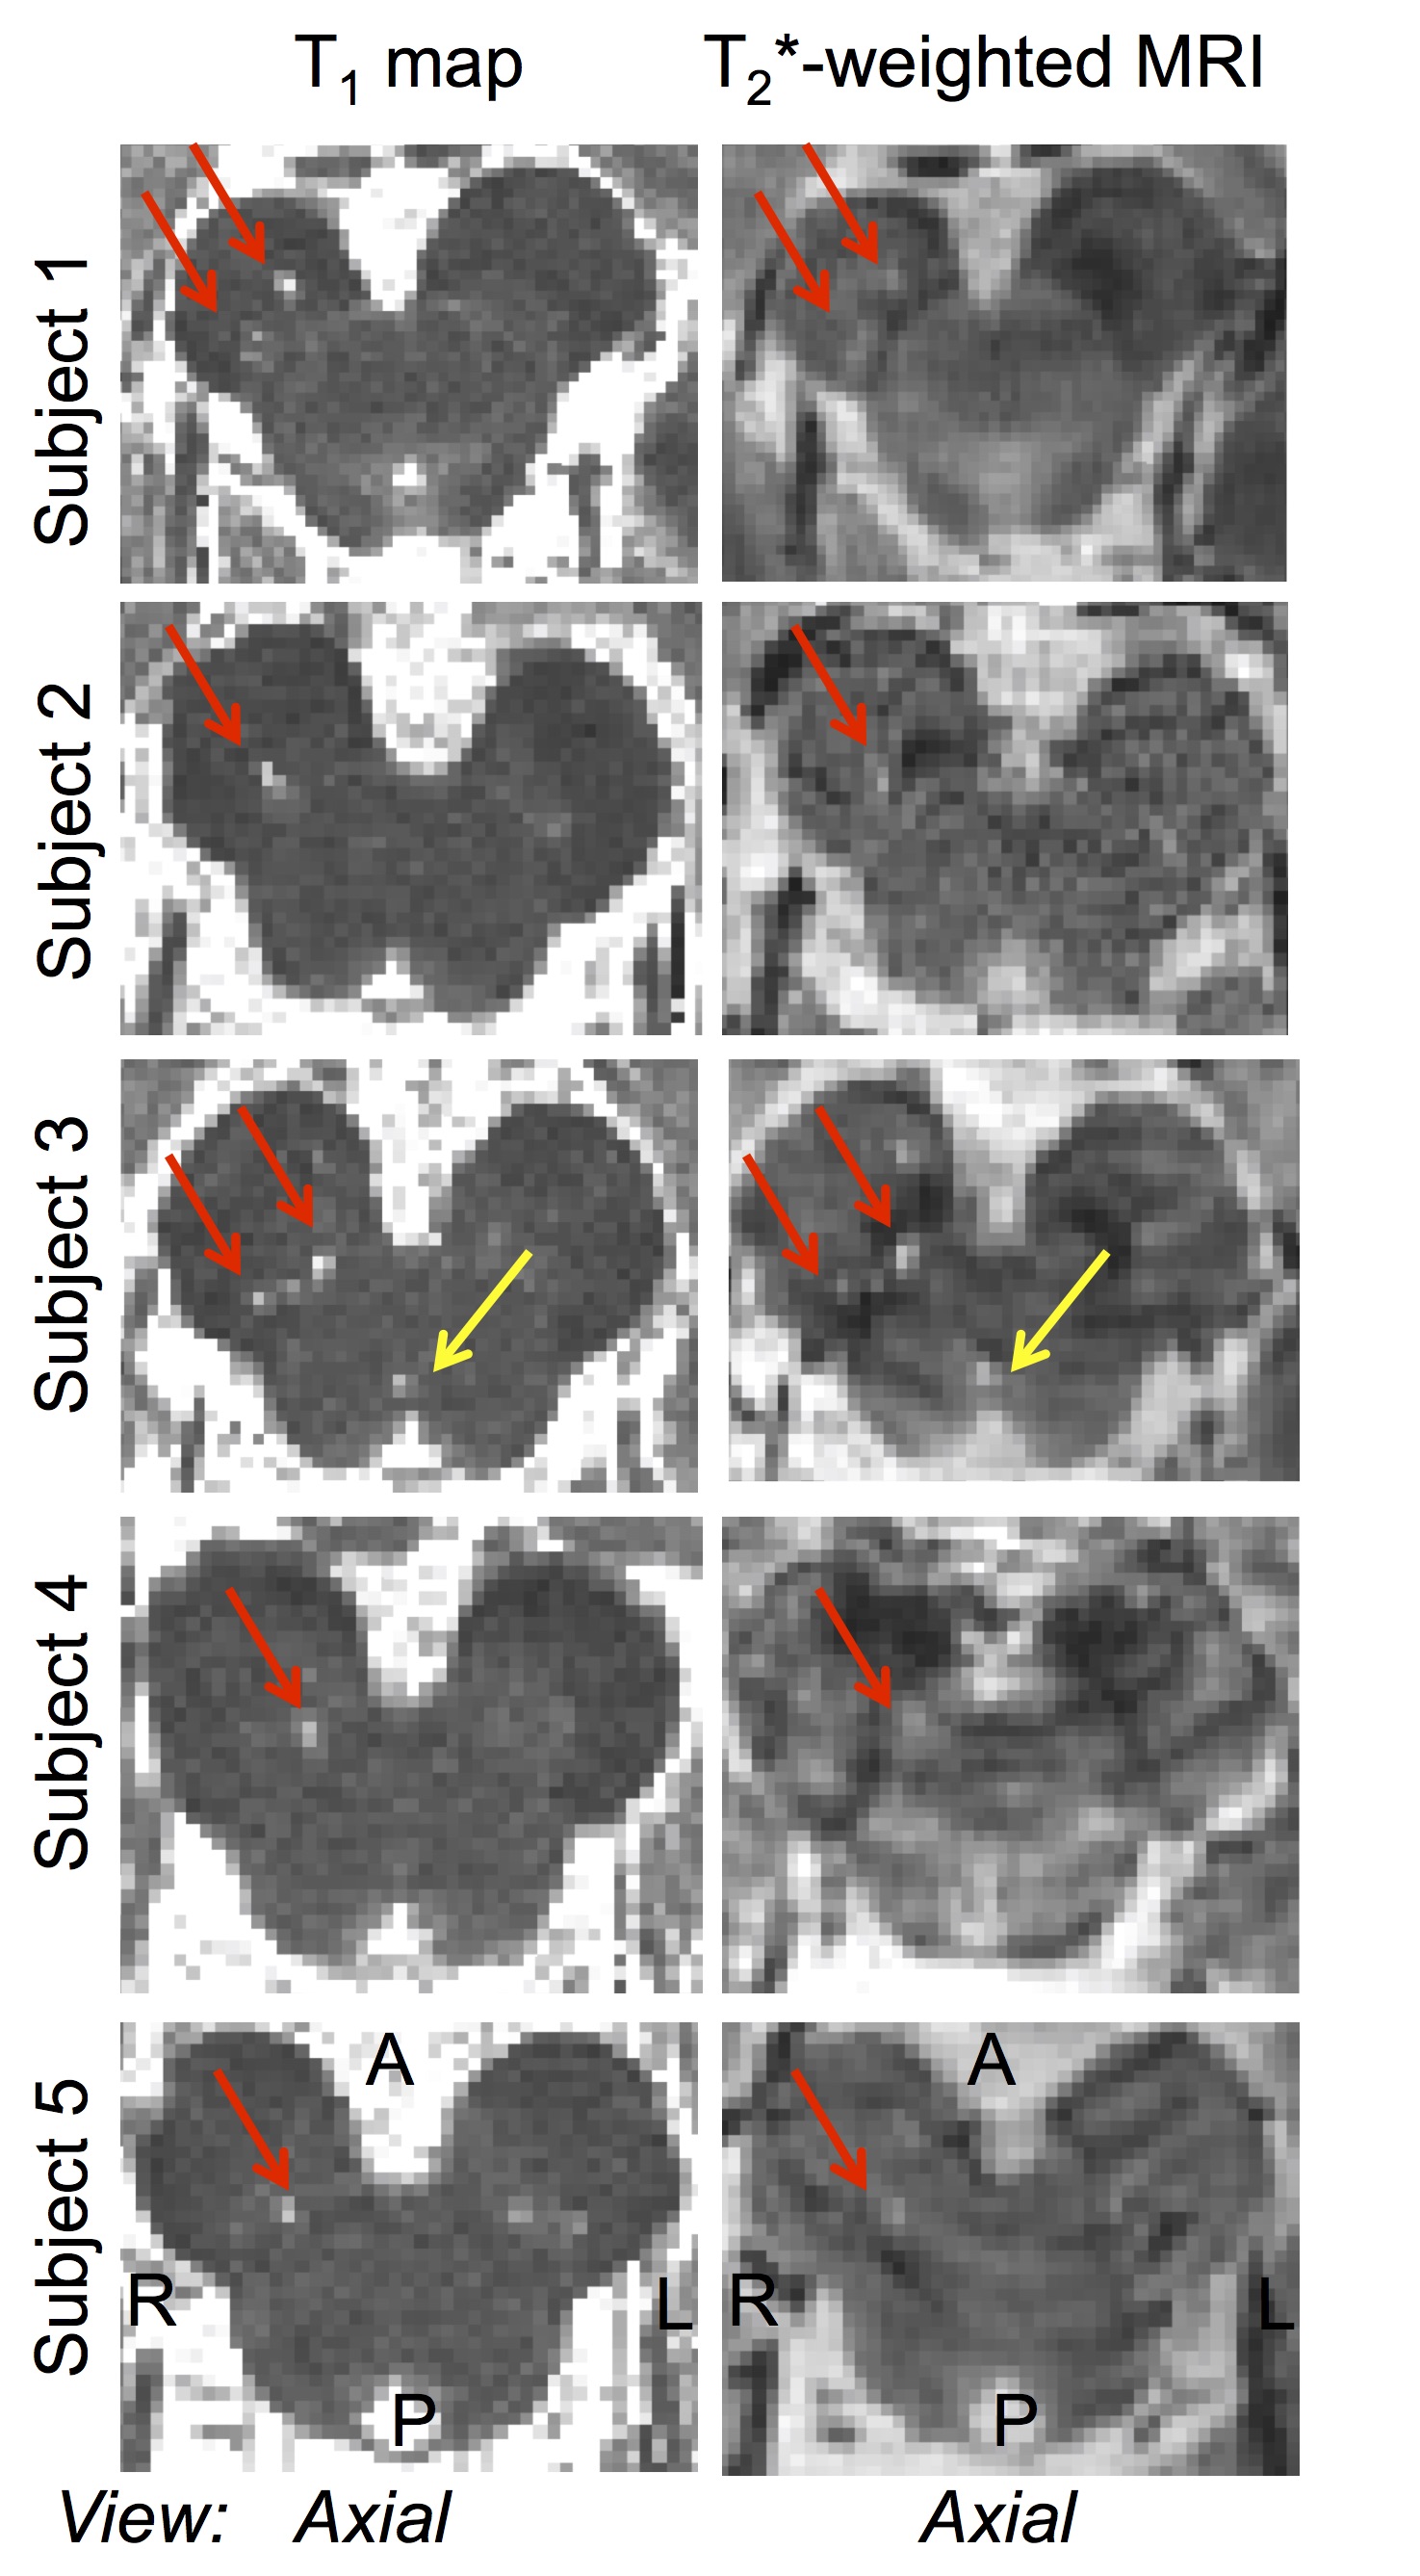
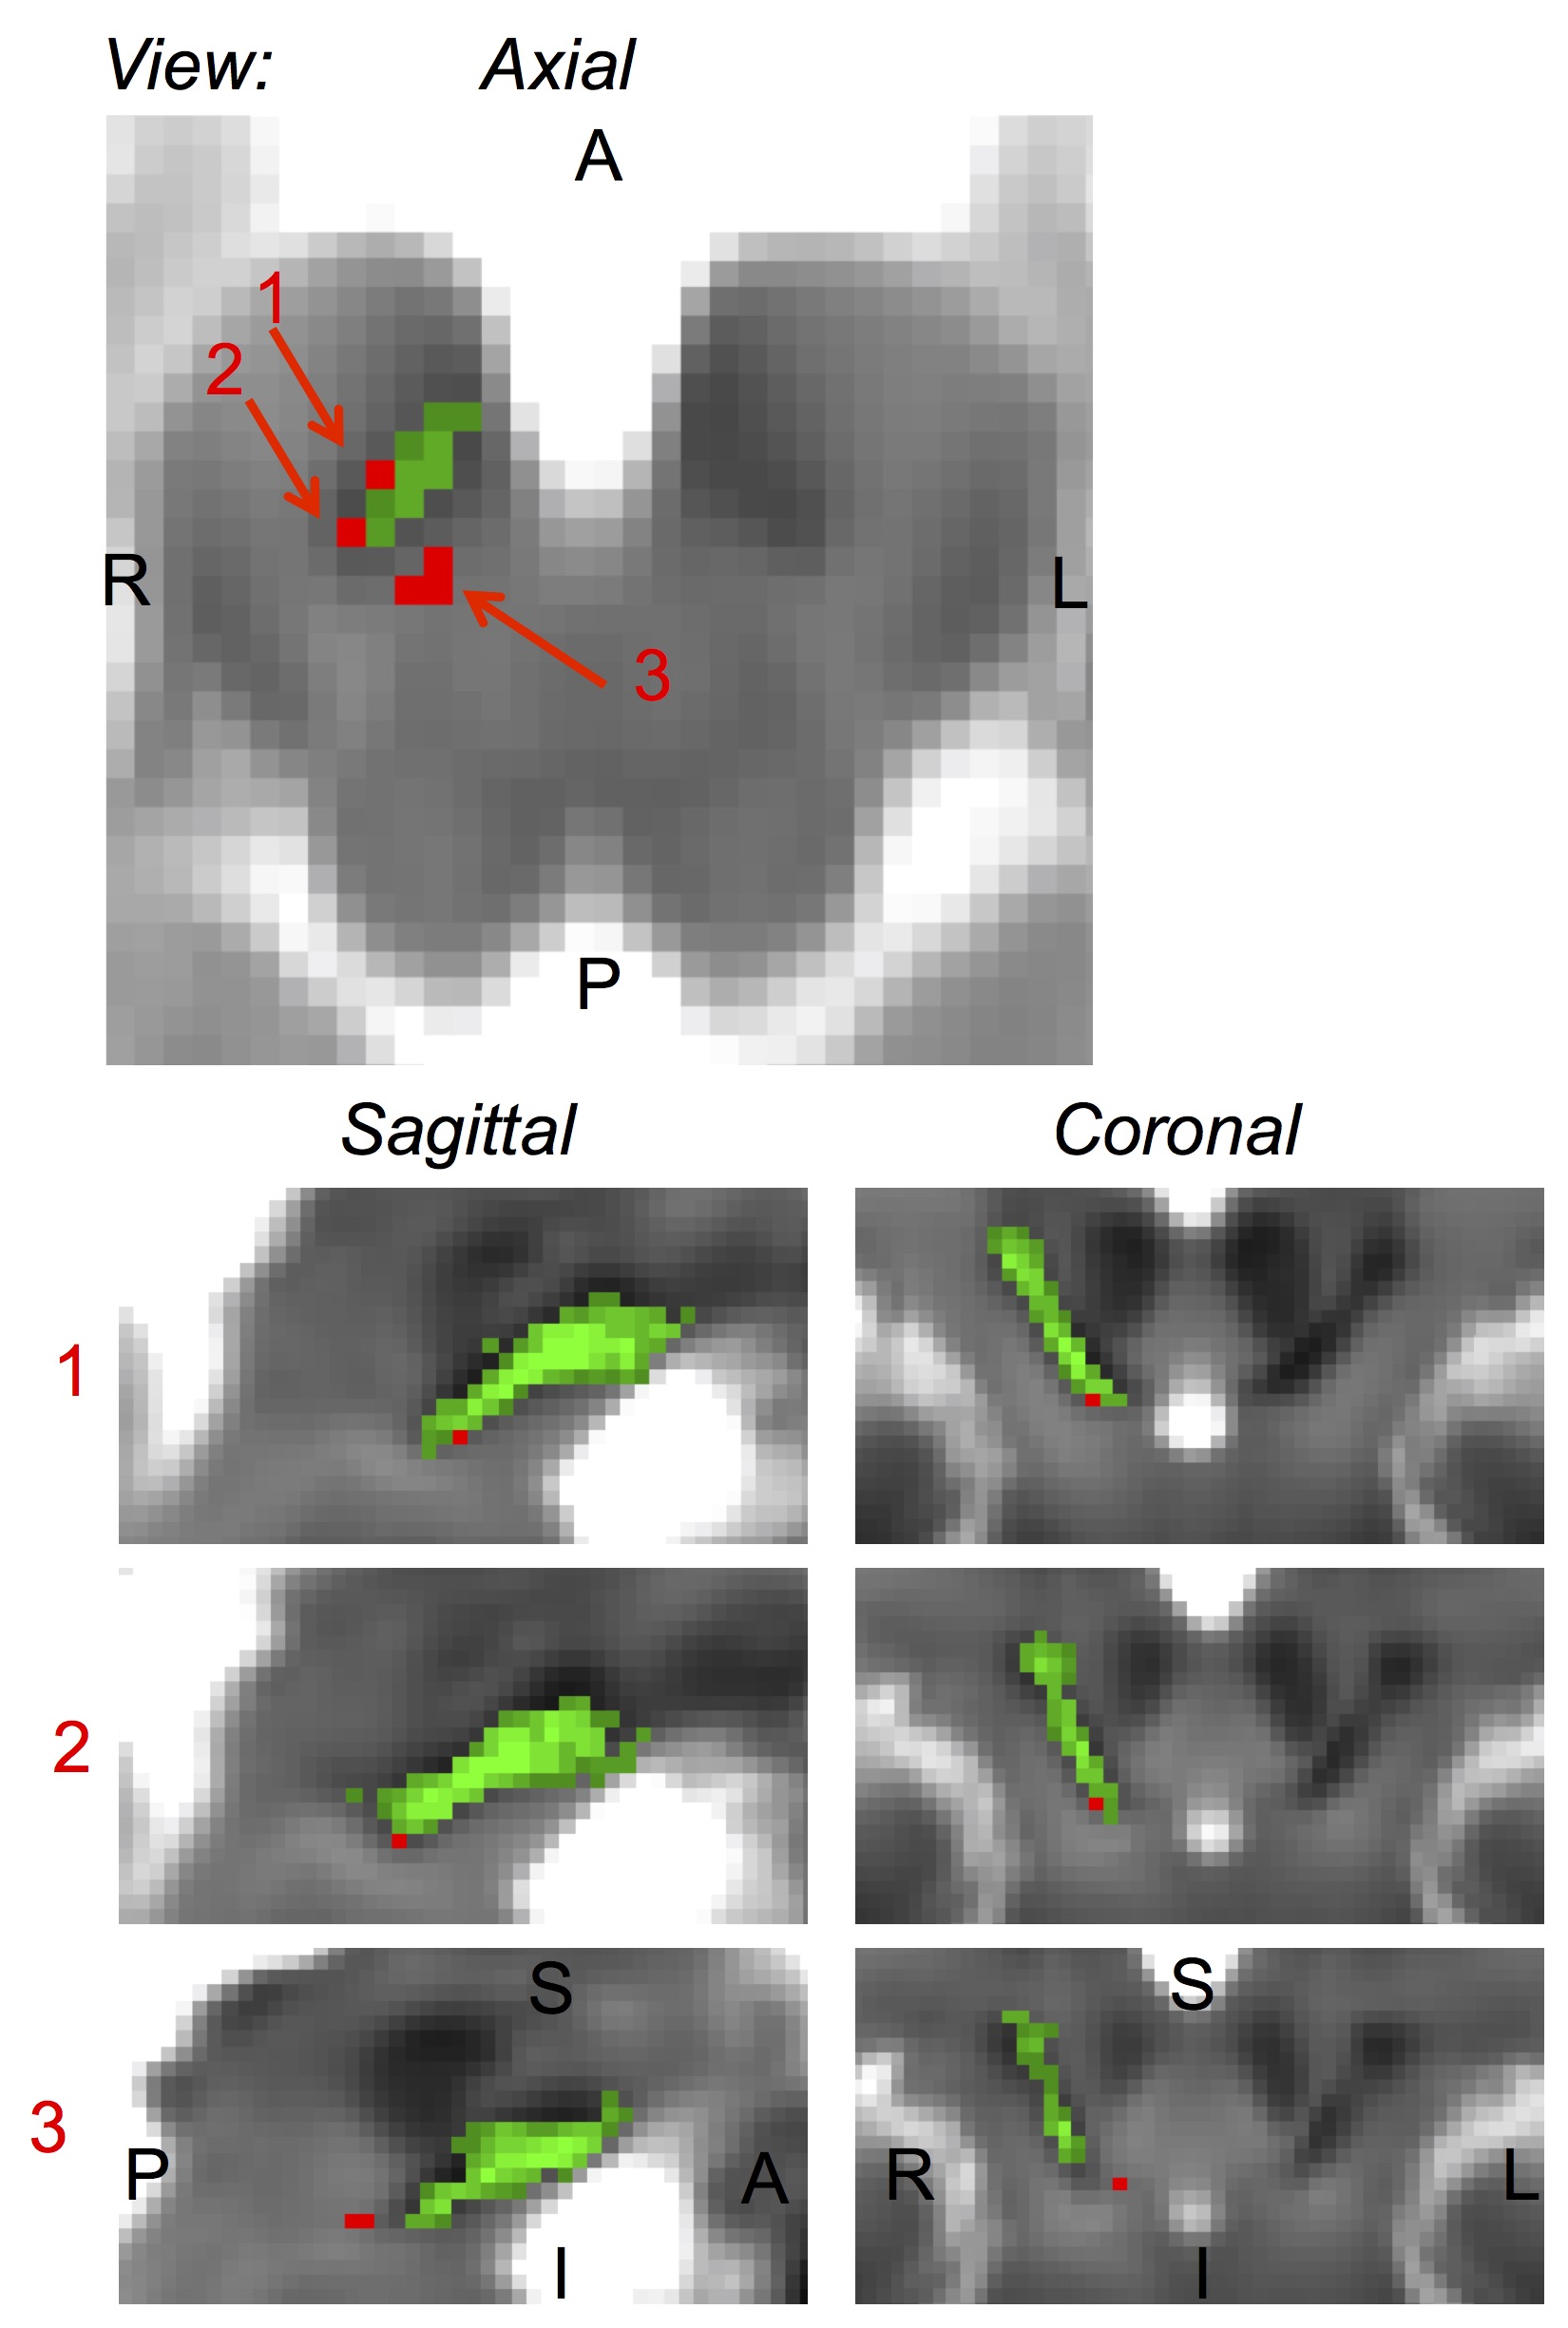
Data acquisition: Six patients with idiopathic-RBD (5m/1f, age 70 ± 1) underwent 7 Tesla MRI under IRB-approval. M2PRAGE image: echo-time (TE) = 2.39 ms, repetition-time (TR) = 5000 ms, inversion-times = [900 3200] ms, flip angles (FA) = [4° 5°], FOV = 156 ×158×180 mm3, 208×210×240 matrix, bandwidth = 330 Hz/pixel, GRAPPA-factor = 3, acquisition time: 9’32”. Multi-echo GRE image: TEs = [6.4 9.8 13.1 16.4 19.7 23.0] ms, TR = 3660 ms, FA = 55°, FOV = 82 ×158×180 mm3, 110×210×240 matrix, bandwidth = 330 Hz/pixel, GRAPPA-factor = 2, acquisition time: 9’38”. Data analysis: T1 maps were computed from the MP2RAGE. Regions of interest (ROI) displaying T1 hyperintensity (i.e. microstructural changes) within a brainstem mask were automatically detected by thresholding T1 maps at 2500 ms (threshold determined considering that intact gray-matter at 7 Tesla has a T1 value of ~1700-1900 ms [11]). To better evaluate the possible source of contrast in these ROIs, multi-echo GRE-signals were aligned to T1 maps by affine coregistration [12] and T2*-weighted signals changes in these ROIs inspected. To determine the location of these ROIs with respect to Bn of the arousal and motor system, we precisely coregistered T1 maps to the Bn atlas [10] (i.e. MNI) space through high-dimensional non-linear transformations [12]; an average map of these ROIs in MNI space across subjects was computed and overlaid to the Bn atlas.Results
Microstructural changes (i.e. ROIs with T1 hyperintensity) in the brainstem were detected in 5 out of 6 RBD patients (Figure 1). The volume of the ROIs with T1 hyperintensity ranged between .4 mm3 and 1.2 mm3. T1 hyperintensities colocalized with T2*-weighted signal increases (Figure 1). The average map of these ROIs in MNI space across subject is shown in a midbrain slice in Figure 2, superimposed on the atlas label of the SN-subregion1 [10].Discussion
Our findings demonstrated –consistently across RBD patients- the presence of microstructural changes in the right ventro-caudal part of the right SN-subregion1 (compatible with SNPR) and in a region rostro-medial to the caudal part of SN-subregion1. These results provide compelling empirical evidence for the hypothesized role of specific Bn nuclei in the pathogenesis of RBD (1,3). Interestingly, the observed contrast (hyperintensities in T1 and T2*-weighted MRI) in the detected ROIs is compatible with the presence of small lacunar infarcts (e.g. parenchymal spaces filled with CSF/interstitial-fluid) in the nigral and peri-nigral region of RBD patients. This original result differs from recent findings of iron accumulation in the SN of RBD patients [9].Conclusion
We foresee that ultra-high-field multi-contrast-MRI and our novel methods to localize Bn involved in arousal and motor functions [10] might bring new insight in the understanding of RBD mechanisms, by allowing a precise quantification of Bn microstructural damage and network disruption.Acknowledgements
NIH NIBIB K01EB019474; NIH NIBIB P41-RR014075.References
1. Boeve BF, Silber MH, Saper CB, et al. Pathophysiology of REM sleep behavior disorder and relevance to neurodegenerative disease. Brain. 2007;130:2770-2788. 2. Postuma RB. Prodromal Parkinson’s disease – using REM sleep behavior disorder as a window. Parkinsonism Relat Disord. 2014;Suppl1:S1-4. 3. Braak H, Del Tredici K, Rub U, et al. Staging of brain pathology related to sporadic Parkinson’s disease. Neurobiol Aging. 2003;24:197-211. 4. Kimura K, Tachibana N, Kohyama J, et al. A discrete pontine ischemic lesion could cause REM sleep behavior disorder. Neurology. 2000;55:894-895. 5. Plazzi G, Montagna P. Remitting REM sleep behavior disorder as the initial sign of multiple sclerosis. Sleep Medicine. 2002;3:437–439. 6. Provini F, Vetrugno R, Pastorelli F, et al. Status dissociatus after surgery for tegmental ponto-mesencephalic cavernoma: a state-dependent disorder of motor control during sleep. Movement Disorders. 2004;19:719-723. 7. Tippmann-Peikert M, Boeve BF, Keegan BM. REM sleep behavior disorder initiated by acute brainstem multiple sclerosis. Neurology. 2006;66:1277-1279. 8. Zambelis T, Paparrigopoulos T, Soldatos CR. REM sleep behavior disorder associated with a neurinoma of the left pontocerebellar angle. J Neurol Neurosurg Psychiatry. 2002;72:821-822. 9. De Marzi R, Seppi K, Hogl B, et al. Loss of dorsolateral nigral hyperintensity on 3.0 Tesla susceptibility-weighted imaging in idiopathic rapid eye movement sleep behavior disorder. Ann Neurol. 2016;79:1026-1030. 10. Bianciardi M, Toschi N, Edlow BE, et al. Toward an in vivo neuroimaging template of human brainstem nuclei of the ascending arousal, autonomic, and motor systems. Brain Connect. 2015;5:597-607. 11. Rooney WD, Johnson G, Li X, et al. Magnetic field and tissue dependencies of human brain longitudinal 1H2O relaxation in vivo. Magn Reson Med. 2007;57:308–318. 12. Avants BB, Tustison NJ, Song G, et al. A reproducible evaluation of ANTs similarity metric performance in brain image registration. Neuroimage. 2011;54:2033-2044.Figures