0790
Iron loss occurs in the deep gray matter of multiple sclerosis patients1Department of Pediatrics, Division of Neurology, University of British Columbia, Vancouver, Canada, 2UBC MRI Research Centre, University of British Columbia, Vancouver, Canada, 3Department of Physics and Astronomy, University of British Columbia, Vancouver, Canada, 4Department of Radiology, University of British Columbia, Vancouver, Canada, 5Department of Medicine, Division of Neurology, University of British Columbia, Vancouver, Canada, 6Centre for Brain Health, University of British Columbia, Vancouver, Canada, 7Department of Medical Genetics, University of British Columbia, Vancouver, Canada, 8Department of Neuroimmunology, Center for Brain Research, Medical University of Vienna, Vienna, Austria
Synopsis
In this work, a new approach for looking at the “iron deposition” in deep gray matter is presented. We investigated iron deposition in the deep gray matter indirectly by measuring R2*. In addition, we assessed the normalized volume of the structures of the DGM. We found a stronger association between increases in R2* and volume reductions of the same DGM structures in the MS group compared with the control group. Finally, we corrected the R2* measurements by the volume of the structures (R2*m). The R2*m values were reduced in the MS group suggesting that iron accumulation is not a common feature of MS but on the contrary a redistribution/reduction of the iron takes place, which may be masked by structural atrophy.
Introduction
Multiple sclerosis (MS) is an inflammatory, neurodegenerative disease, whose etiology is yet unknown, but is believed to be an interaction of several factors. In particular, it has been suggested that aberrant iron metabolism and abnormal iron deposition in the brain may be relevant to MS [1]. Magnetic resonance imaging techniques used to investigate the role of iron in MS found that iron excessively accumulates in the brain's deep gray matter (DGM), mainly in the basal ganglia [2]. On the other hand, brain volume loss has been reported to accompany the disease from very early stages on and has been correlated with disability progression and cognitive impairment in MS [3,4]. However, despite evidence that suggests increased iron levels in DGM, little attention has been paid to the influence that the simultaneously occurring shrinkage of the DGM can have on MR-based iron measurements. In this work, we present the analysis of iron deposition in DGM using R2* measurements weighted by the DGM structure volumes.Methods
39 patients with clinically definite MS and 30 non-related healthy controls (HC) were recruited. MS group: age range: 32–69yr, mean 49.7yr, Expanded Disability Status Scale: 0–6.5, median 3, disease duration: 3-41yr, mean 17.1yr. Controls group: age range: 30–69 yr, mean 50.7yr. Data were acquired on a 3T Philips Achieva scanner using an 8-channel phased array head coil. In addition to conventional MRI (PD-, T2-, T1-weighted scans), DTI data were acquired with an EPI sequence at 2.2x2.2x2.2mm3 and 0.83x0.83x2.2mm3 reconstructed (TR=7465ms, TE=75ms, b=1000, 16 directions). R2* data were acquired using a flow compensated gradient echo sequence with 5 echoes (TR=28ms, first TE=5ms, ΔTE=5ms; flip angle=17°; voxel size 0.9x1x1.6mm3 acquired and 0.8x0.8x0.8mm3 reconstructed; field of view = 230x165x110mm3). R2* maps were computed by voxel-wise fitting of a mono-exponential function using a correction for background field inhomogeneities, which were extracted from the unwrapped phase of the first two echoes. DGM regions of interest (ROIs) were registered from the MNI space to the SWI subject space via their FA maps using FSL's FNIRT and FLIRT tools. Blinded operators visually inspected registration and manually corrected ROIs based on venograms and FA maps. The ROIs were eroded by one voxel to avoid partial volume effects. Volumes normalized to the intracranial brain volume and average R2* values were computed for each structure. Finally, average R2* were corrected for the DGM volumes (R2*m = R2*×Volume) to account for potential tissue shrinkage effects. Statistical analysis was performed using ANOVA and Kruskal-Wallis to test significance between groups.Results
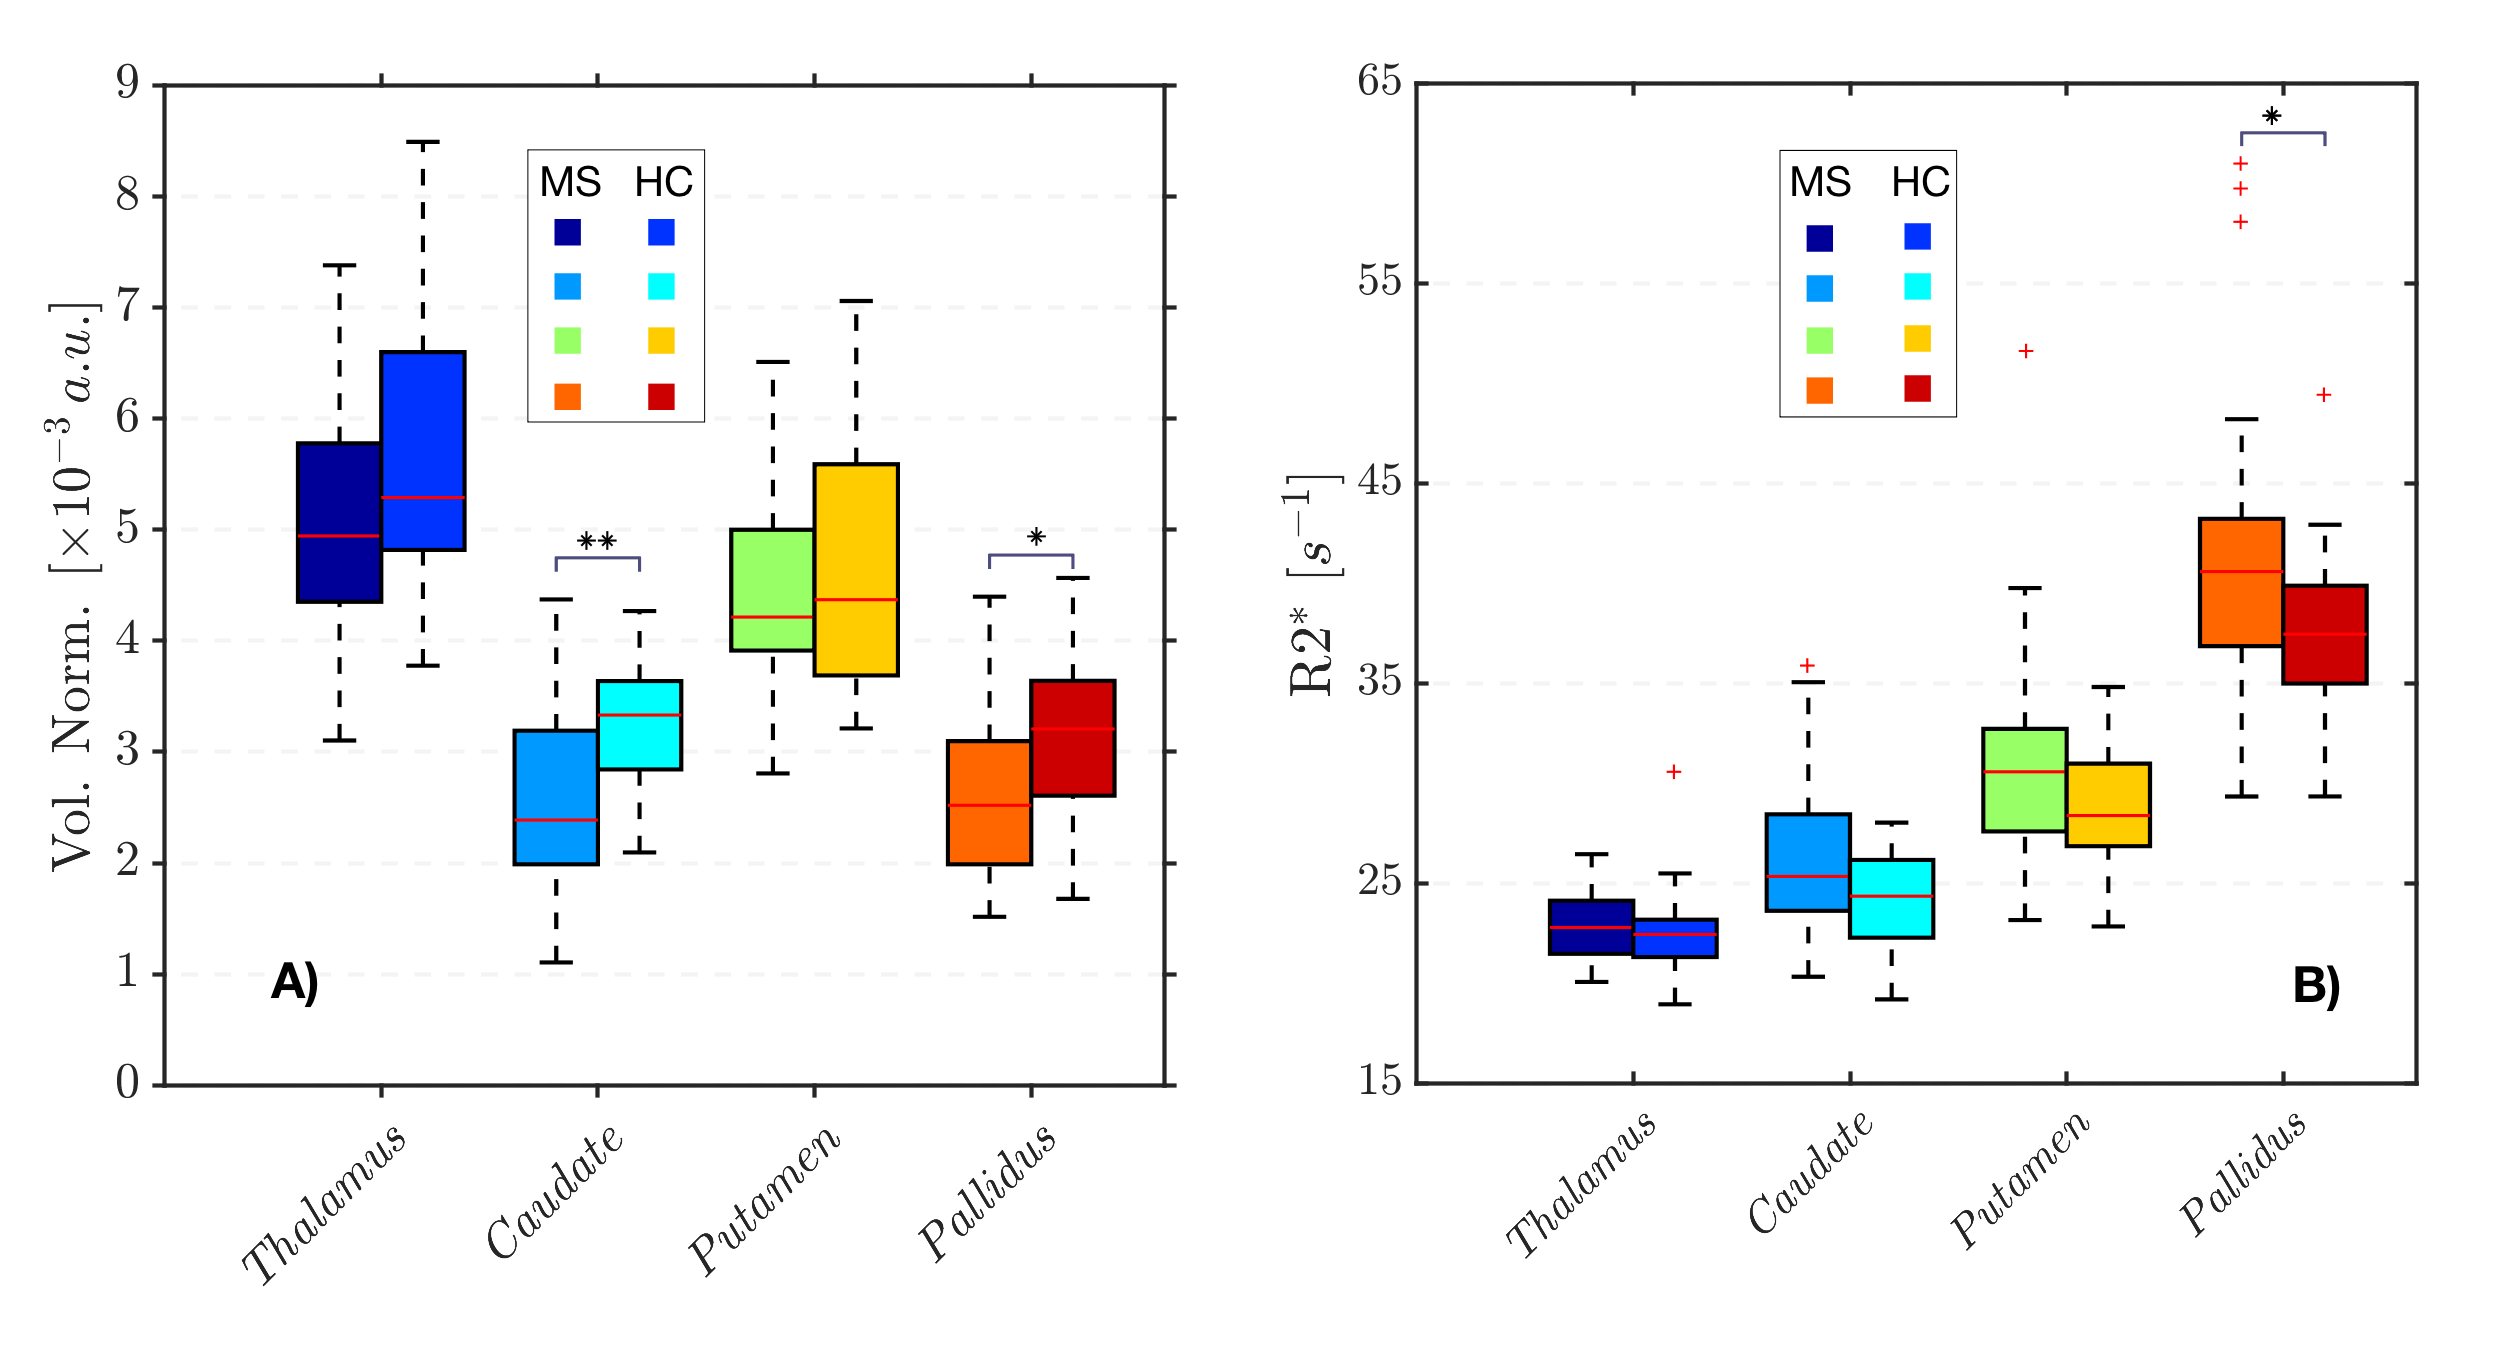
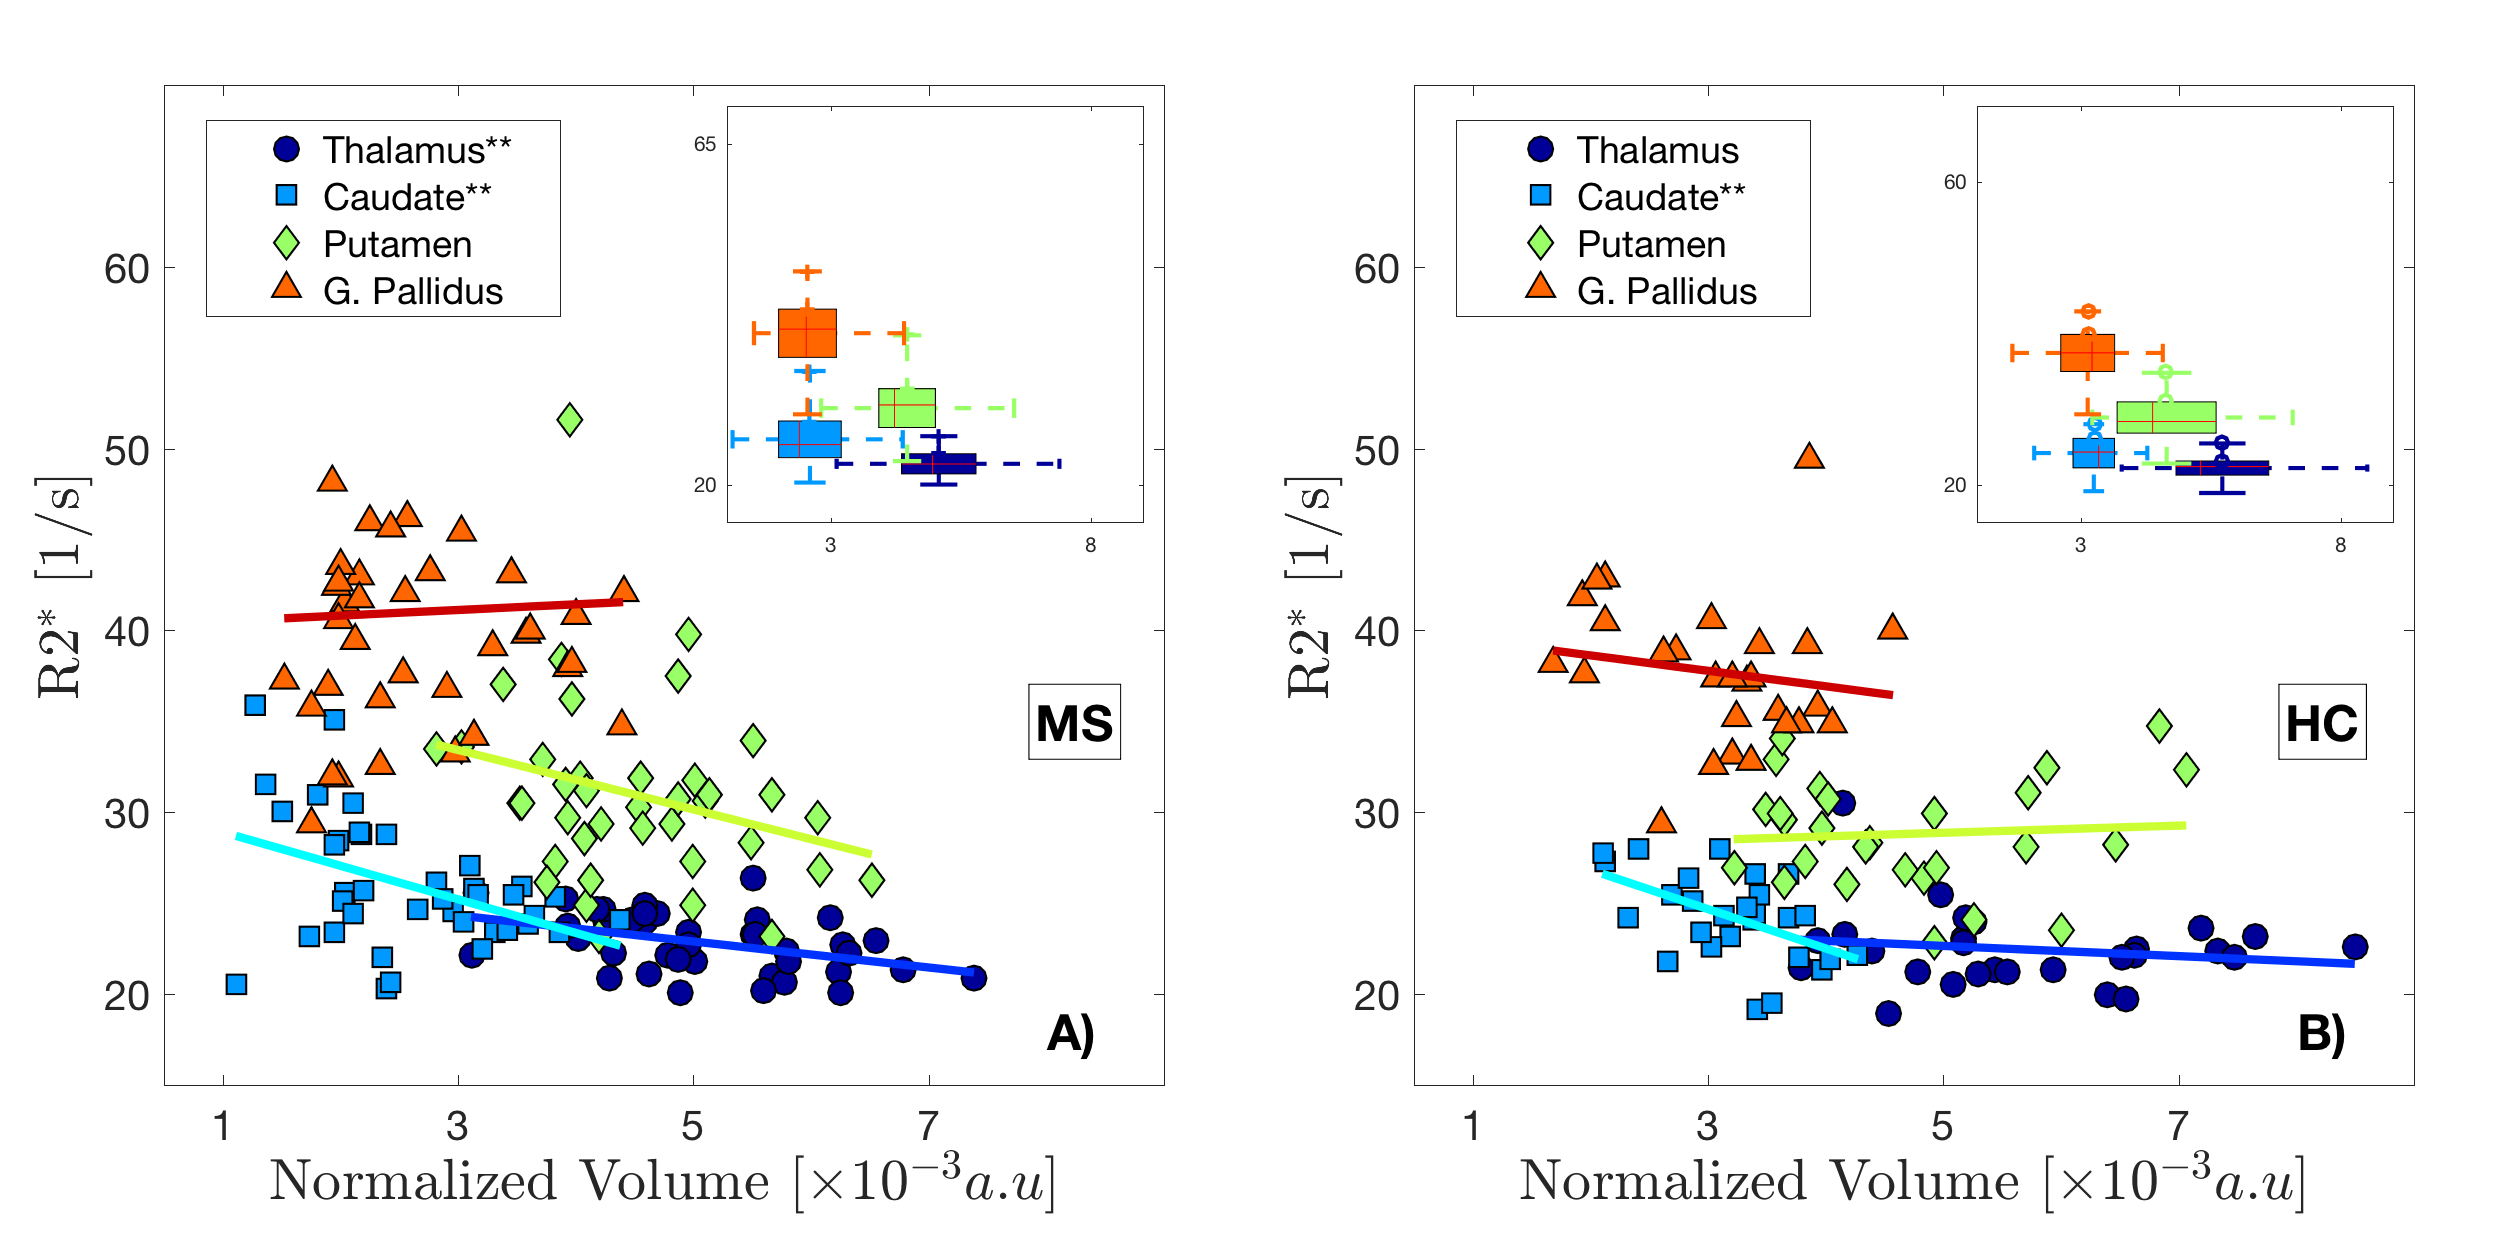
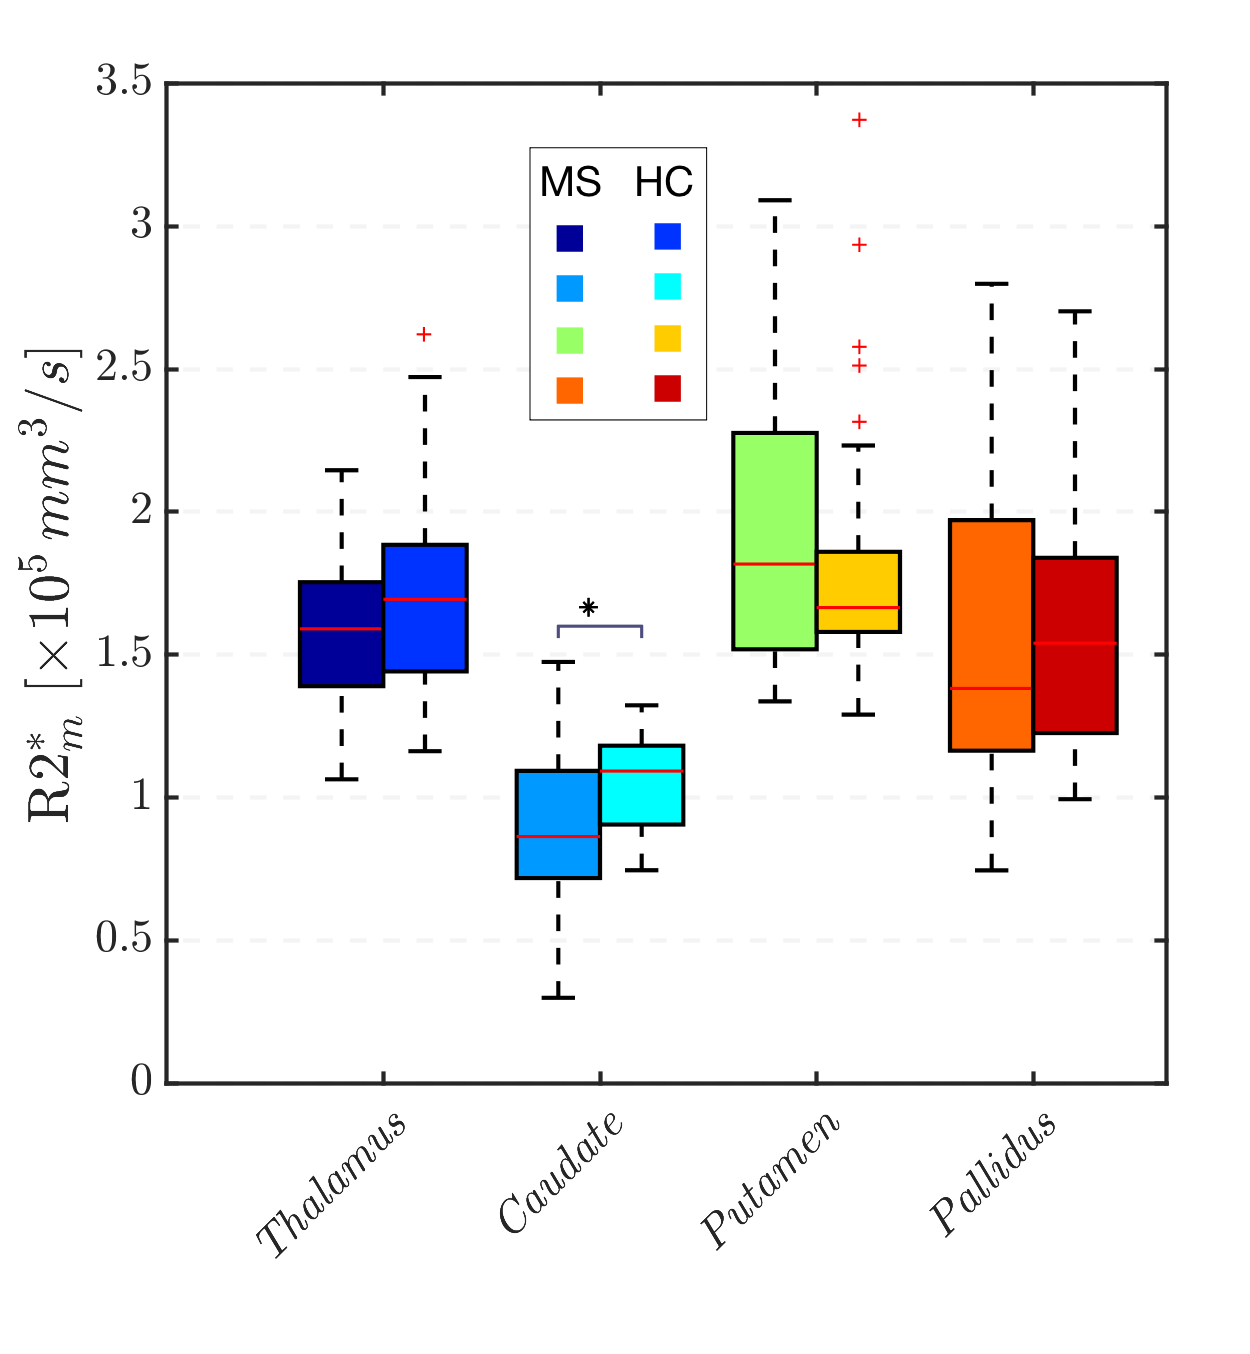
Volume reductions of all DGM structures (normalized and non-normalized) were a common feature of the MS group (figure 1.A) compared to the HC group, with significant differences in caudate and pallidus volumes. The uncorrected R2* values in the MS group were higher than in the HC group for all the structures (figure 1.B) with significant differences found in the pallidus. We showed that a strong relationships between R2* values within the structures and their volumes exist (figure 2), which was most pronounced for the caudate. After correcting R2* for the structural, deformed volumes, the resulting R2* mass (R2*m) indicates that the actual iron content responsible for the changes in R2* is smaller in all the MS brain DGM structures compared to HC, with exception of the putamen. In particular, the caudate showed a significant reduction in R2*m.Discussion
In this study, we treated the R2* values as a representation of the distribution (density) of iron within the DGM. As shown in figure 2, the R2* values are inversely related to the volumes of the structures. This strong relationship between R2* and volume, particularly seen in the MS group, can cause misinterpretation of the R2* results, if not accounted for, e.g leading to the common believe of excess iron deposition in DGM structures. When the volume is taken in account for R2* measurements (R2*m), we observe a reduction of the “R2* mass”. The finding that R2*m are smaller in the MS group suggests that iron accumulation may not be a common feature of MS, but that in fact a redistribution/reduction of the iron takes place, which can be masked by atrophy that leads to a higher iron concentration. Our observations agree well with the number of MS lesions reported in DGM structures [5], which appear with the highest prevalence in the caudate, and the subsequent iron and myelin loss expected in these regions of tissue damage, which both reduce R2*.Acknowledgements
The authors sincerely thank all of the volunteers and their families, and the UBC MRI Research Centre and its MRI technologists. The UBC MRI Research Centre thanks Philips Medical for continuing support. We wish to thank CONACyT for the financial support of E Hernandez- Torres.References
[1] Khalil, M., Enzinger, C., Langkammer, C., et al. Quantitative assessment of brain iron by R2* relaxometry in patients with clinically isolated syndrome and relapsing-remitting multiple sclerosis. Mult. Scler. 2009;15, 1048–1054.
[2] Hallgren, B., Sourander, P. The effect of age on the non-haemin iron in the human brain. J. Neurochem. 1958;3, 41–51.
[3] Filippi M, Rocca M. Preventing brain atrophy should be the gold standard of effective theraphy in MS (after the first year of treatment): no. Mult Scler. 2013;19:1005–6.
[4] Rudick RA, Fisher E. Preventing brain atrophy should be the gold standard of effective therapy in MS (after the first year of treatment): yes. Mult Scler. 2013;19:1003–4.
[5] Haider L, Simeonidou C, Steinberger G, et al. Multiple sclerosis deep grey matter: the relation between demyelination, neurodegeneration, inflammation and iron. JNNP. 2014; 85:1386–1395.
Figures