0789
Decreasing magnetic susceptibility (QSM) of thalamic nuclei in Multiple Sclerosis (MS) – the thalamus as a target of projected inflammation?1Buffalo Neuroimaging Analysis Center, Department of Neurology, Jacobs School of Medicine and Biomedical Sciences, University at Buffalo, The State University of New York, Buffalo, NY, United States, 2MRI Clinical and Translational Research Center, Jacobs School of Medicine and Biomedical Sciences, University at Buffalo, The State University of New York, Buffalo, NY, United States, 3BairdMS Center, Department of Neurology, Jacobs School of Medicine and Biomedical Sciences, The State University of New York at Buffalo, Buffalo, NY, United States, 4MR Research Laboratory, IRCCS, Don Gnocchi Foundation ONLUS, Milan, Italy
Synopsis
This work studied intra-thalamic magnetic susceptibility changes in 120 patients with clinically isolated syndrome (CIS), relapsing-remitting MS (RRMS), and secondary progressive MS (SPMS). We detected decreased magnetic susceptibility in several nuclear groups of the thalamus in MS patients compared to controls, indicative of decreased iron concentration.
Purpose
Mounting evidence exists that that Multiple Sclerosis (MS) is associated with an accumulation of iron in the deep gray matter (DGM)1. However, the general notion that the disease is related to increased brain iron (accumulation) has recently been challenged by histological results indicating decreased iron in normal-appearing white matter (WM)2 as well as by in vivo findings with Quantitative Susceptibility Mapping (QSM)3-6, suggesting decreased iron concentrations in the thalamus7.
The thalamus consists of various functional sub-regions, which maintain afferent and efferent connections with different brain regions8, warranting a closer inspection of their involvement in reduced thalamic magnetic susceptibility.
In the present work, we investigated intra-thalamic susceptibility changes in patients with clinically isolated syndrome (CIS), relapsing-remitting MS (RRMS), and secondary progressive MS (SPMS).
Methods
Subjects: This IRB-approved retrospective study enrolled 40 patients with CIS (29 female; 36.9±9.9 years; EDSS median 1.5, IQR 0.5-2.5; 2.2±2.7yrs disease duration), 40 with RRMS (27 female; 43.6±10.1 years; EDSS 2.0, 1-3; 9.9±6.2 years disease duration), and 40 with SPMS (29 female; 52.0±7.0 years; EDSS 6.5, 4-9; 23.9±10.2 years disease duration). To address age differences between the three groups, 120 age- and sex-matched (p>0.8) healthy controls (HC) were enrolled (40 each patient group).
Data acquisition: MRI was performed at 3T (GE Signa Excite HD 12.0) using a 3D single-echo gradient-echo (GRE) sequence (matrix 512x192x64, 256x192x128mm3, TE/TR=22ms/40ms, BW=13.9kHz, tip=12°). We reconstructed magnetic susceptibility maps from k-space using scalar-phase-matching9,10, gradient unwarping11, best-path unwrapping12, V-SHARP13-15, and HEIDI16.
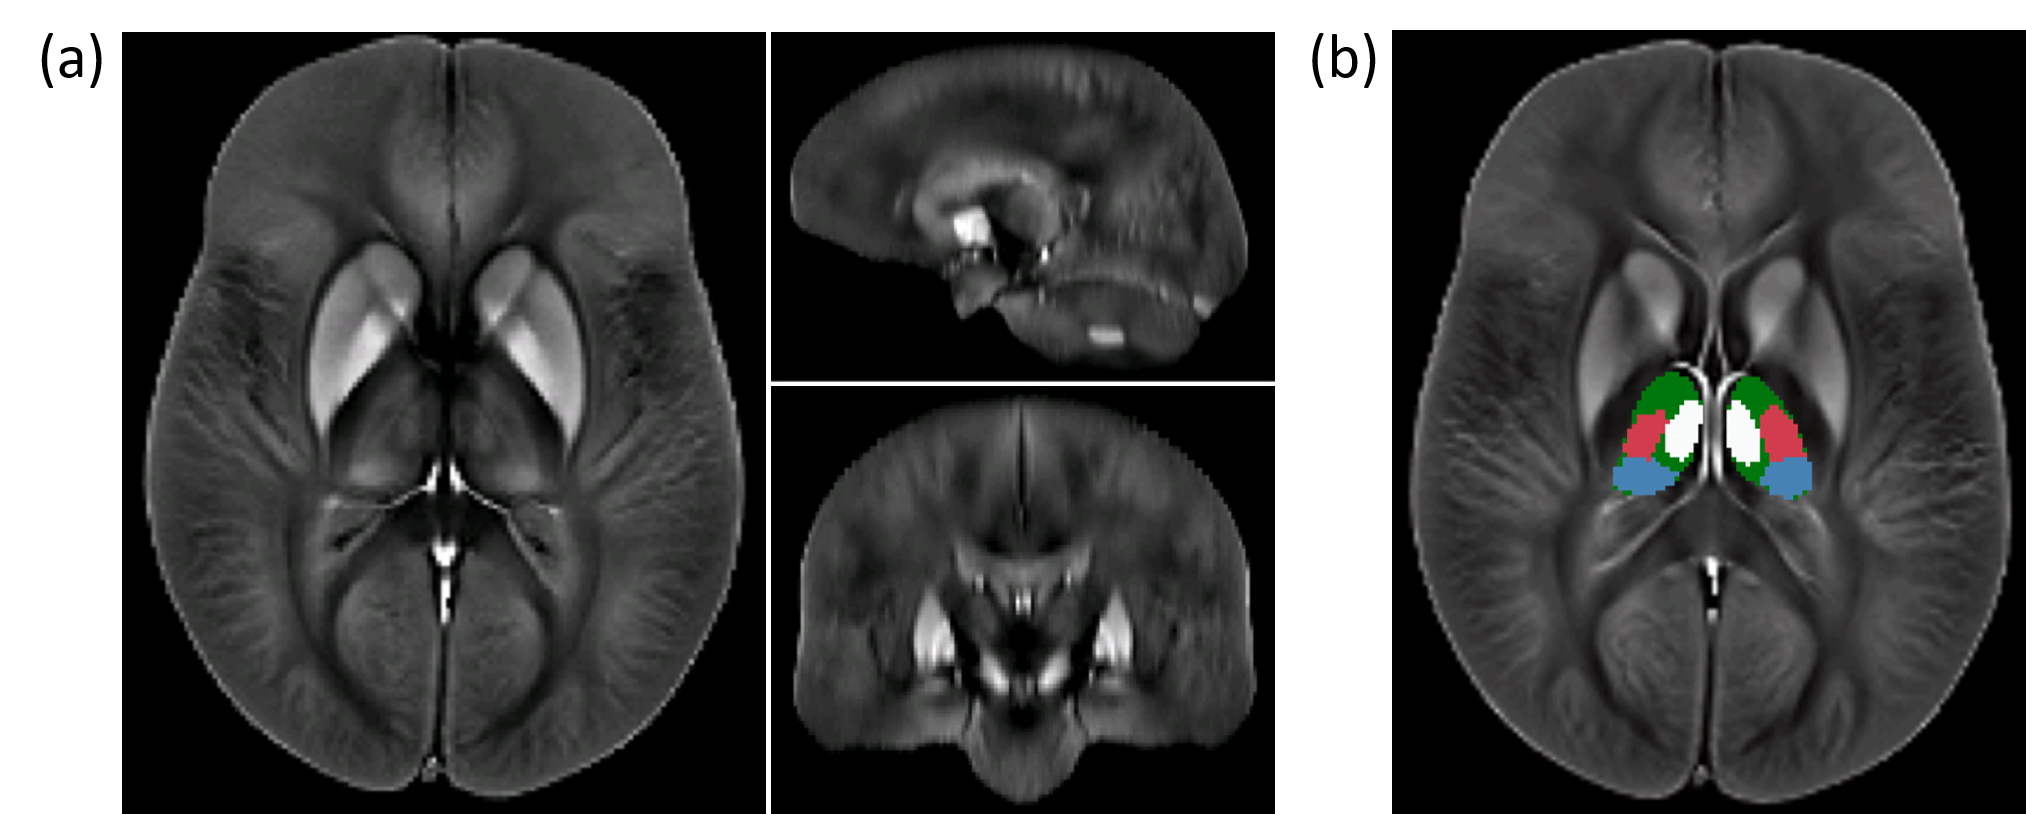
Analysis: Following normalization of the susceptibility maps to an in-house generated susceptibility brain template using ANTs (Figure 1a), we applied a manually defined atlas to measure the average susceptibility in pulvinar, the medial nuclear region (MNR), lateral nuclear region (LNR), and the whole thalamus (WT) (Figure 1b). Group comparisons relied on Student’s t-test with p<0.05. We also performed voxel-wise statistical analysis via non-parametric permutation tests (FSL randomise; 5000 permutations) using age and sex as covariates. Resulting maps revealed significant differences between groups at p<0.05, using Threshold-Free Cluster Enhancement (TFCE), and controlling for family-wise error rate. The number of comparisons was reduced by restricting the statistical analysis to voxels within the WT.
Results
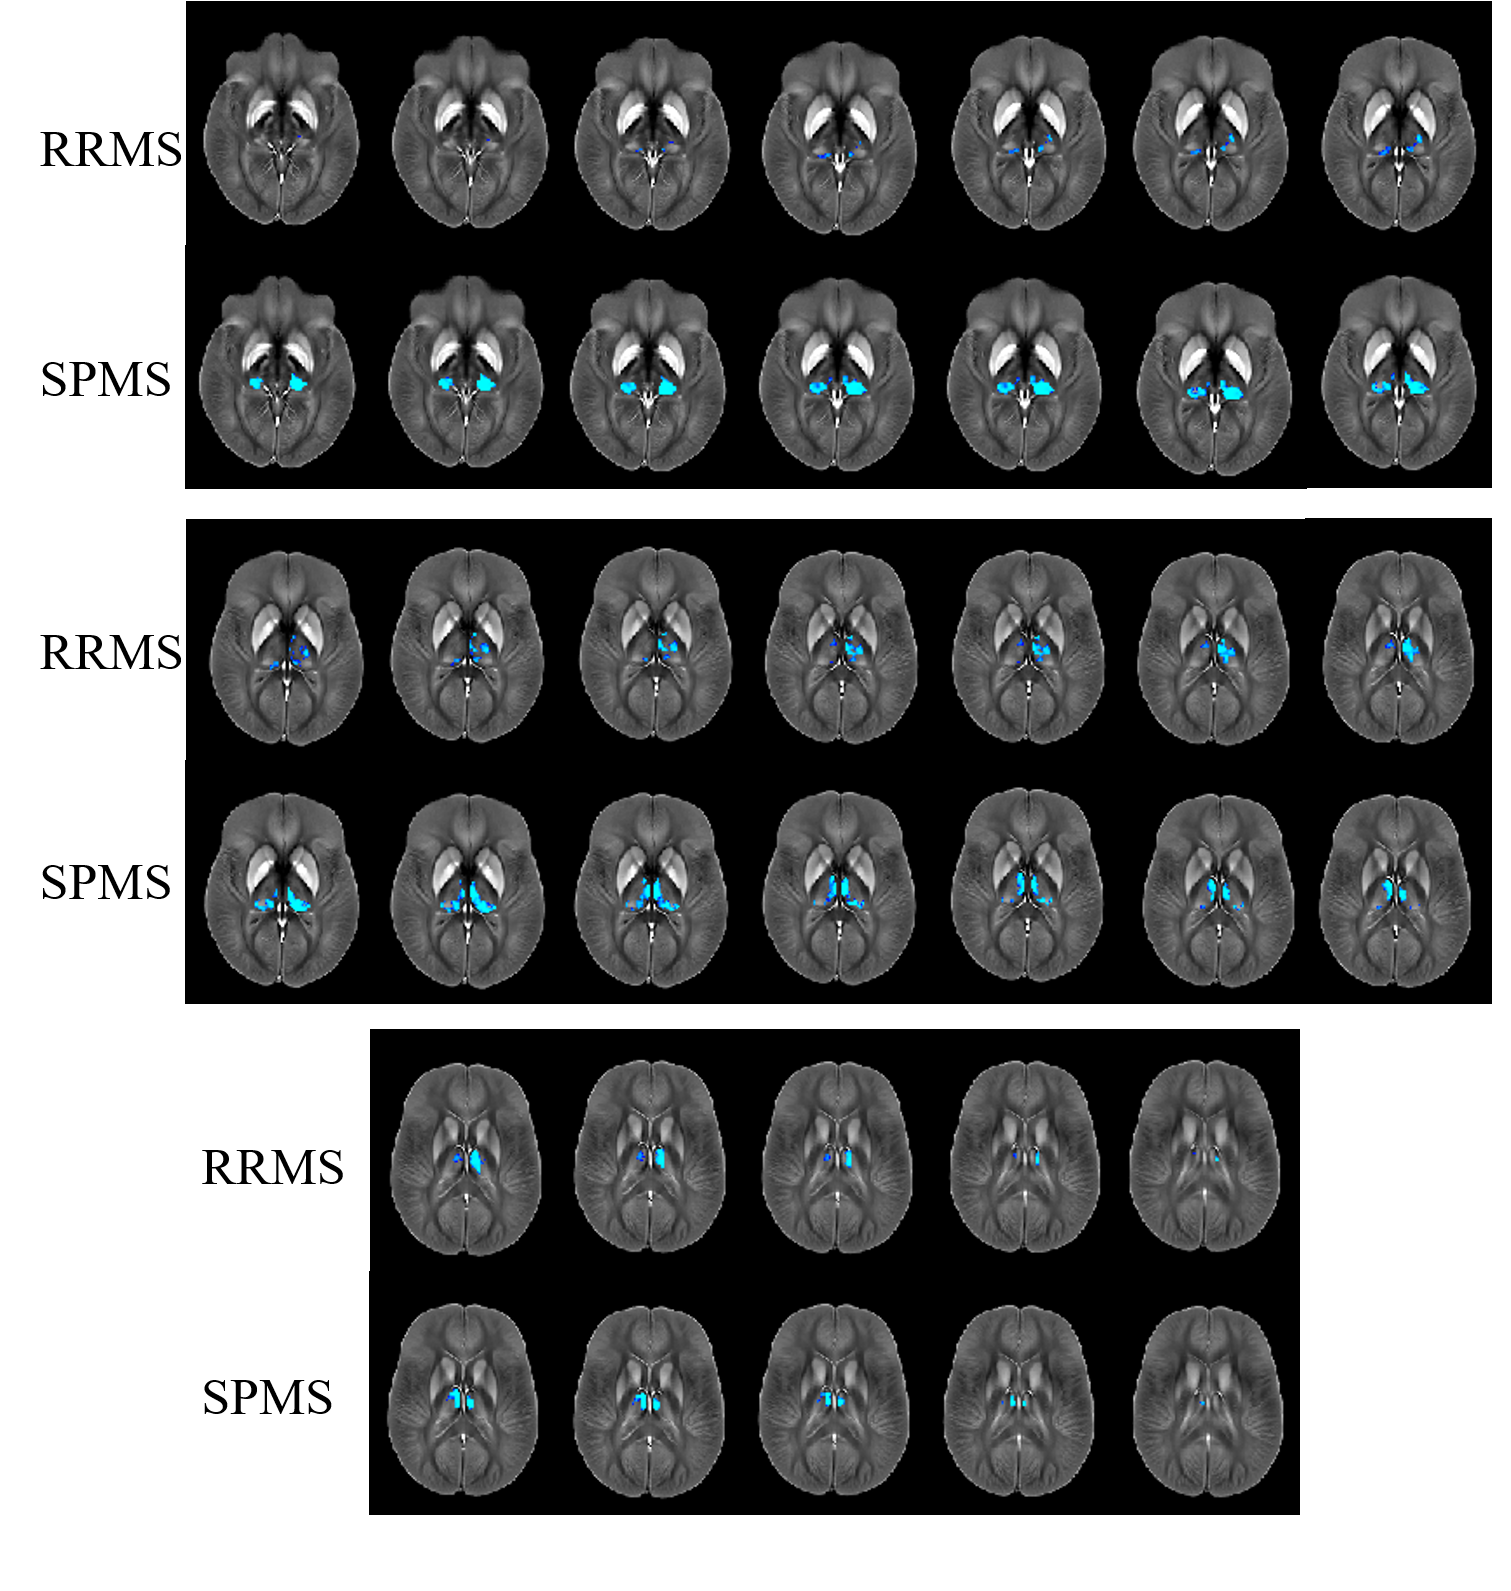
Figure 2 shows results of the voxel-based analysis (VBA). No differences were found between the three control groups, indicating a negligible effect of normal aging on thalamic susceptibility in the age range studied. No differences were observed between CIS and CIS-HC. In RRMS, susceptibility was reduced relative to HCs bilaterally in the pulvinar (posterior and medial subdivisions of the inferior nuclei), and in the LNR (ventral posterolateral) and MNR (medial dorsal nuclei; superior part of medial cell mass) of the right hemisphere. The left thalamus was widely unaffected with reduced susceptibility in only a small region in the MNR. In SPMS, differences relative to HCs were more symmetric. Susceptibility was reduced bilaterally in the MNR (medial dorsal) and the pulvinar (right: whole; left: lateral division of the medial pulvinar unaffected), but not in the ventral posterolateral nucleus of the LNR (as in RRMS).
Atlas-based results were in line with VBA: RRMS showed susceptibility reduction in WT, bilateral MNR, right LNR, and bilateral pulvinar. In SPMS, magnetic susceptibility reduction relative to HCs reached significance in all regions except the LNR.
Discussion
Hametner et al.2 suggested that iron loss and a decreased number of oligodendrocytes is related to chronic microglial activation in WM because activated microglia express high levels of pro-inflammatory cytokines17 that have a toxic, iron-releasing effect on oligodendrocytes18 (TNF-α and interferon-γ). Liberated iron may be taken up or cycled by microglia and subsequently, be cleared. Most notably, due to the central role of the thalamus in several brain networks, neuroinflammatory responses to the wide-spread attack of cortical GM (which can be projected bidirectionally along cortico-thalamic connections19 may induce a continuous, focused microglial response in the ipsilateral thalamus20-22. In fact, increased thalamic microglial activation in MS has been visualized by [11C](R)-PK11195 PET23-25. The continuous weakening of myelinating oligodendrocytes and reduced protection of axons in the thalamus could be a key mechanism of MS leading to damage in this region, detected by QSM. The particularly strong effects in the pulvinar may be related to its integral role in the visual attention network26, innervating nearly all known extra-striate visual areas27. However, histopathological studies need to confirm that reduced thalamic magnetic susceptibility is indeed related to changes in the iron homeostasis and exclude another biophysical origin.Conclusion
QSM at 3T detects decreased magnetic susceptibility in thalamic subnuclei of MS patients, indicative of decreased iron concentration.Acknowledgements
Research reported in this publication was funded by the National Center for Advancing Translational Sciences of the National Institutes of Health under Award Number UL1TR001412. The content is solely the responsibility of the authors and does not necessarily represent the official views of the NIH.References
[1] C. Stüber, D. Pitt, and Y. Wang, “Iron in Multiple Sclerosis and Its Noninvasive Imaging with Quantitative Susceptibility Mapping,” Int J Mol Sci, 17(1):100, 2016.
[2] S. Hametner, I. Wimmer, L. Haider, S. Pfeifenbring, W. Brück, and H. Lassmann, “Iron and neurodegeneration in the multiple sclerosis brain.” Ann Neurol, 47(6):848-861, 2013.
[3] C. Liu, W. Li, K. A. Tong, K. W. Yeom, and S. Kuzminski, “Susceptibility-weighted imaging and quantitative susceptibility mapping in the brain,” J Magn Reson Imaging, 42(1):23-41, 2015.
[4] E. M. Haacke, S. Liu, S. Buch, W. Zheng, D. Wu, and Y. Ye, “Quantitative susceptibility mapping: current status and future directions,” Magn Reson Imaging, 33(1), 1–25, 2015.
[5] J. R. Reichenbach, F. Schweser, B. Serres, and A. Deistung, “Quantitative Susceptibility Mapping: Concepts and Applications,” Clin Neuroradiol, 25(S2):225–230, 2015.
[6] Y. Wang and T. Liu, “Quantitative susceptibility mapping (QSM): Decoding MRI data for a tissue magnetic biomarker,” Magn Reson Med, 73(1), 82–101, 2015.
[7] J. Hagemeier, F. Schweser, M. G. Dwyer, P. Polak, N. P. Bergsland, B. Weinstock-Guttman, and R. Zivadinov, “Evolution of Brain Iron Levels in Multiple Sclerosis: A 2-Year Longitudinal Quantitative Susceptibility Mapping Study at 3T,” American Academy of Neurology 2016, P4.163.
[8] A. Minagar, M. H. Barnett, R. H. B. Benedict, D. Pelletier, I. Pirko, M. A. Sahraian, E. Frohman, and R. Zivadinov, “The thalamus and multiple sclerosis: modern views on pathologic, imaging, and clinical aspects.” Neurology, 80(2):210–9, 2013.
[9] J. A. de Zwart, P. J. Ledden, P. Kellman, P. van Gelderen, and J. H. Duyn, “Design of a SENSE-optimized high-sensitivity MRI receive coil for brain imaging.” Magn Reson Med, 47(6):1218–27, 2002.
[10] K. E. Hammond, J. M. Lupo, D. Xu, M. Metcalf, D. A. C. Kelley, D. Pelletier, S. M. Chang, P. Mukherjee, D. B. Vigneron, and S. J. Nelson, “Development of a robust method for generating 7.0 T multichannel phase images of the brain with application to normal volunteers and patients with neurological diseases.” NeuroImage, 39(4):1682–1692, 2008.
[11] P. Polak, R. Zivadinov, and F. Schweser, “Gradient Unwarping for Phase Imaging Reconstruction,” ISMRM 2015, p1279.
[12] H. S. Abdul-Rahman, M. A. Gdeisat, D. R. Burton, M. J. Lalor, F. Lilley, and C. J. Moore, “Fast and robust three-dimensional best path phase unwrapping algorithm.” Appl Opt, 46(26):6623–35, 2007.
[13] F. Schweser, A. Deistung, B. W. Lehr, and J. R. Reichenbach, “Quantitative imaging of intrinsic magnetic tissue properties using MRI signal phase: An approach to in vivo brain iron metabolism?” NeuroImage, 54(4):2789–2807, 2011.
[14] P. S. Özbay, A. Deistung, X. Feng, D. Nanz, J. R. Reichenbach, and F. Schweser, “A comprehensive numerical analysis of background phase correction with V-SHARP,” NMR Biomed (epub)
[15] B. Wu, W. Li, A. Guidon, and C. Liu, “Whole brain susceptibility mapping using compressed sensing.” Magn Reson Med, 24:1129–36, 2011.
[16] F. Schweser, K. Sommer, A. Deistung, and J. R. Reichenbach, “Quantitative susceptibility mapping for investigating subtle susceptibility variations in the human brain.” NeuroImage, 62(3):2083–2100, 2012.
[17] X. Zhang, N. Surguladze, B. Slagle-Webb, A. Cozzi, and J. R. Connor, “Cellular iron status influences the functional relationship between microglia and oligodendrocytes,” Glia, 54(8):795–804, 2006.
[18] X. Zhang, M. Haaf, B. Todorich, E. Grosstephan, H. Schieremberg, N. Surguladze, and J. R. Connor, “Cytokine toxicity to oligodendrocyte precursors is mediated by iron,” Glia, 52(3):199–208, 2005.
[19] R. B. Banati, “Visualising microglial activation in vivo,” Glia, 40(2):206–217, 2002.
[20] R. Myers, L. G. Manjil, R. S. Frackowiak, and J. E. Cremer, “[3H]PK 11195 and the localisation of secondary thalamic lesions following focal ischaemia in rat motor cortex,” Neurosci Letters, 133(1):20–24, 1991.
[21] J. Sørensen, I. Dalmau, J. Zimmer, and B. Finsen, “Microglial reactions to retrograde degeneration of tracer-identified thalamic neurons after frontal sensorimotor cortex lesions in adult rats,” Exp Brain Res, 112(2), 1996.
[22] S. Pappata, M. Levasseur, R. N. Gunn, R. Myers, C. Crouzel, A. Syrota, T. Jones, G. W. Kreutzberg, and R. B. Banati, “Thalamic microglial activation in ischemic stroke detected in vivo by PET and [11C]PK11195,” Neurology, 55(7):1052–1054, 2000.
[23] E. Rissanen, J. Tuisku, J. Rokka, T. Paavilainen, R. Parkkola, J. O. Rinne, and L. Airas, “In Vivo Detection of Diffuse Inflammation in Secondary Progressive Multiple Sclerosis Using PET Imaging and the Radioligand C-11-PK11195,” J Nuc Med, 55(6):939–944, 2014.
[24] R. B. Banati, J. Newcombe, R. N. Gunn, a. Cagnin, F. Turkheimer, F. Heppner, G. Price, F. Wegner, G. Giovannoni, D. H. Miller, G. D. Perkin, T. Smith, a. K. Hewson, G. Bydder, G. W. Kreutzberg, T. Jones, M. L. Cuzner, and R. Myers, “The peripheral benzodiazepine binding site in the brain in multiple sclerosis: quantitative in vivo imaging of microglia as a measure of disease activity.” Brain, 123(1):2321–2337, 2000.
[25] U. Kauzner, Y. Kang, E. Morris, N. Nealon, J. S. Perumal, T. Vartanian, and S. A. Gauthier, “Uptake of [C11]PJK11195 in the thalamus of Multiple Sclerosis (MS) patients versus Healthy Controls (HC),” ECTRIMS 2016.
[26] E. E. Benarroch, “Pulvinar: Associative role in cortical function and clinical correlations,” Neurology, 84(7):738–747, 2015.
[27] S. M. Sherman and R. W. Guillery, “The role of the thalamus in the flow of information to the cortex.” Phil Trans R Soc Lond B, 357(1428):1695–708, 2002.
Figures