0785
Respiratory Phase-Matched MR-based Attenuation Correction (MRAC) for Four-Dimensional (4D) PET in PET/MRI: A Feasibility Study1Radiology and Biomedical Imaging, UCSF, San Francisco, CA, United States, 2GE Global Research
Synopsis
PET/MRI is capable of simultaneous respiratory motion-resolved four-dimensional (4D) PET/4D MRI data acquisitions. Therefore, it is important to develop a clinically applicable method for respiratory phase-matched MR-based attenuation correction (MRAC) for accurate 4D PET quantification. This study proposed 4D MRAC protocols modifying the current MRAC protocol and evaluated their performance using a patient with liver metastases. For qualitative analysis, 4D MRAC improved phase-mismatch at the lung/liver interface substantially. For quantitative analysis, 4D MRAC improved PET quantification by 10-30% increase of PET-avid tumor uptake values, compared to static MRAC, specifically for the tumors located at the lung/liver interface.
Purpose
Integrated PET/MRI enables simultaneous acquisition of PET and MRI data. In order to take advantage of simultaneous PET/MRI, it is very important to perform accurate MR-based attenuation correction (MRAC) for qualitative and quantitative PET. A clinical standard for MRAC is to convert MR images, acquired from two-point Dixon sequences in free breathing, to pseudoCT images1. However, for organs such as liver, substantial respiratory motion could happen and cause a phase-mismatch between MRAC maps and gated PET images. Therefore, this study aims to develop respiratory phase-matched MRAC methods for four-dimensional (4D) PET in a simultaneous PET/MRI study.Methods
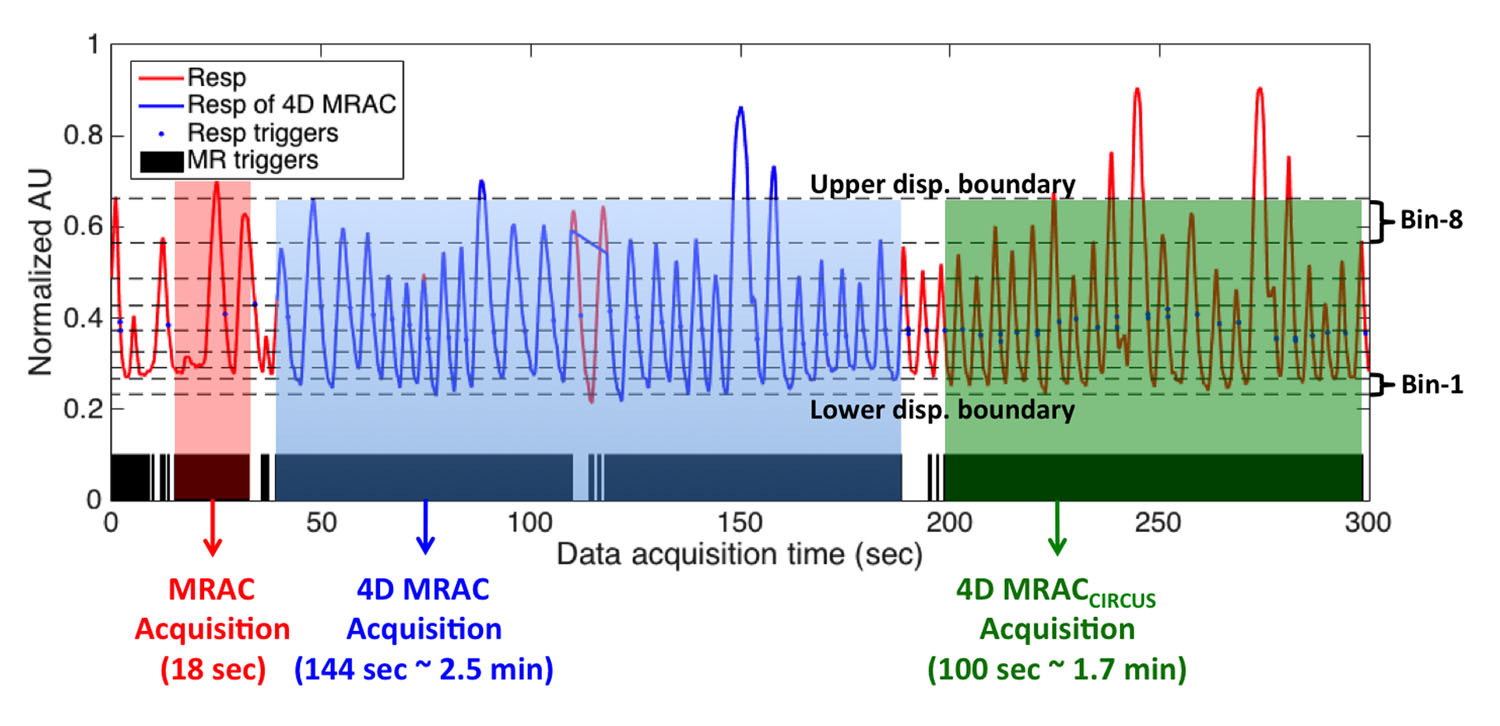
Three MRAC data sets were acquired and used for 4D PET AC (Figure 1): First, two-echo Dixon 3D spoiled-gradient echo imaging (MRAC) were applied during free breathing1, with TR/TE1/TE2 = 4.0/1.3/2.6 ms, FA= 5o, acquisition time of 18 sec, FOV=50cm, matrix size: 256×256×120, and voxel size=1.95×1.95×5.2 mm3 (interpolated to slice thickness of 2.6mm). This is the current implementation for SIGNA PET/MR (GE Healthcare, Waukesha, WI). Second, the MRAC sequence was repeated eight times (18 × 8 = 144 sec) and 4D MR images were reconstructed retrospectively with displacement-based soft-gating using an external respiratory trace (4D MRAC). Third, CIRcular Cartesian UnderSampling (CIRCUS) strategy combined with compressed sensing2 was also applied to accelerate data acquisition and generate respiratory self-gated 4D images (4D MRACCIRCUS = 100 sec). For MR temporal sample ordering, the 4D MRAC repeatedly sampled the two phase encode dimensions in a sequential, cartesian order; while, 4D MRACCIRCUS sampled the two phase encode dimensions in a pseudo-random order based on golden angle rotations. 4D MRAC and 4D MRACCIRCUS data were sorted into eight displacement-based bins with similar number of samples to maintain a similar image quality, and then in-phase, out-of-phase, water and fat images were generated according to each bin. Then MR values were converted to continuous CT numbers (Hounsfield Unit) using the weighted sum of water/fat values1. The 4D MRAC protocols (4D MRAC and 4D MRACCIRCUS) were applied on one subject that underwent a liver-focused 68Ga-DOTA-TOC PET/MRI (20 min).
Results
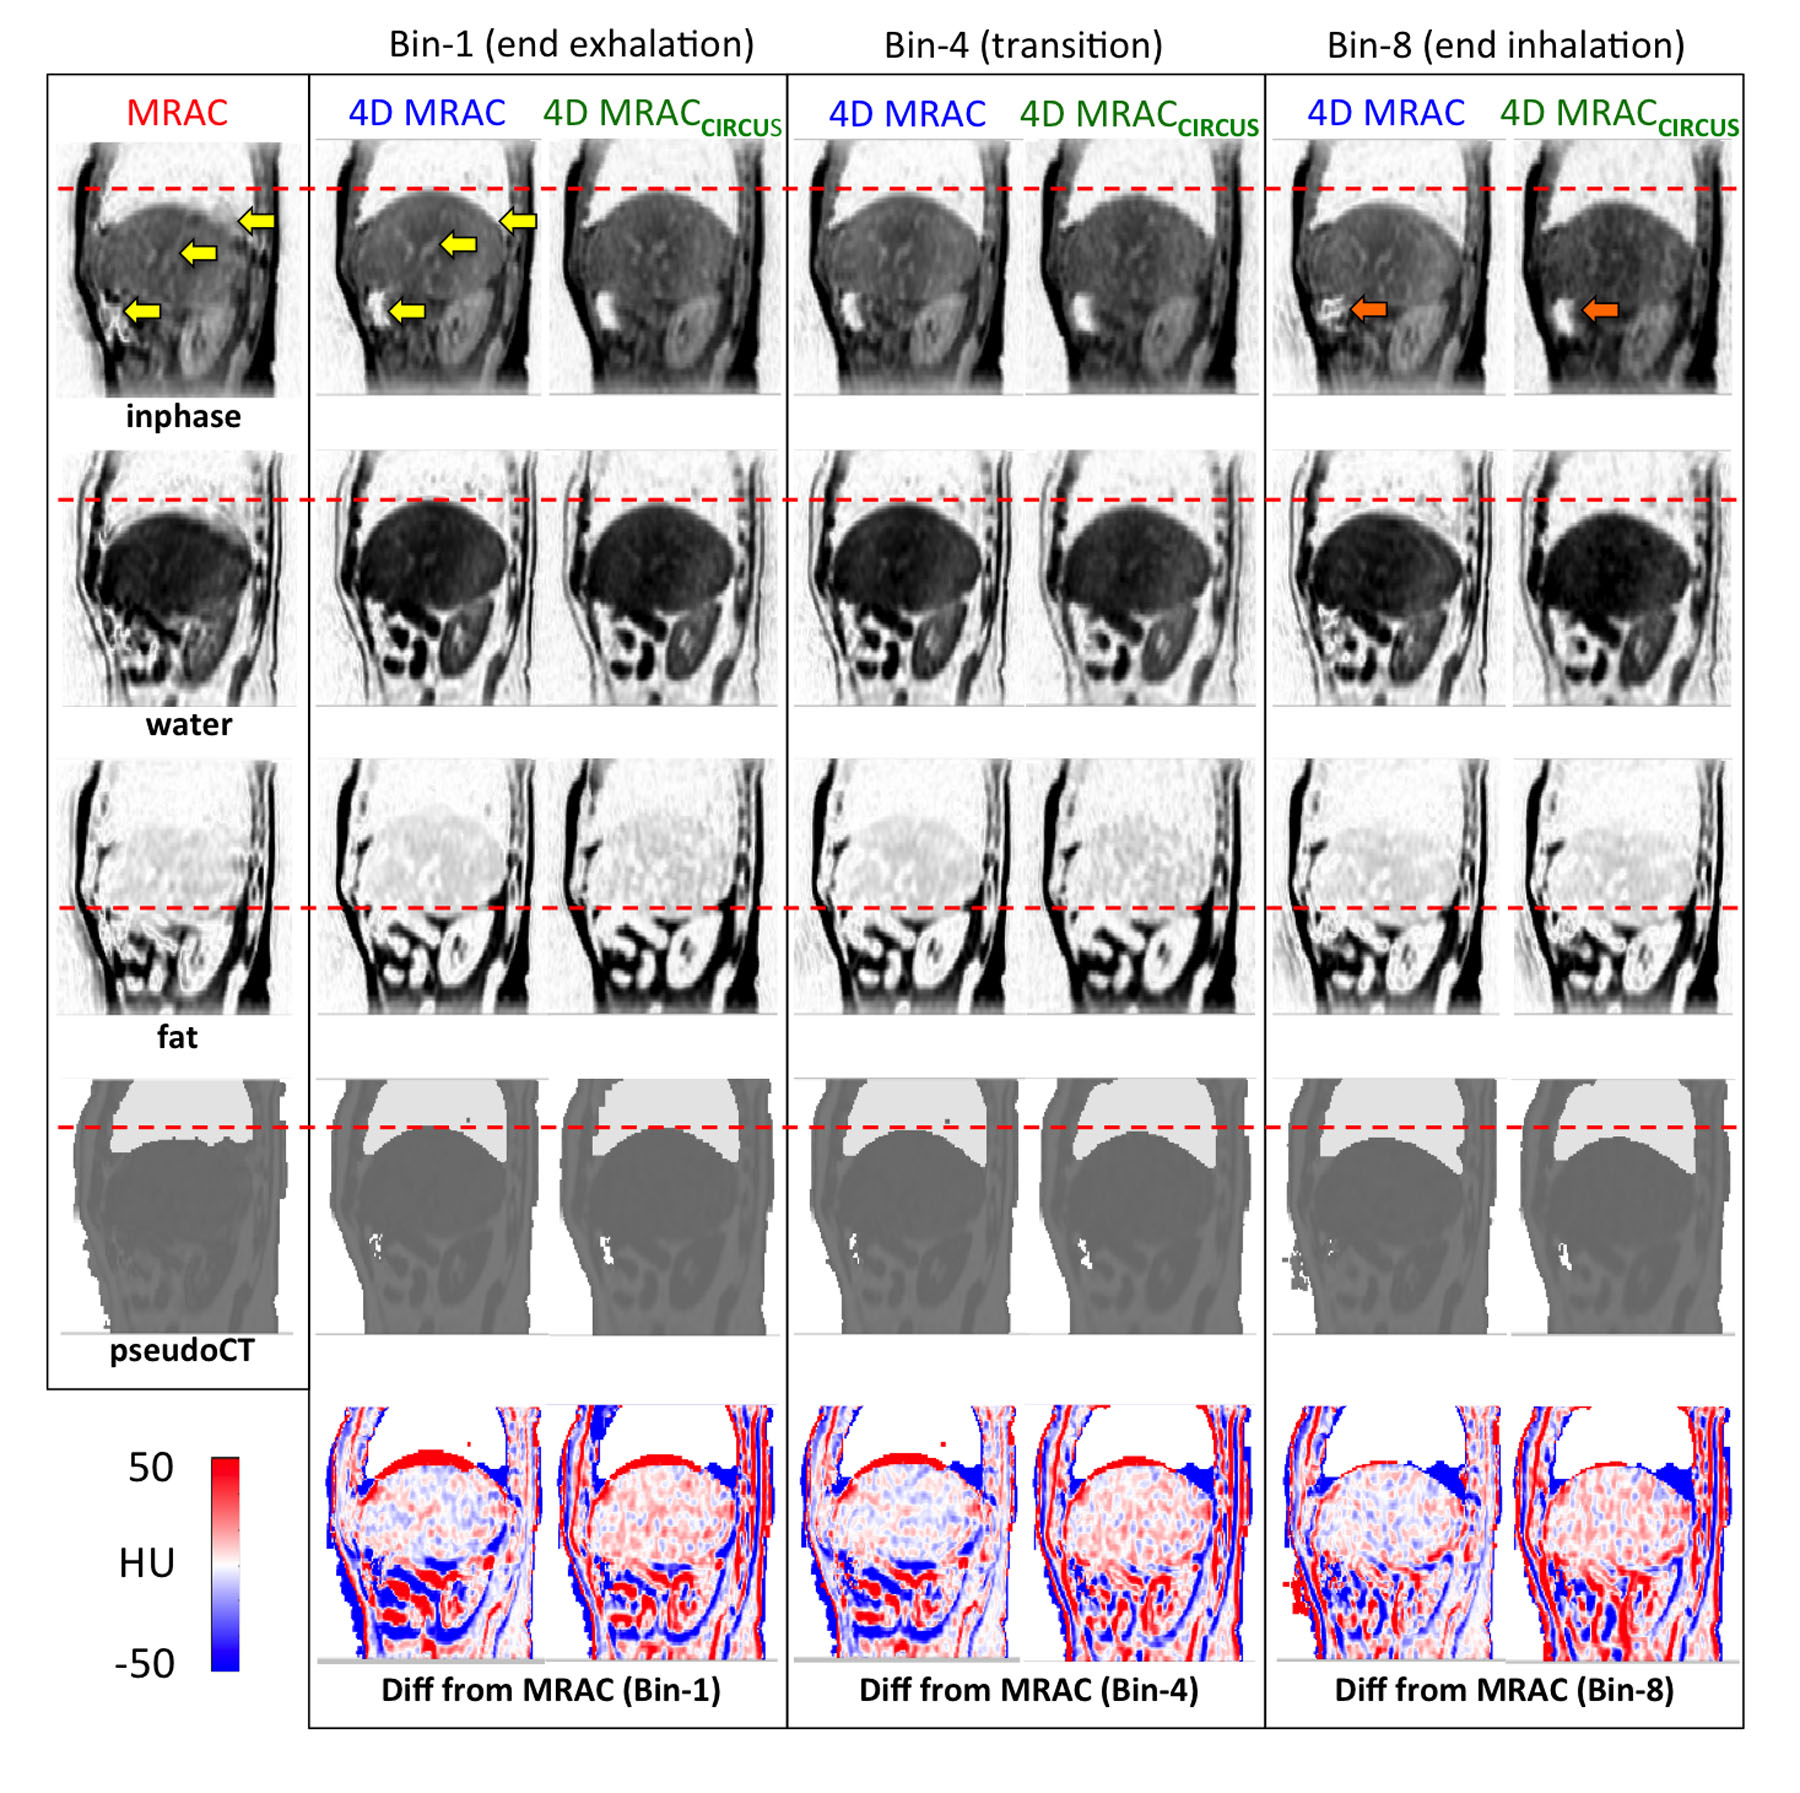
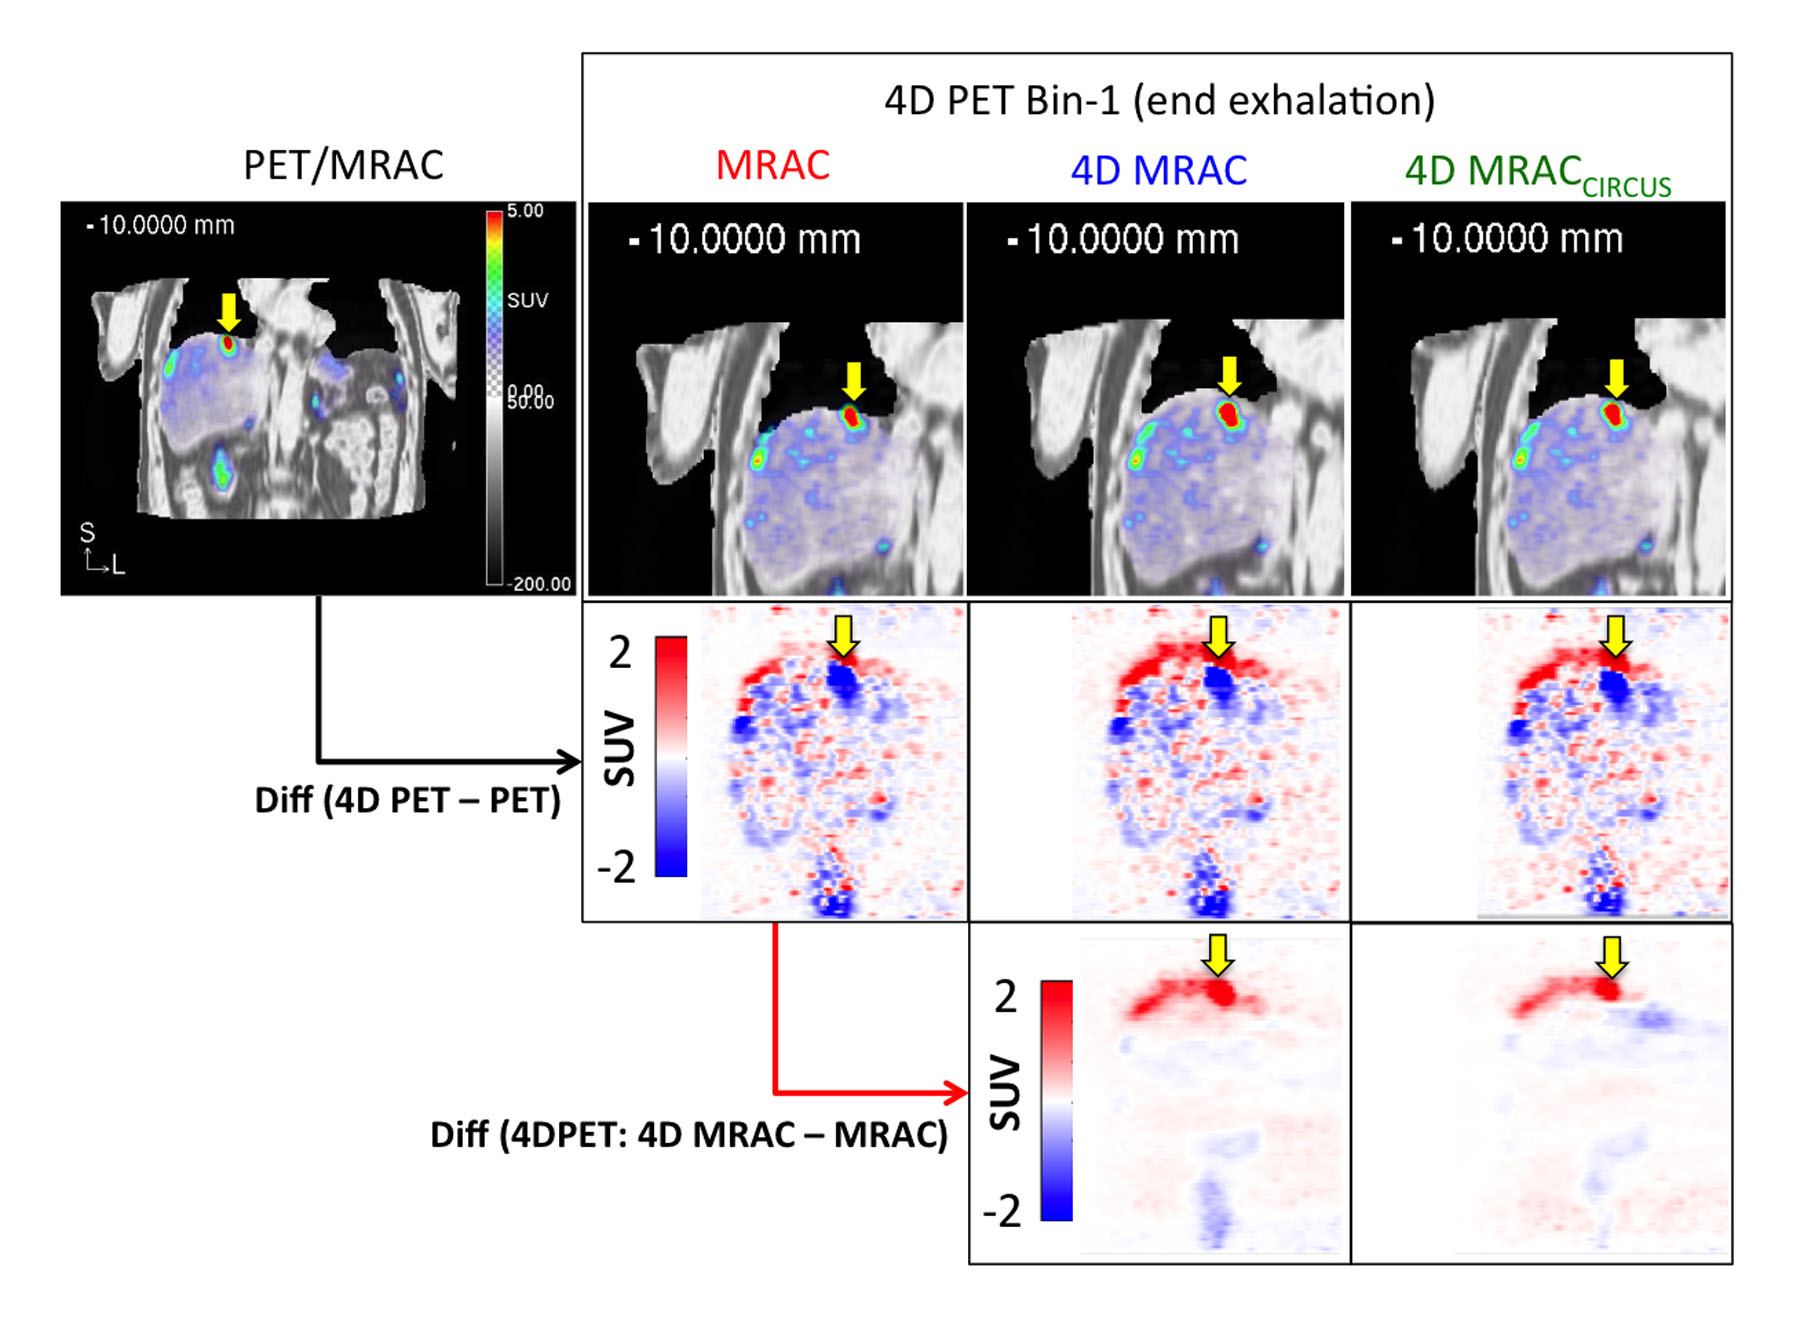
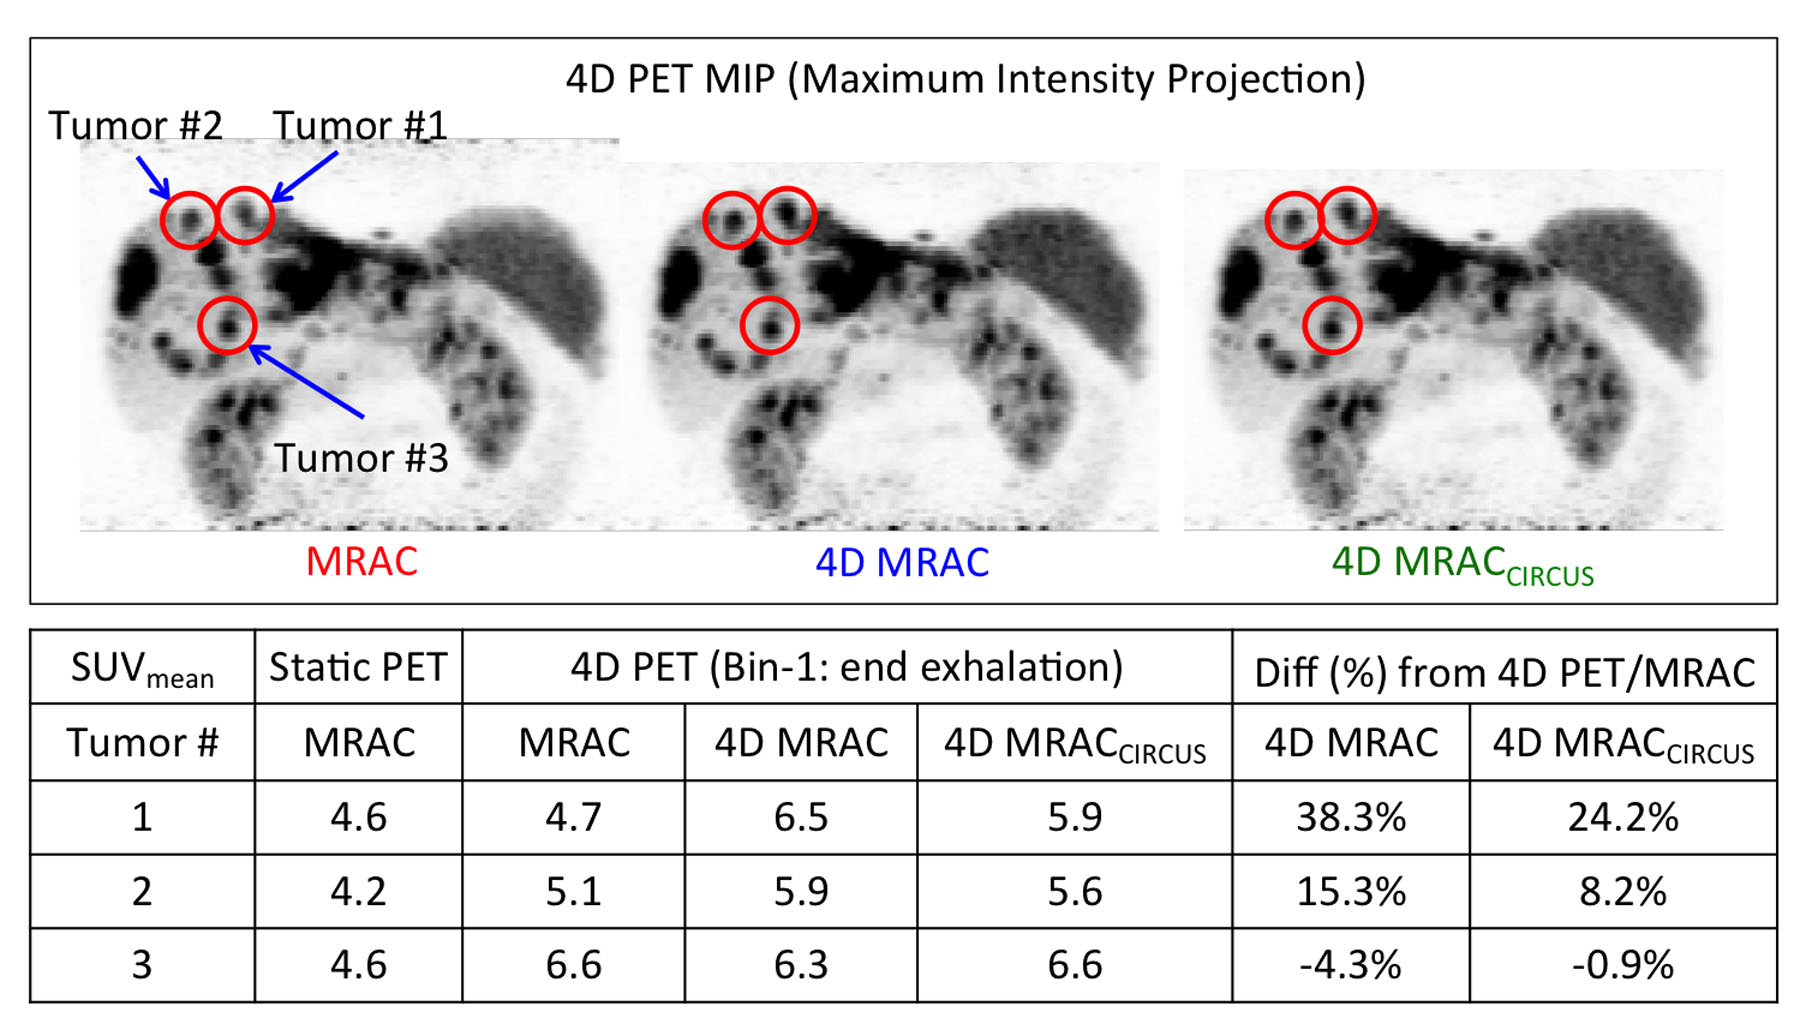
Figure 2 illustrates 4D MRAC and 4D MRACCIRCUS derived respiratory phase-matched pseudoCT images for 4D PET. Specifically, the difference between static and 4D methods was substantial at the lung/liver (air/tissue) interface at the end exhalation phase (bin-1). 4D MRAC and 4D MRACCIRCUS-driven images provided comparable image quality. As shown in Figure 3, the fusion of PET and pseudoCT images demonstrated that the phase-mismatch between gated PET and AC maps could cause the underestimation of PET uptake values, specifically at the lung/liver interface. In Figure 4, for the tumor #1 located at the lung/liver interface, SUVmean was changed by 38.2% and 24.2% with 4D MRAC and 4D MRACCIRCUS, respectively, compared to that with static MRAC.Discussion
The overall results demonstrated that 4D MRAC methods could substantially improve 4D PET quantification through phase-matched AC maps, specifically at the lung/liver interface. In this case, the sequential, raster phase encode ordering in 4D MRAC and the pseudo-random phase encode ordering in 4D MRACCIRCUS provided similar image quality, but the 4D MRACCIRCUS required less scan time. Its pseudo-random ordering provides a more uniform temporal sampling distribution and allows for compressed sensing acceleration as well as potential self-navigation through repeated k-space center sampling. Thus we believe 4D MRACCIRCUS may provide more robust resolution of motion.
However, breath-hold MR scans followed by 4D MRAC scans cause large fluctuation of breathing patterns that may reduce the accuracy of phase-matching between 4D MRAC and 4D PET at the phase3. Thus, breathing instructions can help patients to maintain breathing regularity4,5. In future works, 4D MRAC will be tested on more subjects with a breathing instruction, and motion fields would be derived from 4D MRAC and applied to 4D PET.
Conclusion
We showed the feasibility of respiratory phase-matched 4D MRAC for 4D PET in PET/MRI. 4D MRAC improved respiratory correlation between gated-PET and pseduoCT, compared to the current standard static MRAC, demonstrating that phase-matched MRAC is important for 4D PET quantification, specifically at the lung/liver interface. Also, 4D MRACCIRCUS demonstrated a potential to reduce data acquisition time, while maintaining similar or even improved image quality.Acknowledgements
No acknowledgement found.References
1. Wollenweber SD, Ambwani S, Lonn AHR, et al. Comparison of 4-Class and Continuous Fat/Water Methods for Whole-Body, MR-Based PET Attenuation Correction. Ieee T Nucl Sci 2013;60(5):3391-3398.
2. Liu J, Saloner D. Accelerated MRI with CIRcular Cartesian UnderSampling (CIRCUS): a variable density Cartesian sampling strategy for compressed sensing and parallel imaging. Quantitative imaging in medicine and surgery 2014;4(1):57-67.
3. Nehmeh SA, Erdi YE. Respiratory motion in positron emission tomography/computed tomography: a review. Semin Nucl Med 2008;38(3):167-176.
4. Yang J, Yamamoto T, Pollock S, et al. The impact of audiovisual biofeedback on 4D functional and anatomic imaging: Results of a lung cancer pilot study. Radiotherapy and oncology : journal of the European Society for Therapeutic Radiology and Oncology 2016;120(2):267-272.
5. Kim T, Pollock S, Lee D, O'Brien R, Keall P. Audiovisual biofeedback improves diaphragm motion reproducibility in MRI. Medical physics 2012;39(11):6921-6928.
Figures