0783
Beyond the biological resolution limit: Prospectively motion corrected Time of Flight angiography at 7T1BMMR, Otto-von-Guericke-University, Magdeburg, Germany, 2German Center for Neurodegenerative Disease, Magdeburg, Germany, 3Center for Behavioral Brain Sciences, Magdeburg, Germany, 4Leibniz Institute for Neurobiology, Magdeburg, Germany
Synopsis
Subject motion limits the potential of high resolution Time of Flight (ToF) angiography at 7T, even small scale, involuntary movements can degrade the image quality. In this study, prospective motion correction was able to overcome the biological resolution limit in a healthy subject population (quality assessment with quantitative and qualitative metrics), and was used to acquire the highest in vivo ToF data set to date with an isotropic voxel size of 0.15mm³.
Introduction
Higher magnetic field strengths enable high resolution Time of Flight (ToF) angiography1,2 due to increased SNR and prolonged T1 relaxation times3. Although higher resolution can depict the anatomy with more detail1 even involuntary, small scale subject motion can introduce image artifacts2 resulting in the so called biological resolution limit2. Additionally, the specific absorption rate (SAR) increases with higher B0 fields preventing the use of venous saturation and magnetization transfer (MT) - commonly used at 1.5T and 3T to improve the contrast. In this study, prospective motion correction (PMC)4 is used to improve the effective resolution and spares saturation as well as VERSE5 are applied to reduce SAR6.Methods
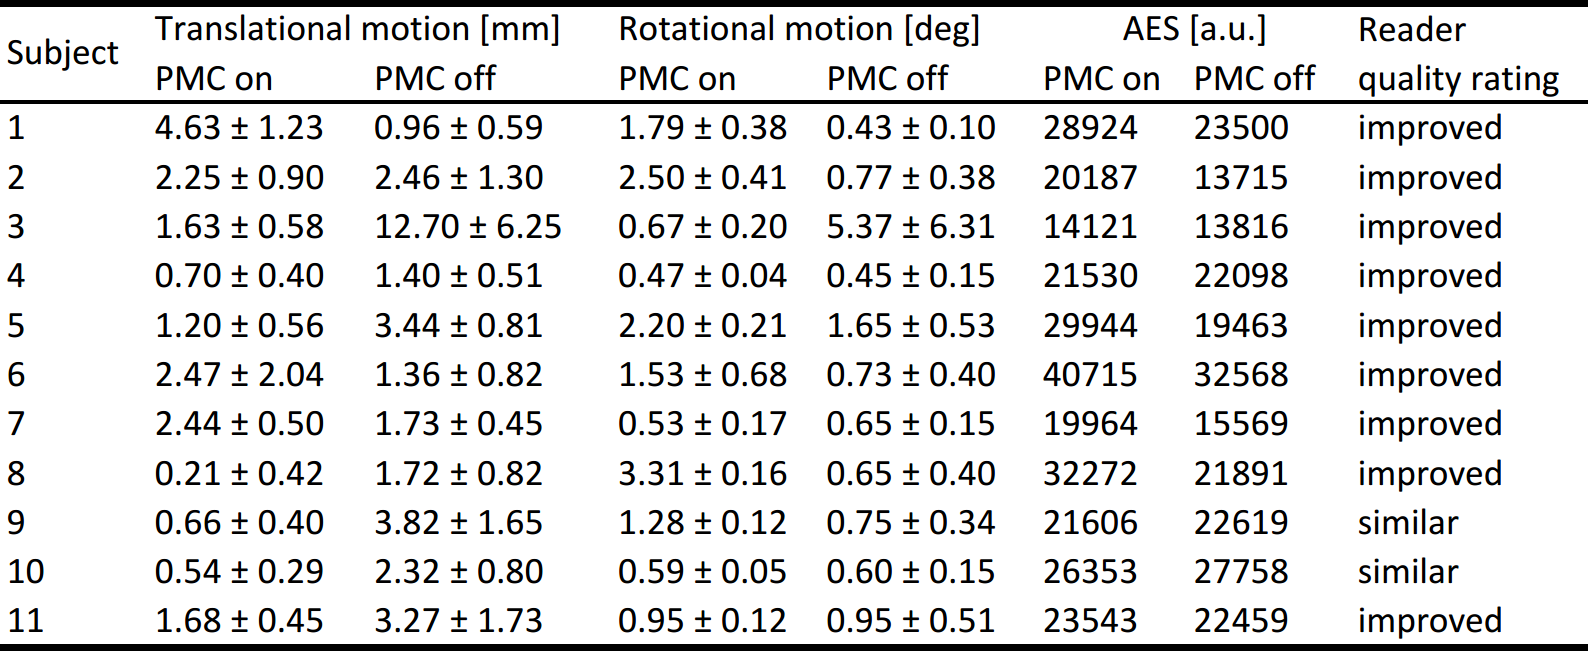
Eleven healthy, highly experienced subjects were scanned (after written consent) at 7T (Siemens, Erlangen, Germany) with a 32-channel head coil (Nova Medical, Wilmington, USA). Angiograms with and without PMC were acquired with a 3D sequence: TR/TE=50/6.63 ms; 25° TONE pulse; FOV 216x189x58.5 mm³ (0.3 mm³ voxel size); 4 slabs with 25 % overlap and 60 slices per slab; venous saturation with VERSE every 7th read-out; MT in k-space center/10% of read-outs; GRAPPA factor 3; 6/8 slice and phase partial Fourier; scan duration 33:08. Additionally, one healthy subject was scanned with 0.15mm³ voxel size and motion correction. The parameters differed from the previous protocol as following: TR/TE=35/6.63; 23° TONE pulse; FOV 196x147x46.8mm³; 96 slices per slab, no GRAPPA acceleration, no MTC, scan duration 2:14:21. Due to the extended scan time no scan without motion correction was performed. The study was approved by the local ethics committee. Average edge strength (AES, described by Aksoy et al.7) and reader quality rating (ranking quality as ‘improved’, ‘same’, or ‘worse’ with PMC) of the maximum intensity projections (MIP) were used to assess if PMC is improving the vessel depiction. Two sample t-test was performed to check if motion correction increases the AES significantly. All processing was done in MATLAB 2015b.Results
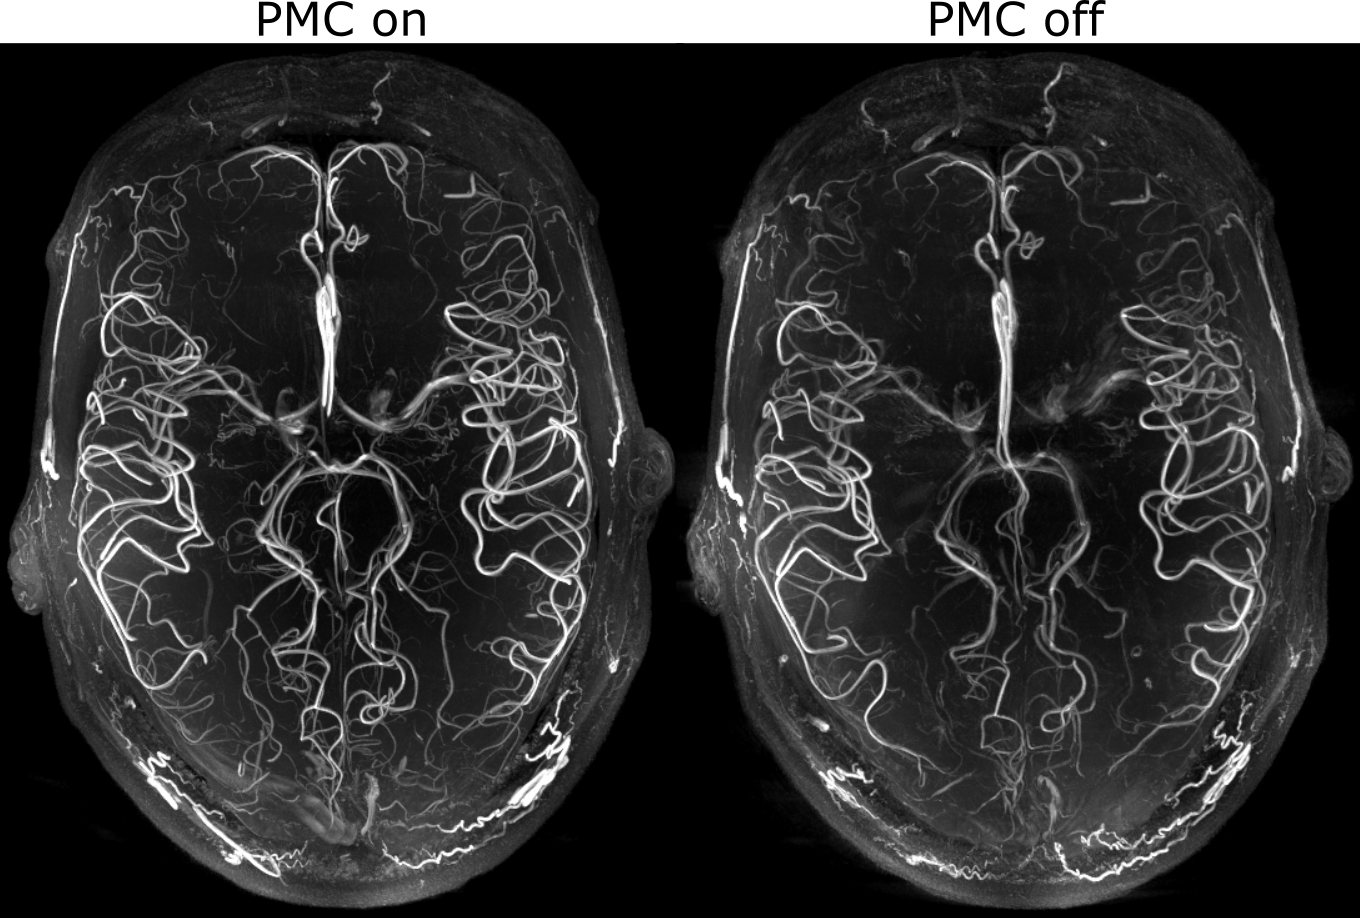
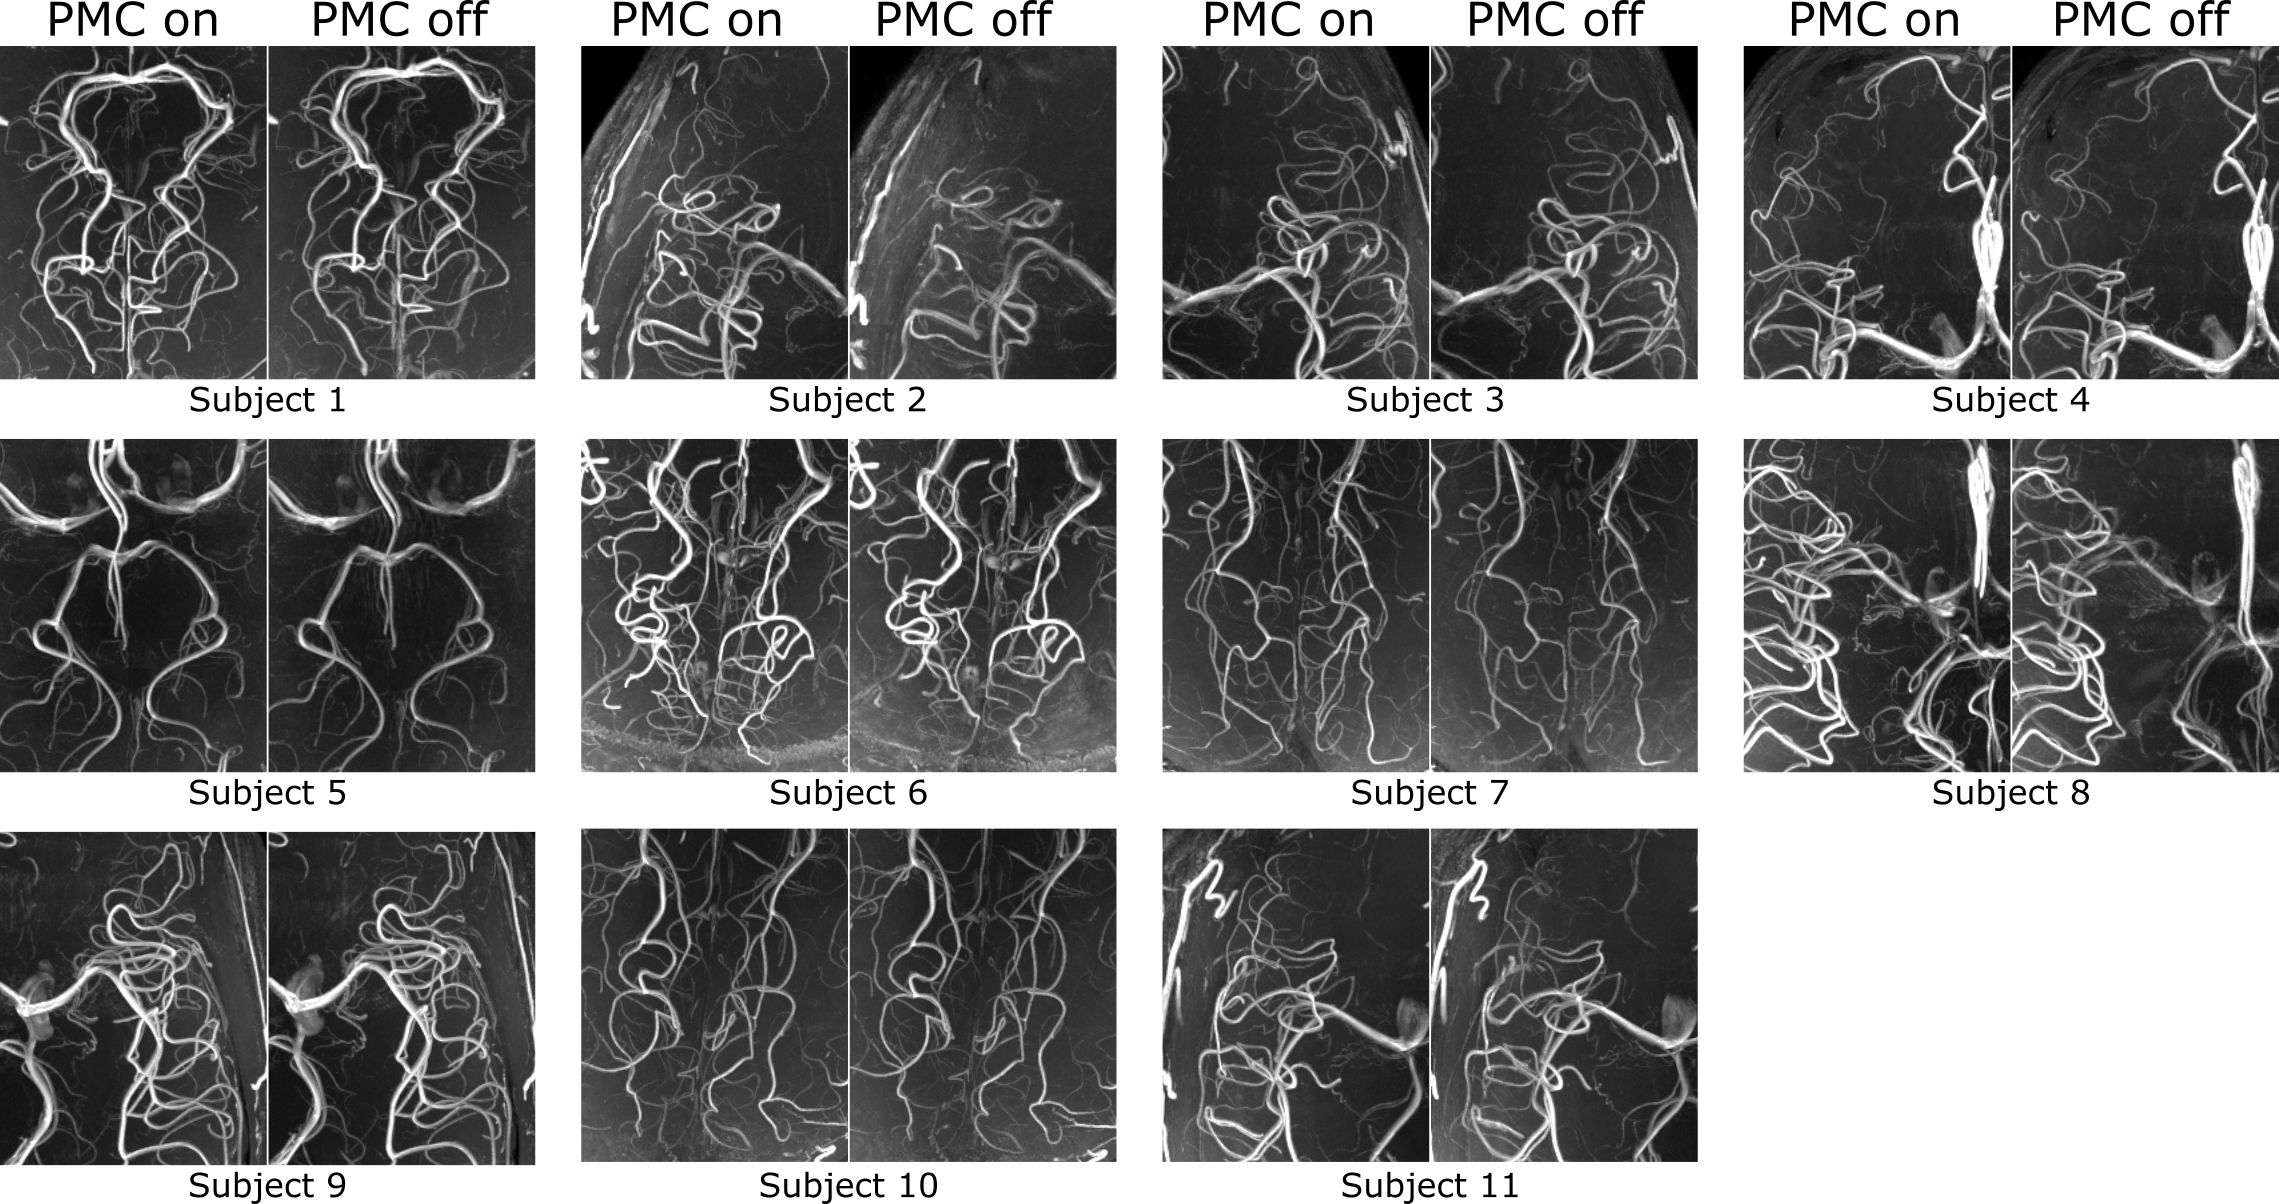
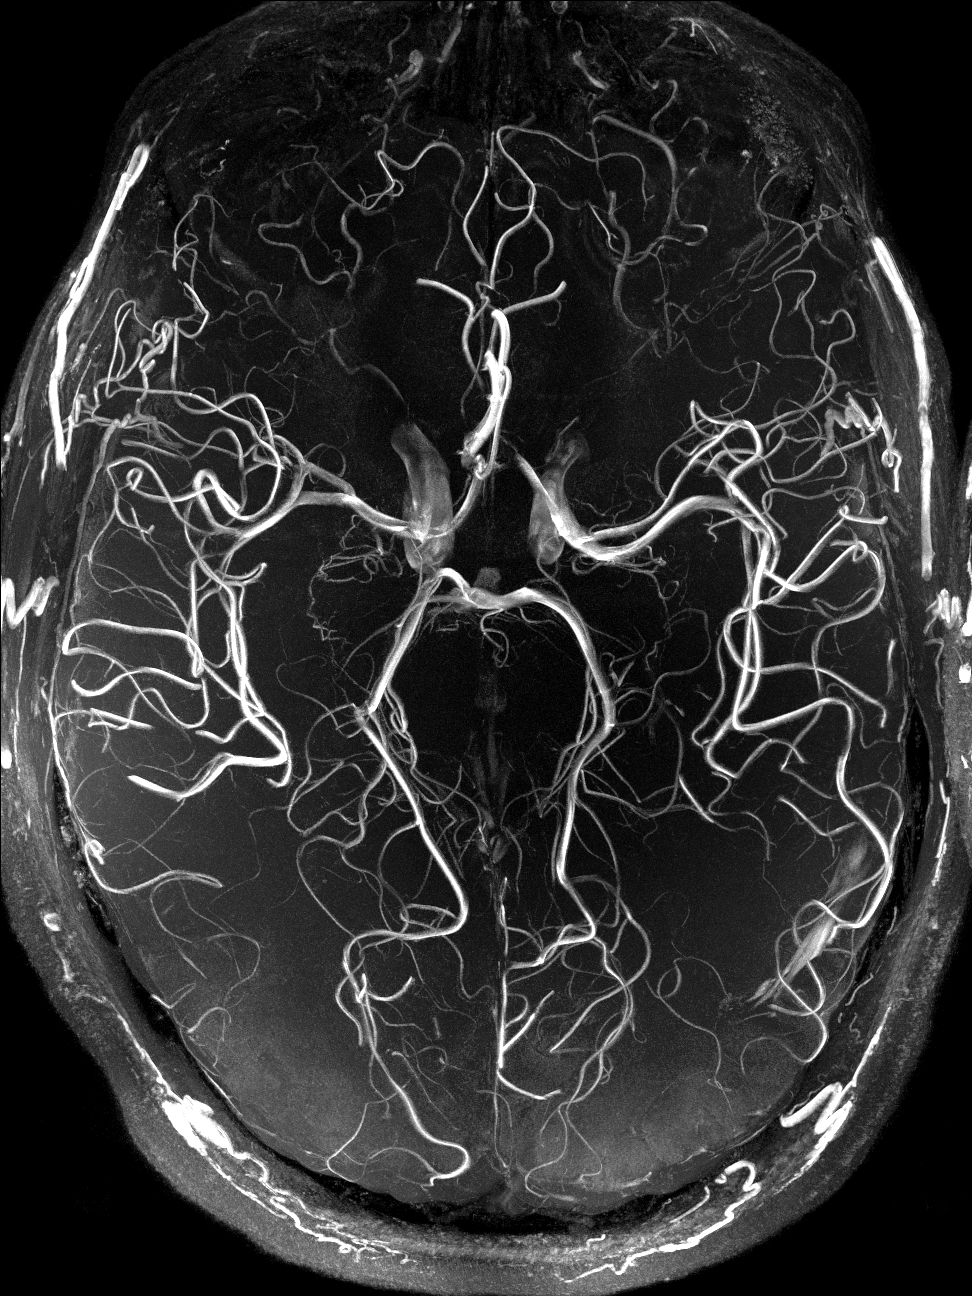
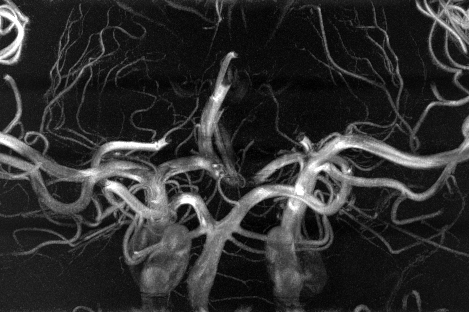
The performed subject motion is quantified in Tab. 1 as the mean and standard deviation of the 3D translational and rotational movement. In Fig. 1 axial MIPs with and without PMC show how subject motion degrades the vessel depiction (increased blurring, loss in sharpness, lower vessel intensity). For all subjects MIPs of different regions of interested are shown in Fig. 2. As seen in this figure and reflected by the reader quality rating (see Tab. 1) the image quality improved with PMC in 9 out of 11 cases, in the other 2 cases (subject 8 & 9) the image quality is similar with and without PMC. Motion correction never qualitatively degraded the vessel depiction. The AES results show a similar trend. In 8 of 11 cases the edge strength increased with PMC. The group median increased from 22098 a.u without to 23543 a.u. with motion correction. Two sample t-test indicated that the underlying distribution for PMC on and off differs, but not significantly (null hypothesis rejected with p=0.17). The MIPs of the 0.15 mm³ voxel size protocol in Fig.3 and Fig.4 show what level of detail can be achieved with the proposed approach. Small vessels, e.g. the pontine branches of the basilar artery, are clearly depicted.Discussions
In this study, we presented the highest resolution in vivo ToF acquired (to our best knowledge), providing the potential of an in vivo vasculature atlas. Compared to the uncorrected MIPs, with PMC smaller and more vessels were detected, the depiction is sharper, and the vessel-to-background ratio improved qualitatively. The quantitative assessment by the AES supports this observation, even though the difference was not significant. A challenge inherent to PMC is that the motion during on and off condition is not identical. Additionally, motion in between the scans results in different head orientations for corrected and uncorrected images. Thus, image quality assessment is not trivial and remains an open research question. Nevertheless, all data indicate that PMC successfully prevents image degradation due to inevitable, involuntary subject motion and can improve the vessel depiction even in this cohort of well-motivated and experienced healthy subjects. With less experienced or uncooperative subjects more severe image degradation due to stronger motion might occur, hence PMC would improve image quality even more8,9,10. In the future, further acquisition acceleration (e.g. compressed sensing) could shorten the scan time and additional quantitative image metrics could be evaluated. In conclusion, motion correction enabled vessel depiction beyond the biological resolution limit.Acknowledgements
This work was supported by the NIH, grant number 1R01-DA021146, and by the Initial Training Network, HiMR, funded by the FP7 Marie Curie Actions of the European Commission, grant number FP7-PEOPLE-2012-ITN-316716.References
1. Heverhagen JT, Bourekas E, Sammet S, Knopp MV, Schmalbrock P. Time-of-Flight Magnetic Resonance Angiography at 7 Tesla. Investigative radiology. 2008;43(8):568-573.
2. Stucht D, Danishad KA, Schulze P, Godenschweger F, Zaitsev M, Speck O. Highest Resolution In Vivo Human Brain MRI Using Prospective Motion Correction. PloS one [Internet]. 2015;10(7):e0133921.
3. Ladd ME. High-field-strength magnetic resonance: potential and limits. Topics in magnetic resonance imaging TMRI. 2007;18(2):139–152.
4. Maclaren J, Armstrong, Brian S R, Barrows RT et al. Measurement and correction of microscopic head motion during magnetic resonance imaging of the brain. PloS one. 2012;7(11):e48088.
5. Conolly S, Nishimura D, Macovski A, Glover G. Variable-rate selective excitation. Journal of Magnetic Resonance (1969). 1988;78(3):440–458.
6. Schmitter S, Bock M, Johst S, Auerbach EJ, Ugurbil K, Van de Moortele, Pierre-François. Contrast enhancement in TOF cerebral angiography at 7 T using saturation and MT pulses under SAR constraints: impact of VERSE and sparse pulses. Magnetic resonance in medicine. 2012;68(1):188–197.
7. Aksoy M, Forman C, Straka M, Çukur T, Hornegger J, Bammer R. Hybrid prospective and retrospective head motion correction to mitigate cross-calibration errors. Magnetic resonance in medicine. 2012;67(5):1237-1251.
8. Andre JB, Bresnahan BW, Mossa-Basha M, Hoff MN, Smith CP, Anzai Y, Cohen WA. Toward Quantifying the Prevalence, Severity, and Cost Associated With Patient Motion During Clinical MR Examinations. Journal of the American College of Radiology. 2015;12(7):689-695.
9. Brown TT, Kuperman JM, Erhart M, White NS, Roddey JC, Shankaranarayanan A, Han ET, Rettmann D, Dale AM. Prospective motion correction of high-resolution magnetic resonance imaging data in children. NeuroImage. 2010;53(1):139-145.
10. Holdsworth SJ, Aksoy M, Newbould RD, Yeom K, Van AT, Ooi MB, Barnes PD, Bammer R, Skare S. Diffusion tensor imaging (DTI) with retrospective motion correction for large-scale pediatric imaging. Journal of magnetic resonance imaging. 2012;36(6):961-971
Figures