0778
Assessing the effect of head-motion on tissue volume estimates1School of Engineering, Cardiff University, Cardiff, United Kingdom, 2EPFL- CIBM, Lausanne, Switzerland
Synopsis
We looked at data from 60 subjects undergoing 1mm resolution T1-weighted structural scans at 7T with 3D FatNavs allowing retrospective motion-correction. Motion parameters for 60 subjects were examined for general trends – and typical motion was dominated by translation in the z-direction and a small backwards rotation of the head. Quantitative estimates of tissue volumes were compared before and after motion-correction was applied, suggesting that total intracranial volume tends to be overestimated when the subject moves more – and that this is dominated by an overestimation of the CSF volume.
Introduction
Small involuntary movements of the head are inevitable during MR examinations and this motion will have a detrimental effect on the quality of the images obtained. Quantitative measures such as GM and WM volume will clearly also be affected – but it remains unclear whether motion will bias these estimates in addition to making them less reliable. Now that retrospective motion-correction is routinely available on our 7T scanner for T1-structural MP2RAGE scans we have access to a large number of brain volumes before and after motion-correction has been applied. In this work we start to analyse this data by looking at 60 subjects scanned at 1mm isotropic resolution, giving an indication of the range of motion that can be expected across a population and investigating how the extent of the motion affects estimates of the volume of GM, WM and CSF.Methods
Here we analyse data collected as routine structural scans as parts of other research studies at the CIBM in Lausanne. All data were collected on a Siemens 7T head-only scanner with a 32-Ch RF coil (Nova Medical Inc.). At the time of writing, 60 scans were available with a 1mm isotropic resolution T1-weighted MP2RAGE [1] protocol (TE/TI1/TI2/TR = 1.87/750/2350/5500 ms, ¾ partial Fourier in both phase-encoding directions, 3x GRAPPA acceleration, total scan time 7m28s) with interleaved acquisition every TR of a highly accelerated whole-head 2mm isotropic GRE fat-excitation (3D FatNav [2]) for use as a motion-navigator. Following each scan, the raw data were transferred to a networked data repository using Yarra (https://yarra.rocks) for offline processing. Some scans are likely to be repeats of the same subject but this cannot be identified directly as the data were already anonymized at this stage. All image reconstruction and motion-correction was performed using a customized Matlab-based pipeline (https://github.com/dgallichan/retroMoCoBox) which uses SPM12 to derive motion-estimates from the FatNavs and a NUFFT adjoint operation (http://web.eecs.umich.edu/~fessler/irt/) to apply the rotations independently to each plane of k-space data. The full retrospective motion-correction pipeline is described in more detail in ref [2]. For the fairest comparison of the effects only due to motion, images without motion-correction were obtained using the same custom pipeline rather than using the images available online at the scanner via the default vendor reconstruction. Brain segmentation was performed using SPM12 to derive volume estimates of GM, WM and CSF before and after application of the motion-correction. To attempt to have a single parameter to summarize the subject motion, the ‘RMS motion’ was used – where the root-mean squared translation (in mm) and rotation (in degrees) were combined together (under the assumption that for the human brain 1 degree of rotation corresponds approximately to 1mm of motion towards the edge of the brain).Results
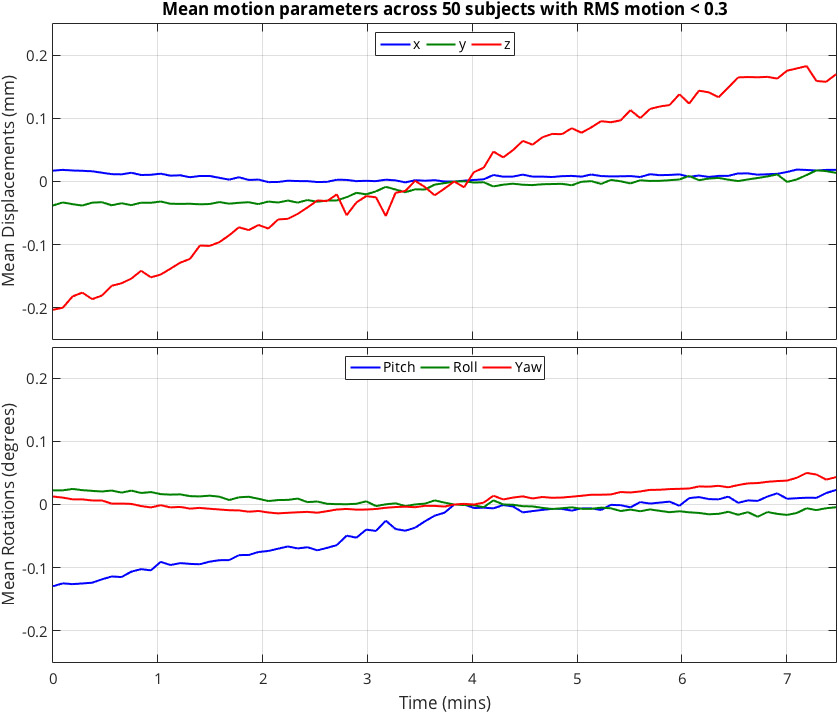
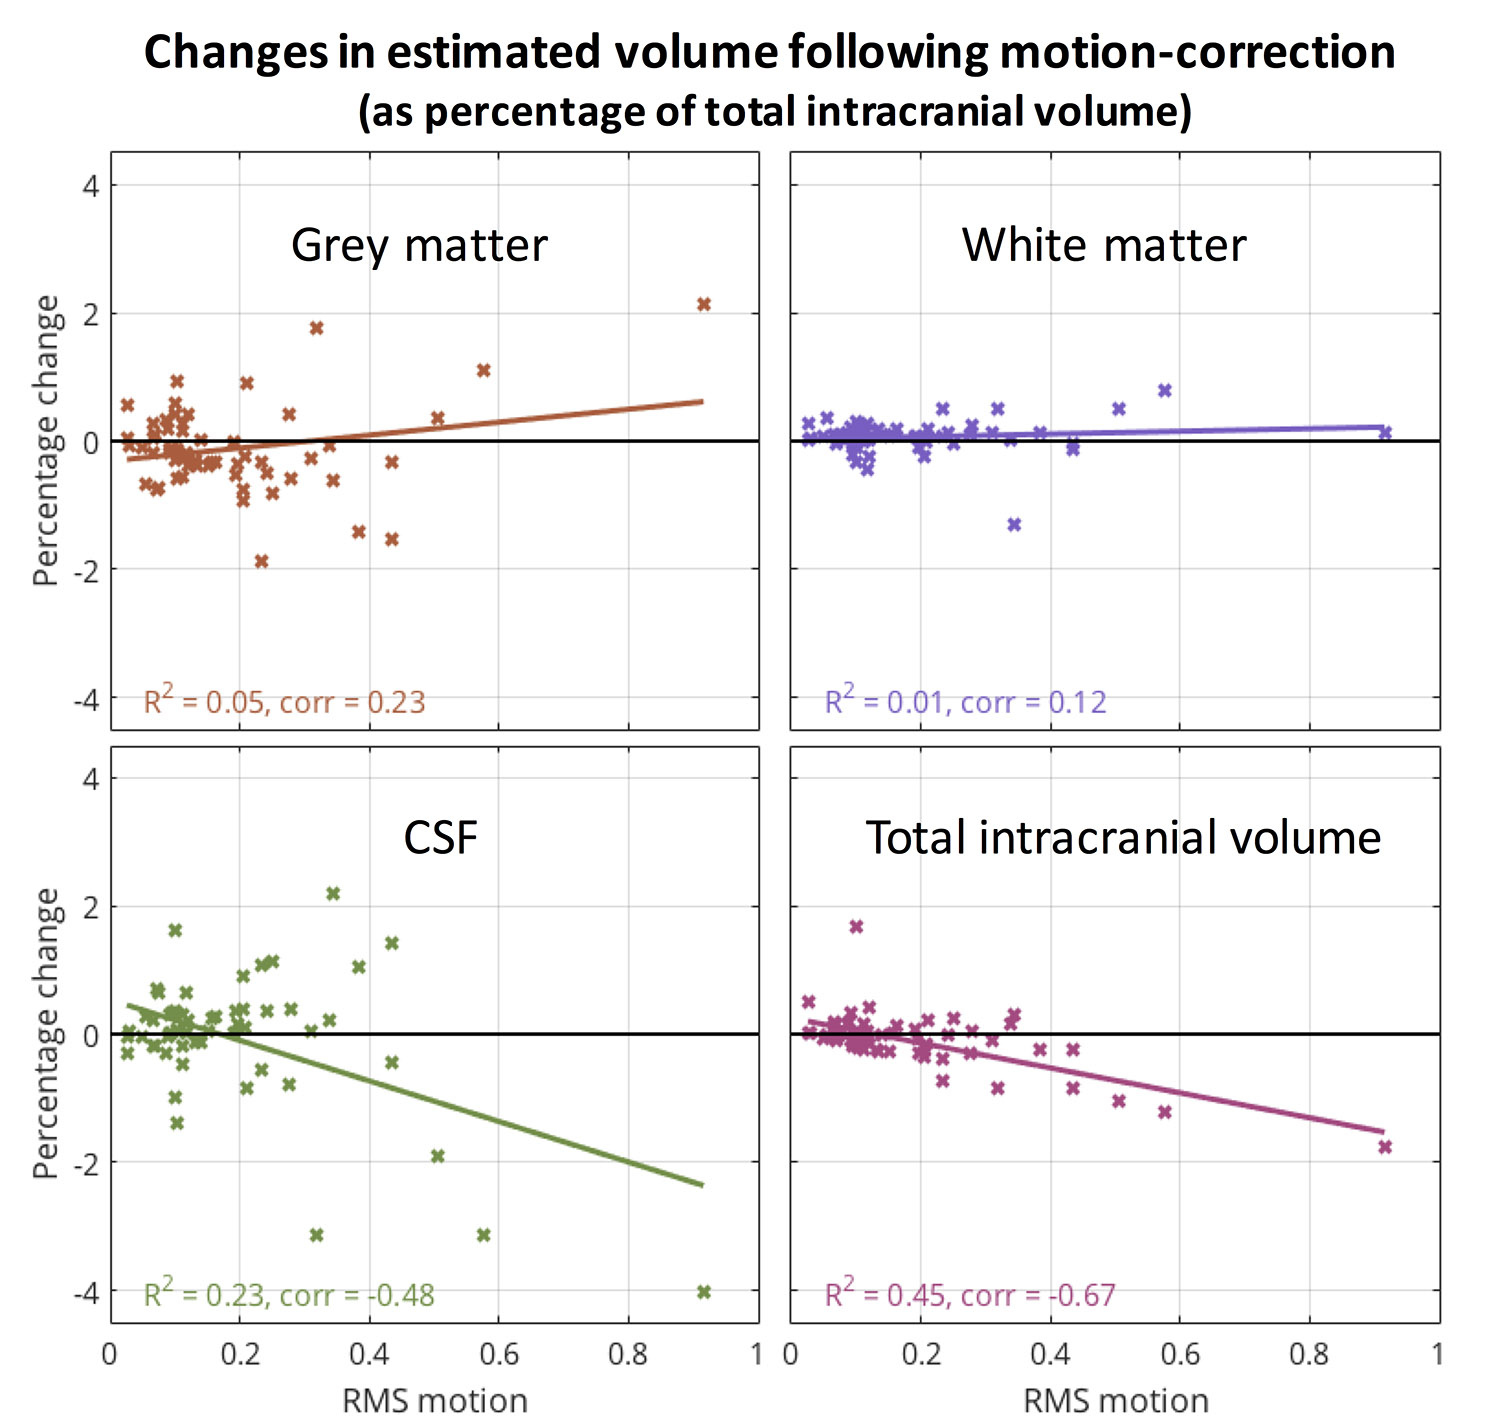
Figure 1 shows example motion parameters and images before and after motion-correction. There are hardly any perceptible differences in the top image, whereas the improvement with motion-correction for the bottom image is striking. Figure 2 gives an indication of the ‘typical’ motion by taking the mean of the 50 subjects with RMS motion < 0.3 – the 10 subjects with the greatest motion were excluded from this plot as they would dominate the mean and be less representative of the population. The mean subject motion shows a strong smooth displacement in the z-direction of a few hundred microns (corresponding to a movement of the head towards the feet during the scan) and a smooth rotation of around 0.1 degrees (corresponding to a backwards tilt of the head). Figure 3 shows that the estimated WM volume is largely unchanged by the motion-correction, and the estimated GM volume shows larger changes but without a clear systematic direction to these changes with the RMS motion. The estimated CSF volume shows a strong tendency to decrease following motion-correction, alongside the same tendency for the estimated TIV. The main contribution to the decrease in estimated TIV is the decrease in estimated CSF volume.Discussion and Conclusion
Typical subject head-motion is dominated by smooth translation in the z-direction towards the feet accompanied by a small backward head rotation. Results shown in Figure 3 imply that when MP2RAGE images are corrupted by motion they have a tendency to overestimate CSF volume and, in turn, the TIV as well. Further analysis is required to find potential causes for this bias. Future work will additionally attempt to assess whether image sharpness metrics can also be related to RMS subject motion.Acknowledgements
This work was supported by the CIBM of UNIL, UNIGE, HUG, CHUV, EPFL and the Leenards and Jeantet Foundations, as well as SNSF project 205321_153564References
1. Marques JP, Kober T, Krueger G, van der Zwaag W, Van de Moortele P-F, Gruetter R. MP2RAGE, a self bias-field corrected sequence for improved segmentation and T1-mapping at high field. Neuroimage 2010;49: 1271–81
2. Gallichan D, Marques JP, Gruetter R. Retrospective correction of involuntary microscopic head movement using highly accelerated fat image navigators (3D FatNavs) at 7T. Magn Reson Med. 2016;75: 1030–1039.
Figures