0773
Suspicious Component Segmentation for Identifying Hippocampal Sclerosis Using Regularized Tissue-Fraction MR Fingerprinting1Department of Neurology, The First Affiliated Hospital, School of Medicine, Zhejiang University, Hangzhou, People's Republic of China, 2Center for Brain Imaging Science and Technology, Department of Biomedical Engineering, Zhejiang University, Hangzhou, People's Republic of China
Synopsis
A relaxometry-based tissue fraction segmentation using MR fingerprinting method was applied for identifying hippocampal sclerosis. The results demonstrated that tissue-fraction MR fingerprinting method could effectively segment multiple tissue components and mark the possible sclerosis regions, which is critical for clinical application including lesions diagnosis and multicomponent analysis.
Purpose
As one of the main types of mesial temporal lobe epilepsy (MTLE), hippocampal sclerosis (HS) results in higher signal intensity in T2 weighted images and lower in T1 weighted images than normal tissue due to its prolonged T1 and T2 relaxation times [1]. Routine MRI-based diagnosis including T1 and T2 weighted images are insensitive for HS lesions with subtle changes, which may lead to missed diagnosis of small HS lesions. MR fingerprinting (MRF) has been used for estimating the intra-voxel tissue component fractions based on relaxometry properties [2, 3], which can aid in improving the accuracy and sensitivity of epilepsy diagnosis. In this work, we utilized a proposed regularized tissue-fraction MRF (rTF-MRF) method [4] that segments suspicious HS tissue component by solving the MRF signal equation with additional composition fractional constraint for acquired MRF data of HS patients.Methods
20 MTLE patients (10 females and 10 males) diagnosed with HS based on EEG and clinical presentation participated in this study. All the patients were scanned with a series conventional sequences with routine protocols including T1-MPRAGE and T2-TSE prior to MRF scans. The MRF scans were based on an inversion-prepared FISP sequence (FISP-MRF) [5] with 20 slices of both transverse and coronal orientations covering the temporary lobe for patients. The final T1, T2 and Proton density (PD) maps with in-plane spatial resolution of 1.3 × 1.3 mm2 were recognized simultaneously by the sliding-window matching algorithm [6]. All the measurements were performed on a 3T scanner (MAGNETOM Prisma, Siemens Healthcare, Erlangen, Germany) with 20-channel head coil.
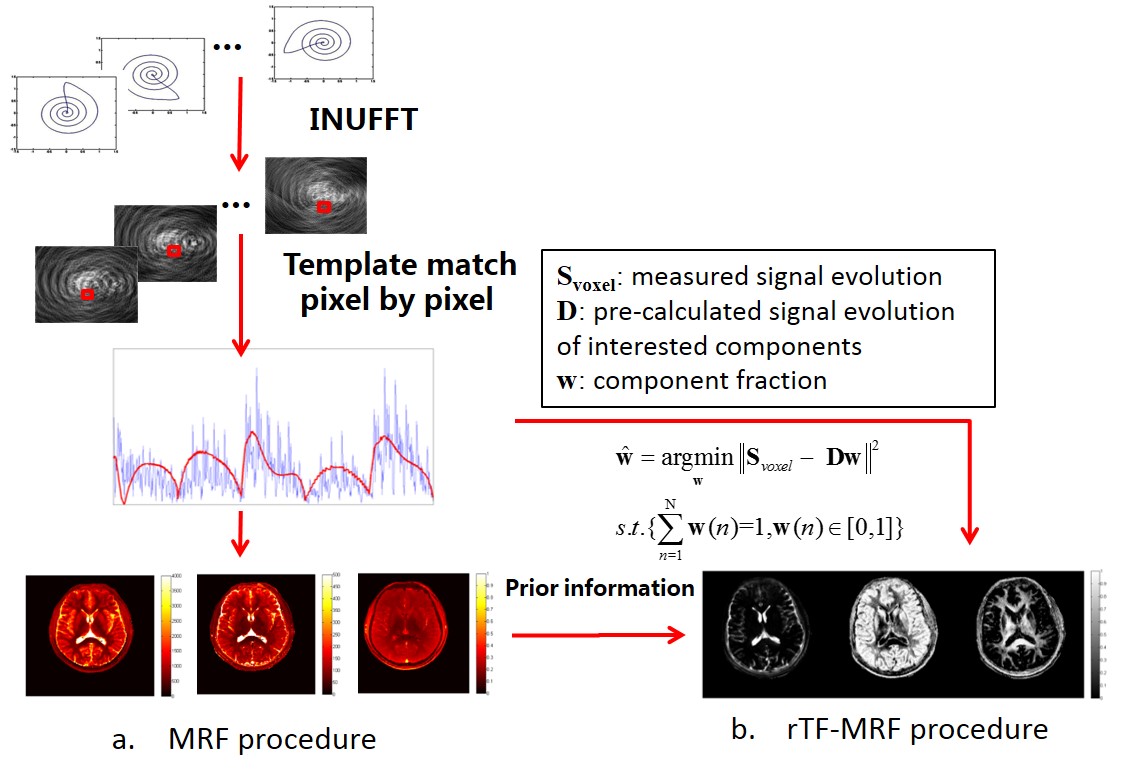
The same acquired MRF data were used for post-processing of tissue segmentation as well as MRF parametric recognition while potential fractions of interested multiple components were applied instead of using the dictionary based on T1 and T2 evaluation. The signal equation of rTF-MRF is $$ \widehat{\bf w}=argmin||{\bf S}_{\it voxel}-{\bf Dw}||_{2}\quad{\it s.t.} \left\{{\sum_{n=1}^N}{\bf w}(n)=1,{\bf w}(n)\in[0,1]\right\}\quad\quad\quad\quad\quad(1)$$
where the Svoxel represents the acquired signal curve of each voxel, D is the signal evolutions of interested components that pre-calculated by extended phase graph algorithm [7], and w is potential fractions groups with N interested components. The optimization problem of Eq. (1) can be solved by least square method with additional constraint. Fig.1. shows the brief procedure of rTF-MRF.
Since the prolonged T1 and T2 values in HS lesions, firstly the recognized T1, T2 and PD maps from the same datasets were exploited to decide the possible range of relaxometry of lesions as the prior information for HS patients. Then the each voxel can be segmented into 4 components including CSF (T1/T2=4000/1500ms), gray matter (T1/T2=1300/120ms), white matter (T1/T2=800/80ms) and a suspicious HS component (prior information from MRF results).
Results and Discussion
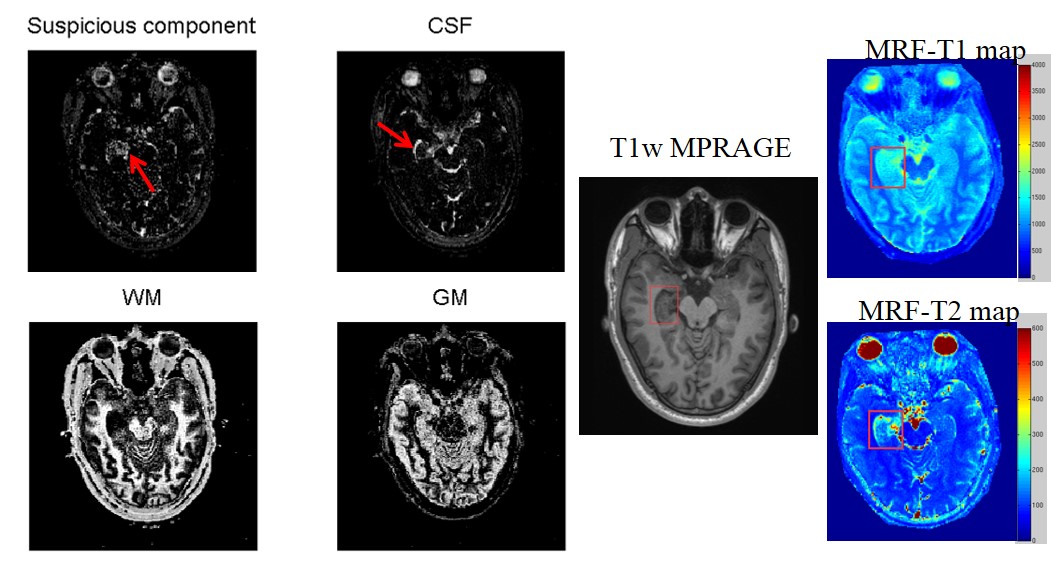
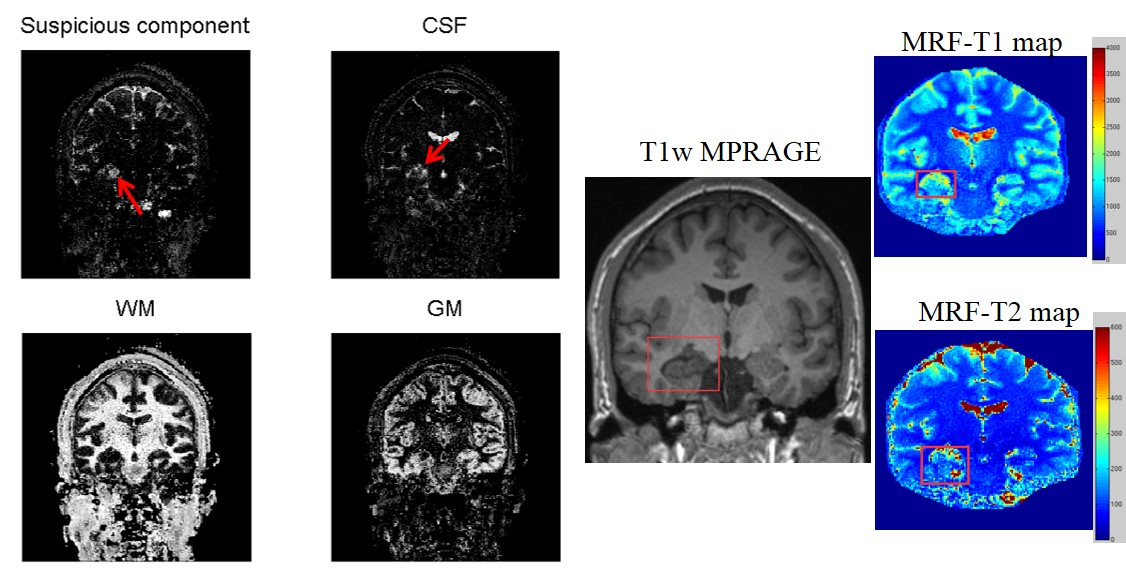
Figs. 2 and 3 shows representative slices of T1 weighted MPRAGE and MRF images of a HS patient and the corresponding tissue-fraction segmentations in transverse and coronal positions, respectively. The T1 and T2 values of suspicious component for this patient was set as T1/T2= 2000/200ms after MRF reconstruction. The results show that the tissue pointed by red arrow in separated suspicious components using rTF-MRF method is consistant with possible HS lesions indicated by the red boxes in T1 MPRAGE and MRF results. Furthermore, the region pointed by a red arrow in the segmented CSF map shows the increased volume of temporal horn of lateral ventricle, which reflects the atrophy of hippocampus. These preliminary results demonstrate that it is feasible to achieve accurate component segmentation using rTF-MRF method for HS patients. HS lesion can be detected with robust quantification and detailed tissue composition, therefore the sensitivity and accuracy can be improved as compared with the conventional method based T1W/T2W images.Acknowledgements
No acknowledgement found.References
[1] Deoni S. Magnetic Resonance Relaxation and Quantitative Measurement in the Brain. Magnetic Resonance Neuroimaging: Methods and Protocols 2011:65-108.
[2] Ma D, Gulani V, Seiberlich N, Liu K, Sunshine JL, Duerk JL, Griswold MA. Magnetic resonance fingerprinting. Nature 2013;495(7440):187-192.
[3] Deshmane A et al. Proc ISMRM 22 (2014), p. 94.
[4] Cao X, Liao C, Wang Z, Ye H, Chen Y, He H, Chen S, Ding Q, Liu H, Zhong J. An Improved Tissue-Fraction MRF (TF-MRF) with Additional Fraction Regularization. Proc ISMRM 22 (2014), p. 4223
[5] Jiang Y, Ma D, Seiberlich N, Gulani V, Griswold MA. MR fingerprinting using fast imaging with steady state precession (FISP) with spiral readout. Magn Reson Med 2015;74(6):1621-1631.
[6] Cao X, Liao C, Wang Z, Chen Y, Ye H, He H, Zhong J. Robust Sliding-window Reconstruction for Accelerating the Acquisition of MR Fingerprinting. Magn Reson Med. 2016; DOI: 10.1002/mrm.26521.
[7] Weigel M. Extended phase graphs: dephasing, RF pulses, and echoes - pure and simple. J Magn Reson Imaging 2015;41(2):266-295.
Figures