0768
Bioreactor for in vitro optical fluorescence and magnetic resonance spectroscopy1Medical Physics, University of Wisconsin - Madison, Madison, WI, United States, 2Medical Engineering, Morgridge Institute for Research, Madison, WI, United States, 3Laboratory for Optical and Computational Instrumentation (LOCI), University of Wisconsin - Madison, Madison, WI, United States, 4Cell and Regenerative Biology, University of Wisconsin - Madison, Madison, WI, United States, 5Biomedical Engineering, University of Wisconsin - Madison, Madison, WI, United States, 6Radiology, University of Wisconsin - Madison, Madison, WI, United States
Synopsis
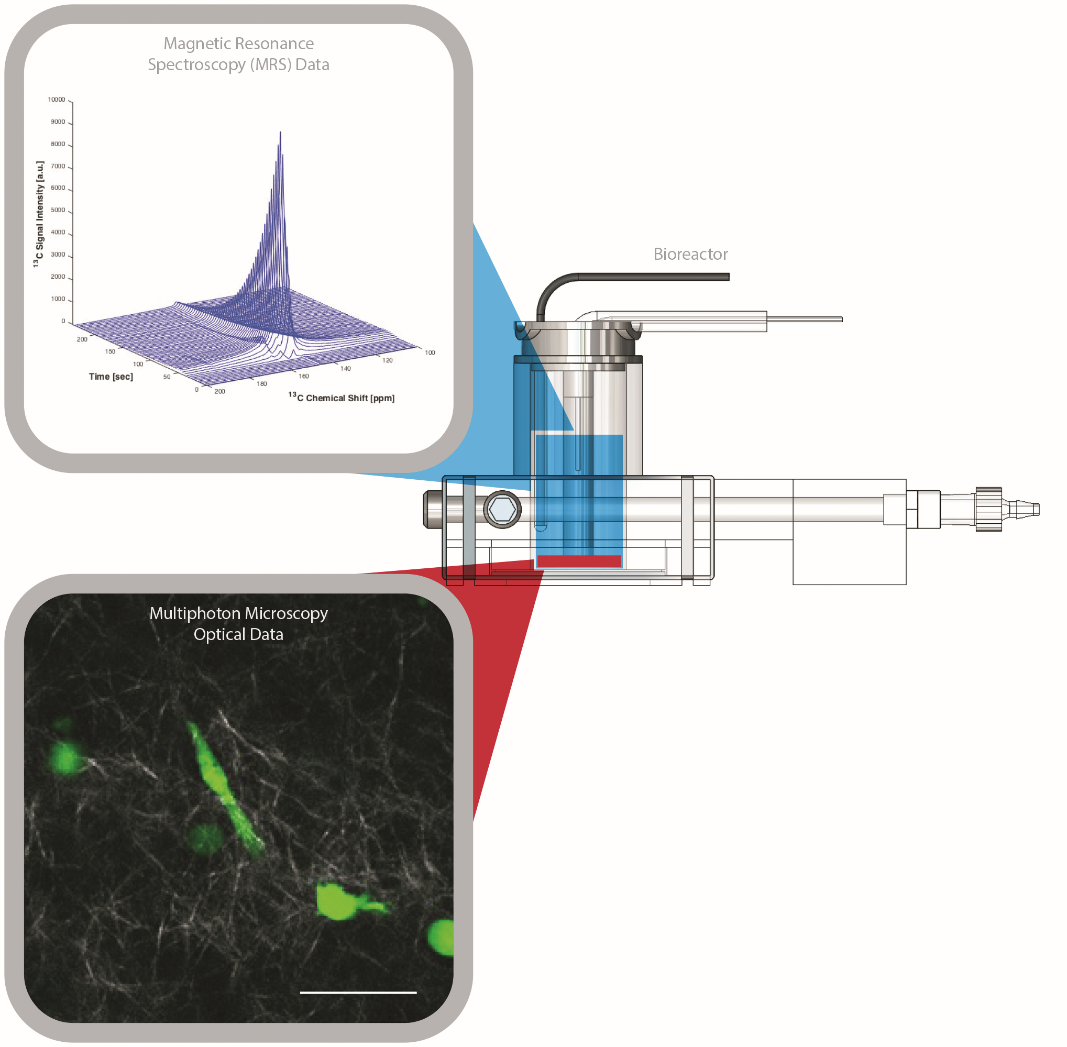
The design and implementation of a novel bioreactor capable of facilitating both magnetic resonance spectroscopy (MRS) and optical fluorescence microscopy for complementary metabolic information is described. Fluorescence lifetime imaging (FLIM) of nicotinamide adenine dinucleotide (NADH) and hyperpolarized [1-13C] pyruvic acid (PA) MRS of human breast cancer cells in a 3D collagen matrix is demonstrated. The system provides a novel test-bed for simulating cell-matrix and cell-cell interactions in a 3D microenvironment for investigating multi-scale cellular metabolism in vitro.
Introduction
Tumor metabolism is increasingly recognized as an important feature and potential therapy target in cancer1. However, many aspects of the metabolism of tumor cells and their interactions with the surrounding microenvironment are not fully understood. Fluorescence lifetime imaging (FLIM)2 based optical microscopy and hyperpolarized 13C magnetic resonance spectroscopy (MRS)3 are imaging methods that enable in vitro and in vivo imaging of cellular metabolism. FLIM can measure the rate of decay of a molecule’s fluorescence, including the metabolic cofactor nicotinamide adenine dinucleotide (NADH) whose fluorescence lifetime depends on its protein binding state allowing visualization of metabolic processes that are dominant within a cell4. Hyperpolarized MRS most commonly uses hyperpolarized [1-13C] pyruvic acid to measure metabolic products of glycolysis, especially lactate production globally for in vitro cell culture and at the tumor or organ level for in vivo studies3. As these techniques occur on very different scales they can yield complementary information at the cellular and macroscopic scales to investigate cell-cell and cell-matrix interactions and possible effects on global metabolism (Figure 1). Here, we present a multi-modal and multi-scale bioreactor capable of combined MRS and optical microscopy in 3D in vitro cell culture. The ability to image in a 3D cell culture configuration enables investigation of fundamental components mimicking the in vivo microenvironment.Methods
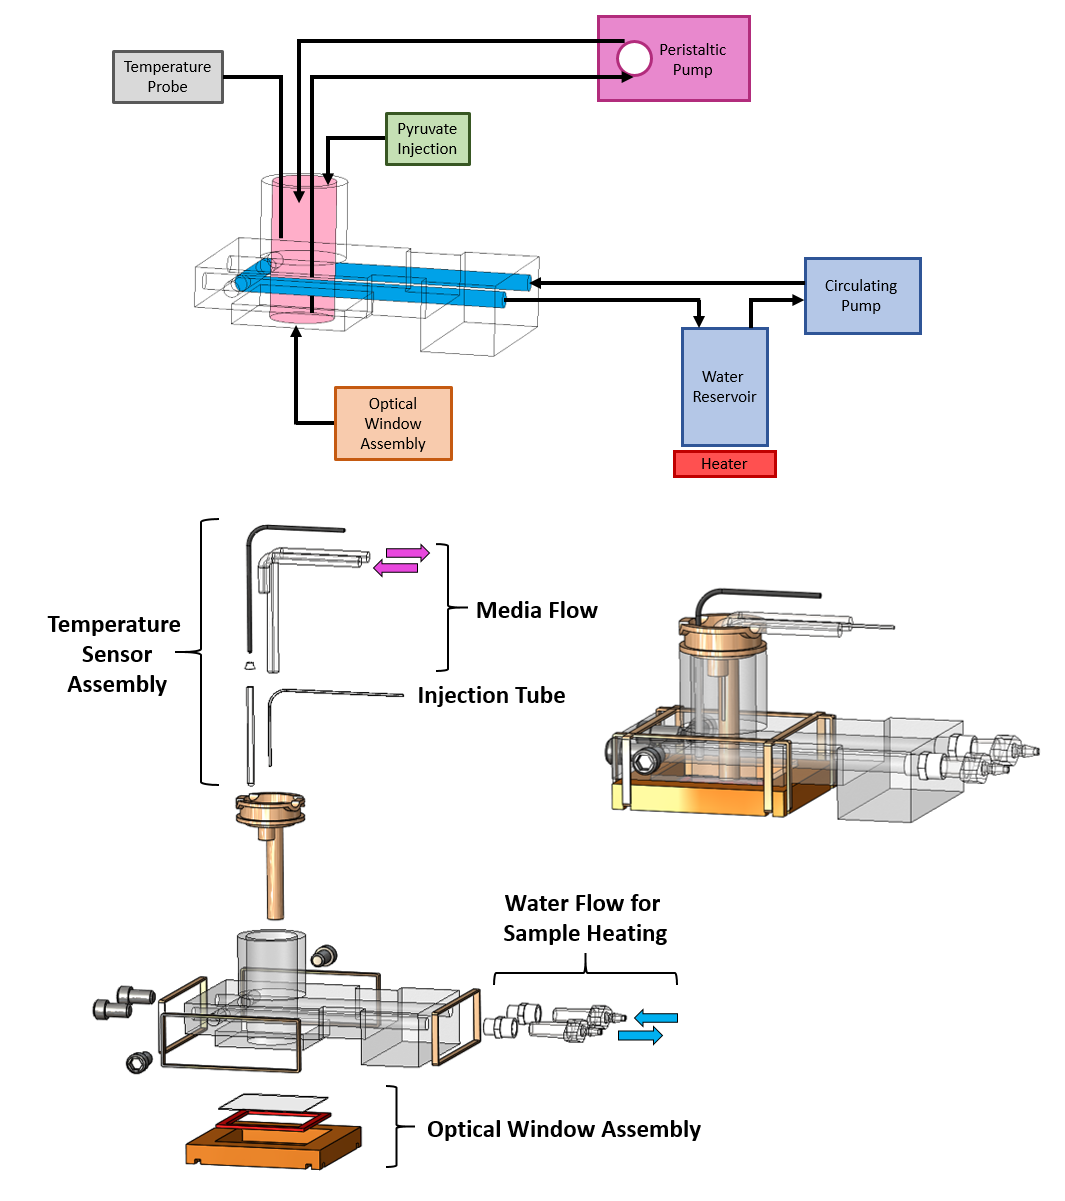
The bioreactor (Figure 2) was designed using SolidWorks software (Dassault Systemes, Velizy-Villacoublay, France). All parts will be made open-source, including the designs for the four custom components. Pictures of the experimental setup for both optical microscopy (Figure 3) and MRS experiments (Figure 4) are shown. Key supporting systems are labeled, including the heating system used for temperature control during MRS experiments (a temperature controlled box around the microscope itself is used for optical microscopy).
Collagen and green fluorescent protein (GFP) expressing MDA-MB-231 human breast cancer cells were used for all experiments as previously described5. In brief, stock collagen was neutralized for 1 hour with 2x HEPES buffer, then further diluted to 3mg/mL with cells and media. 4-8 million cells/mL were used. After polymerization of collagen, cells were allowed to grow overnight in an incubator prior to experiments. Optical imaging was performed on a custom multiphoton laser scanning system built around an inverted Nikon TE300 microscope6. MRS experiments were performed in a 4.7T pre-clinical MRI scanner (Agilent, Palo Alto, CA) using a temporally resolved pulse acquire sequence.
For MRS experiments, [1-13C] pyruvic acid (PA) was hyperpolarized as previously described7,8, but using a modified dissolution protocol. Briefly, 30µL aliquots of [1- 13C] PA (Cambridge Isotope Laboratories Inc., Tewksbury, MA) and 15mM trityl radical (Ox063, GE Healthcare) were polarized in a Hypersense polarizer (Oxford Instruments) for ~1 hour. Samples were dissoluted with 4 mL of solvent containing 1.2mL 426 mM NaOH, 1.4mL 400 mM Tris buffer and 1.4mL 250mg/L EDTA. [1-13C] PA was drawn off and 400µL were rapidly injected into the sample volume of the bioreactor. Dynamic global spectra (FA=10º, TR=3000ms) were acquired with a 13C surface coil (Varian) with transmit and receive frequencies centered on the expected pyruvate resonance.
Results
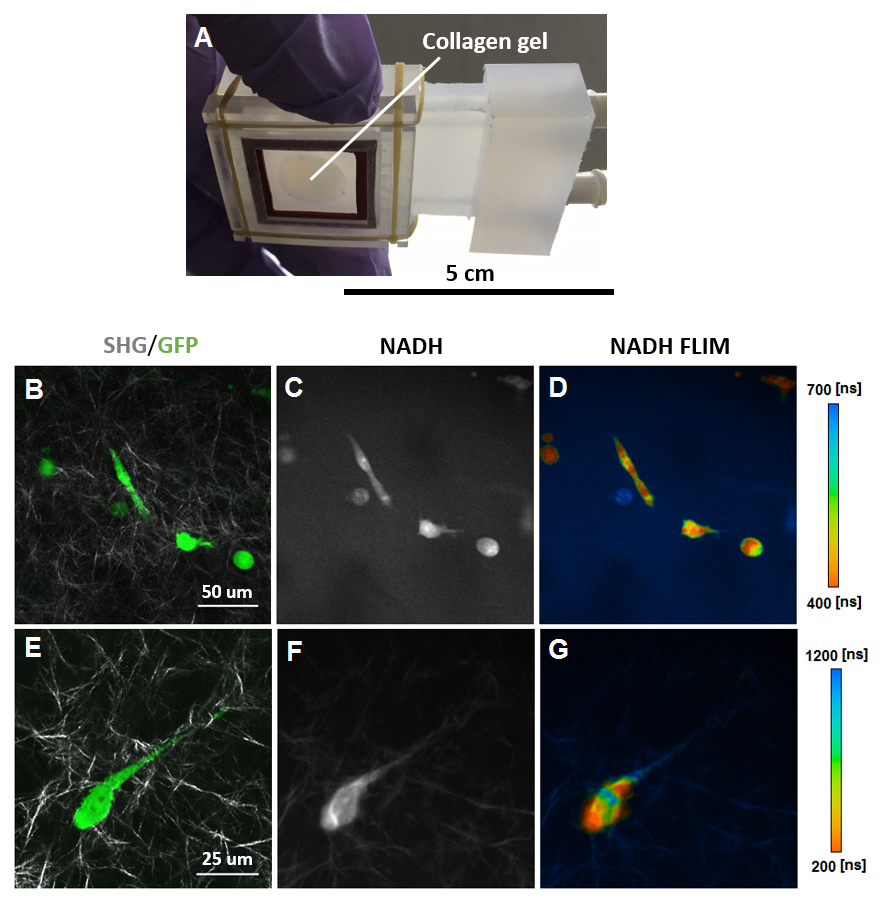
Optical microscopy data (Figure 3) shows the fluorescence signal from cells labeled by expression of GFP signal overlaid on second harmonic generation (SHG) signal of the collagen gel matrix which comprises the 3D microenvironment. Cellular metabolism is indicated by NADH fluorescence intensity and NADH fluorescence lifetime images. Note that the NADH fluorescence lifetimes vary across individual cells, indicating regions of both free (short lifetimes) and protein-bound (long lifetimes) NADH typical of normal cellular metabolism.
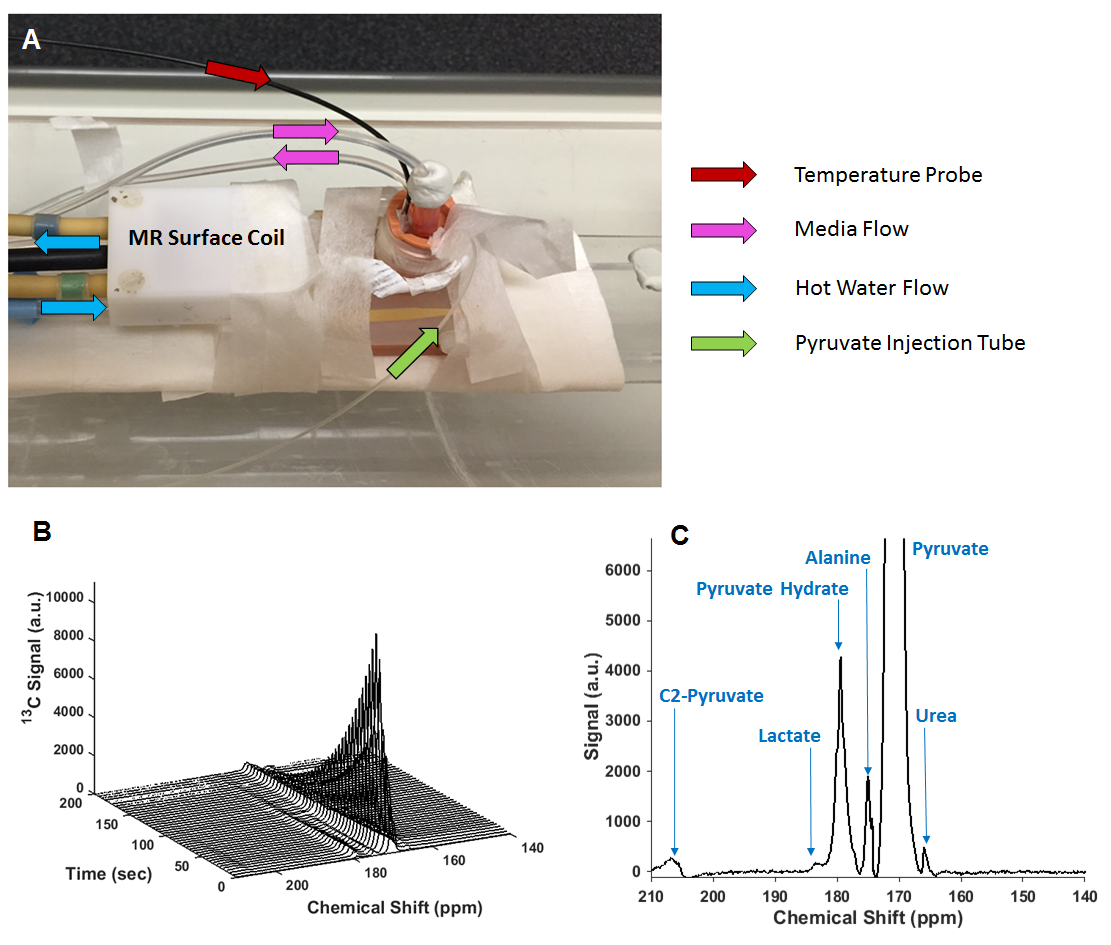
Dynamic spectra and a corresponding time-averaged spectrum (Figure 4) from a MRS experiment are also shown. Lactate, alanine and urea peaks are labeled in the time-averaged spectrum. Lactate production, in particular, is visible, but low. Circulating warm water worked well for temperature control, maintaining a sample temperature of 37±0.5 oC during all experiments.
Discussion
Alanine is relatively high compared to the lactate peak, which most likely reflects the cells in a glucose-rich and fully oxygenated state consistent with the longer observed fluorescence lifetimes observed at the cellular level. Future work will aim to study the effect of the collagen matrix, fasting, and oxygenation in different cancer cell lines.Conclusion
A bioreactor system enabling combined MRS and optical studies of 3D cell cultures in vitro is demonstrated. Hyperpolarized [1-13C] PA MRS (global metabolism) and SHG (collagen), GFP (protein expression), and NADH fluorescence lifetime (cellular metabolism) optical data are shown. This system represents a novel approach to achieving multimodal and multiscale measurement of metabolism in 3D cell cultures that mimic the cancer microenvironment in vitro.Acknowledgements
The authors would like to thank the Laboratory for Optical and Computational Instrumentation (LOCI) and the Morgridge Institute for Research for their continued support of this project. The authors would also like to acknowledge support from the Morgridge Postoctoral Program, the Departments of Medical Physics and Radiology at the authors' institution, the AAPM Graduate Fellowship, and GE Healthcare.References
1. L. M. Phan, S.-C. J. Yeung, M.-H. Lee. Cancer metabolic reprogramming: importance, main features, and potentials for precise targeted anti-cancer therapies. Cancer Biol Med. 2014; 11(1):1-19.
2. C. W. Chang, D. Sud, M.-A. Mycek. Fluorescence lifetime imaging microscopy. Methods Cell Biol. 2007; 81:495-524.
3. F. A. Gallagher, S. E. Bohndiek, M. I. Kettunen, D. Y. Lewis, D. Soloviev K. M. Brindle. Hyperpolarized 13C MRI and PET: in vivo tumor biochemistry. J Nucl Med Off Publ Soc Nucl Med. 2011; 52(9):1333-1336.
4. D. S. Elson, I. Munro, J. Requejo-Isidro, J. McGinty, C. Dunsby, N. Galletly, G. W. Stamp, M. a. A. Neil, M. J. Lever, P. A. Kellett, A. Dymoke-Bradshaw, J. Hares, P. M. W. French. Real-time time-domain fluorescence lifetime imaging including single-shot acquisition with a segmented optical image intensifier. New J Phys. 2004; 6(1):180.
5. B. Burkel, B. A. Morris, S. M. Ponik, K. M. Riching, K. W. Eliceiri, P. J. Keely. Preparation of 3D Collagen Gels and Microchannels for the Study of 3D Interactions In Vivo. J Vis Exp JoVE. 2011; 111.
6. D.L. Wokosin, J.M. Squirrell, K.W. Eliceiri, J.G. White. Optical workstation with concurrent, independent multiphoton imaging and experimental laser microbeam capabilities. Rev Sci Instrum. 2003; 74(1):193-201.
7. J. W. Gordon, D. J. Niles, E. B. Adamson, K. M. Johnson, S. B. Fain. Application of Flow Sensitive Gradients for Improved Measures of Metabolism Using Hyperpolarized 13C MRI. Magn Reson Med. 2016; 75(3):1242-1248.
8. J. W. Gordon, S. B. Fain, D. J. Niles, K. D. Ludwig, K. M. Johnson, E. T. Peterson. Simultaneous Imaging of 13C Metabolism and 1H Structure: Technical Considerations and Potential Applications. NMR Biomed. 2015; 28(5):576-582.
Figures