0753
Using Machine Learning to study knee Osteoarthritis: the path towards OA Precision Medicine1University Of California, San Francisco, San Francisco, CA, United States, 2Memorial Sloan Kettering Cancer Center, New York, New York, NY, United States
Synopsis
In this study we describe the analysis of a dataset including 178 subjects with and without Osteoarthritis using Topological data analysis (TDA), a machine-learning tool that involves projecting individual patients into the ‘syndromic space’ defined by all outcome variables simultaneously. Demographics, patient reported outcomes Kellgren-Lawrence grading, MRI WORMS morphological grading, cartilage relaxation times, gait kinematics and kinetics during walking were simultaneously considered to define the data topology. TDA shows the presence of subgroups characterized by a strong biochemical signature, showing how this new technique could be used to extract insight from complex data, allowing for more personalized characterization of each individual.
Introduction
Osteoarthritis (OA) is a degenerative disease in which abnormalities of one joint component lead to damage of others resulting collectively in overall organ failure1. The past decade has been marked by the increased role of noninvasive imaging and biomechanics for diagnosing, monitoring and assessing the extent of whole joint degeneration2. However, OA research has often limited to considering at the time of the analysis morphological3, biochemical4, biomechanical5 biomarkers as single or associated factors6. Recent innovations in machine learning allow for large-scale data integration, and multidimensional visualization to compare individual patients in a multidimensional space, overcoming the inherent limitations of single endpoints7. Topological data analysis (TDA) is a machine-learning tool that involves projecting individual patients into the ‘syndromic space’ defined by all outcome variables simultaneously. TDA was successfully adopted in several domains8,9, but never before it has been applied to study osteoarthritis. In the present study, we harnessed TDA for integrated assessment of morphological, biomechanical and biochemical features in OA with the aim of patient’s phenotyping and to study the interaction between features.Methods
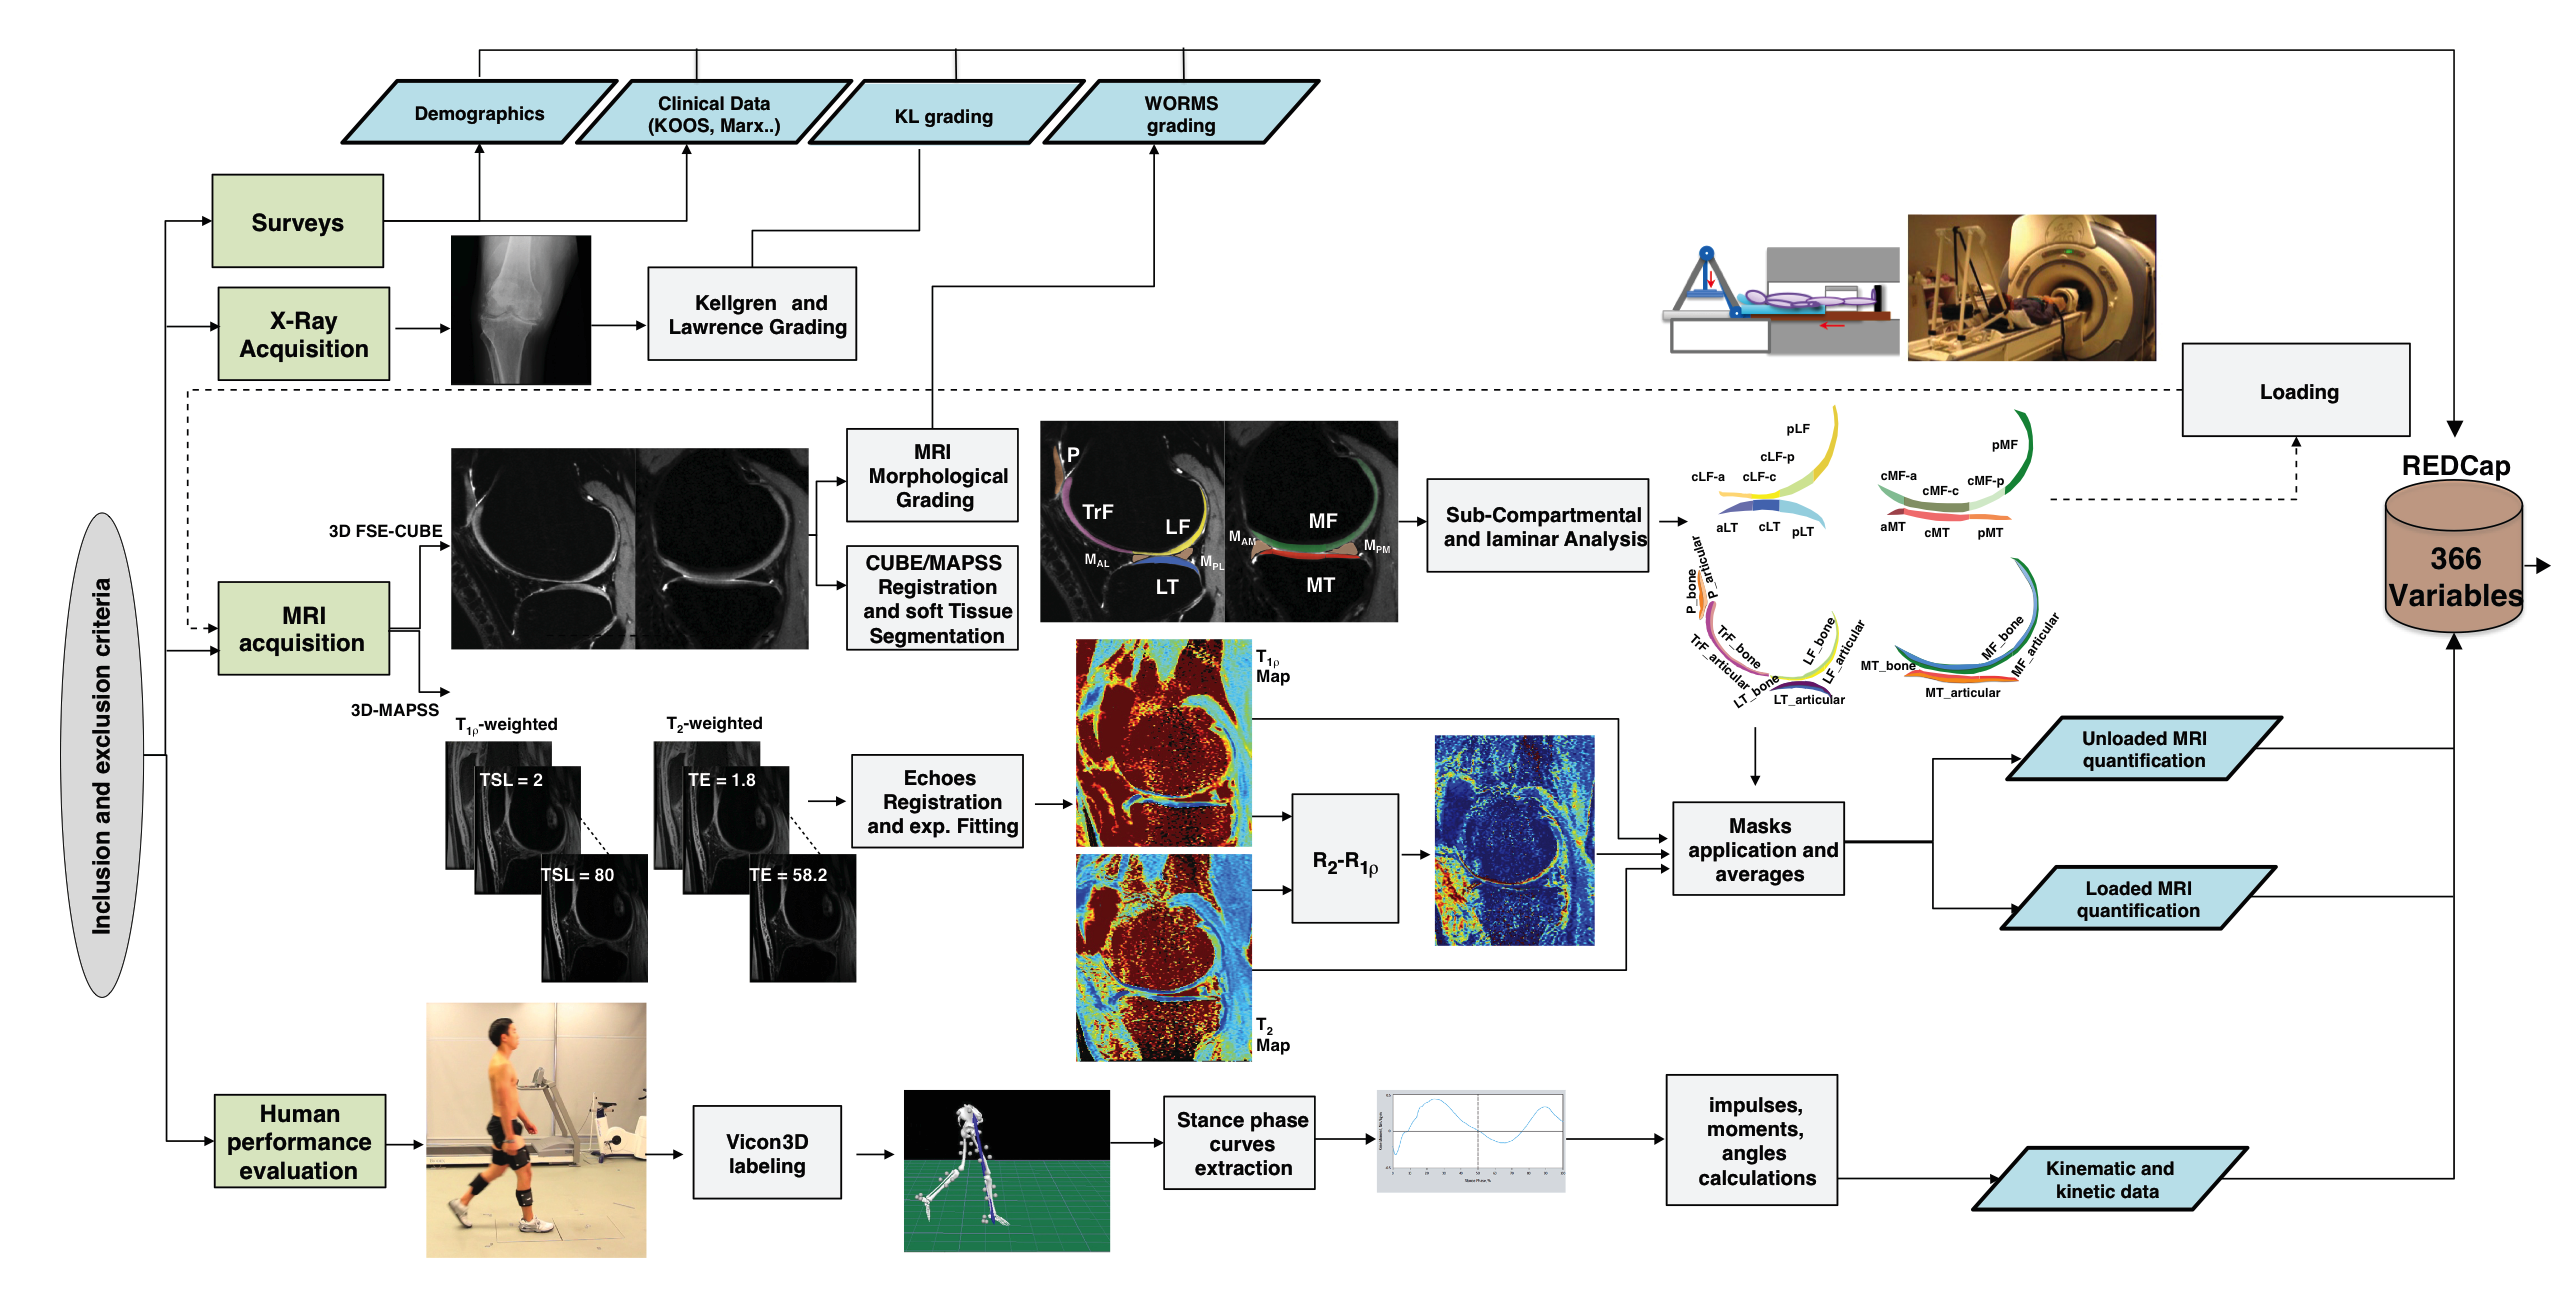
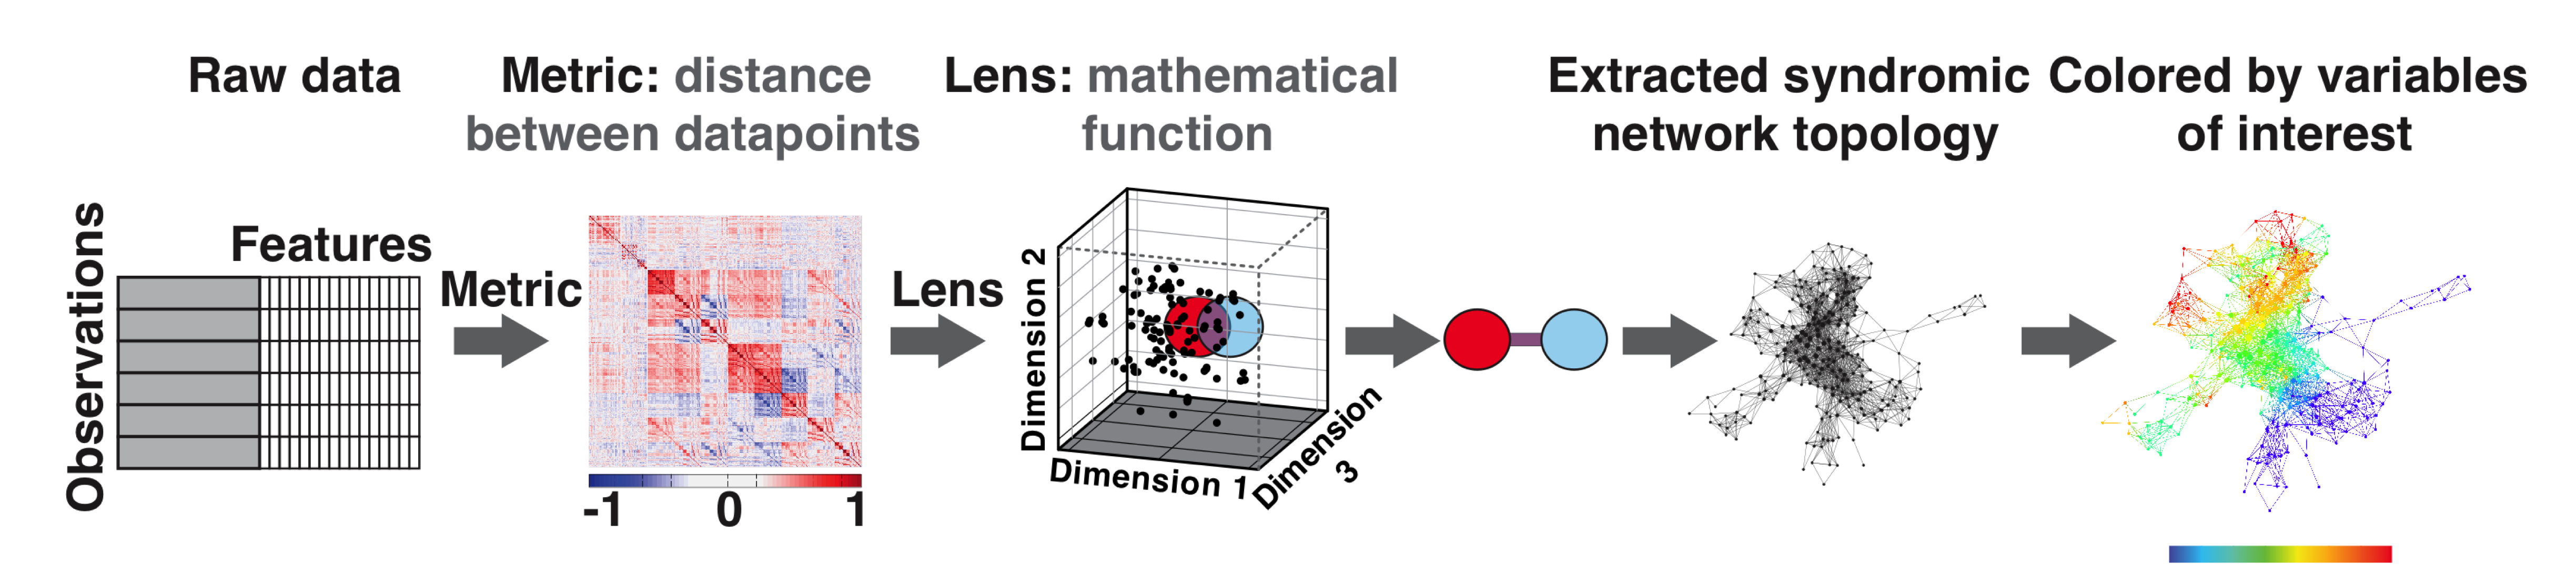
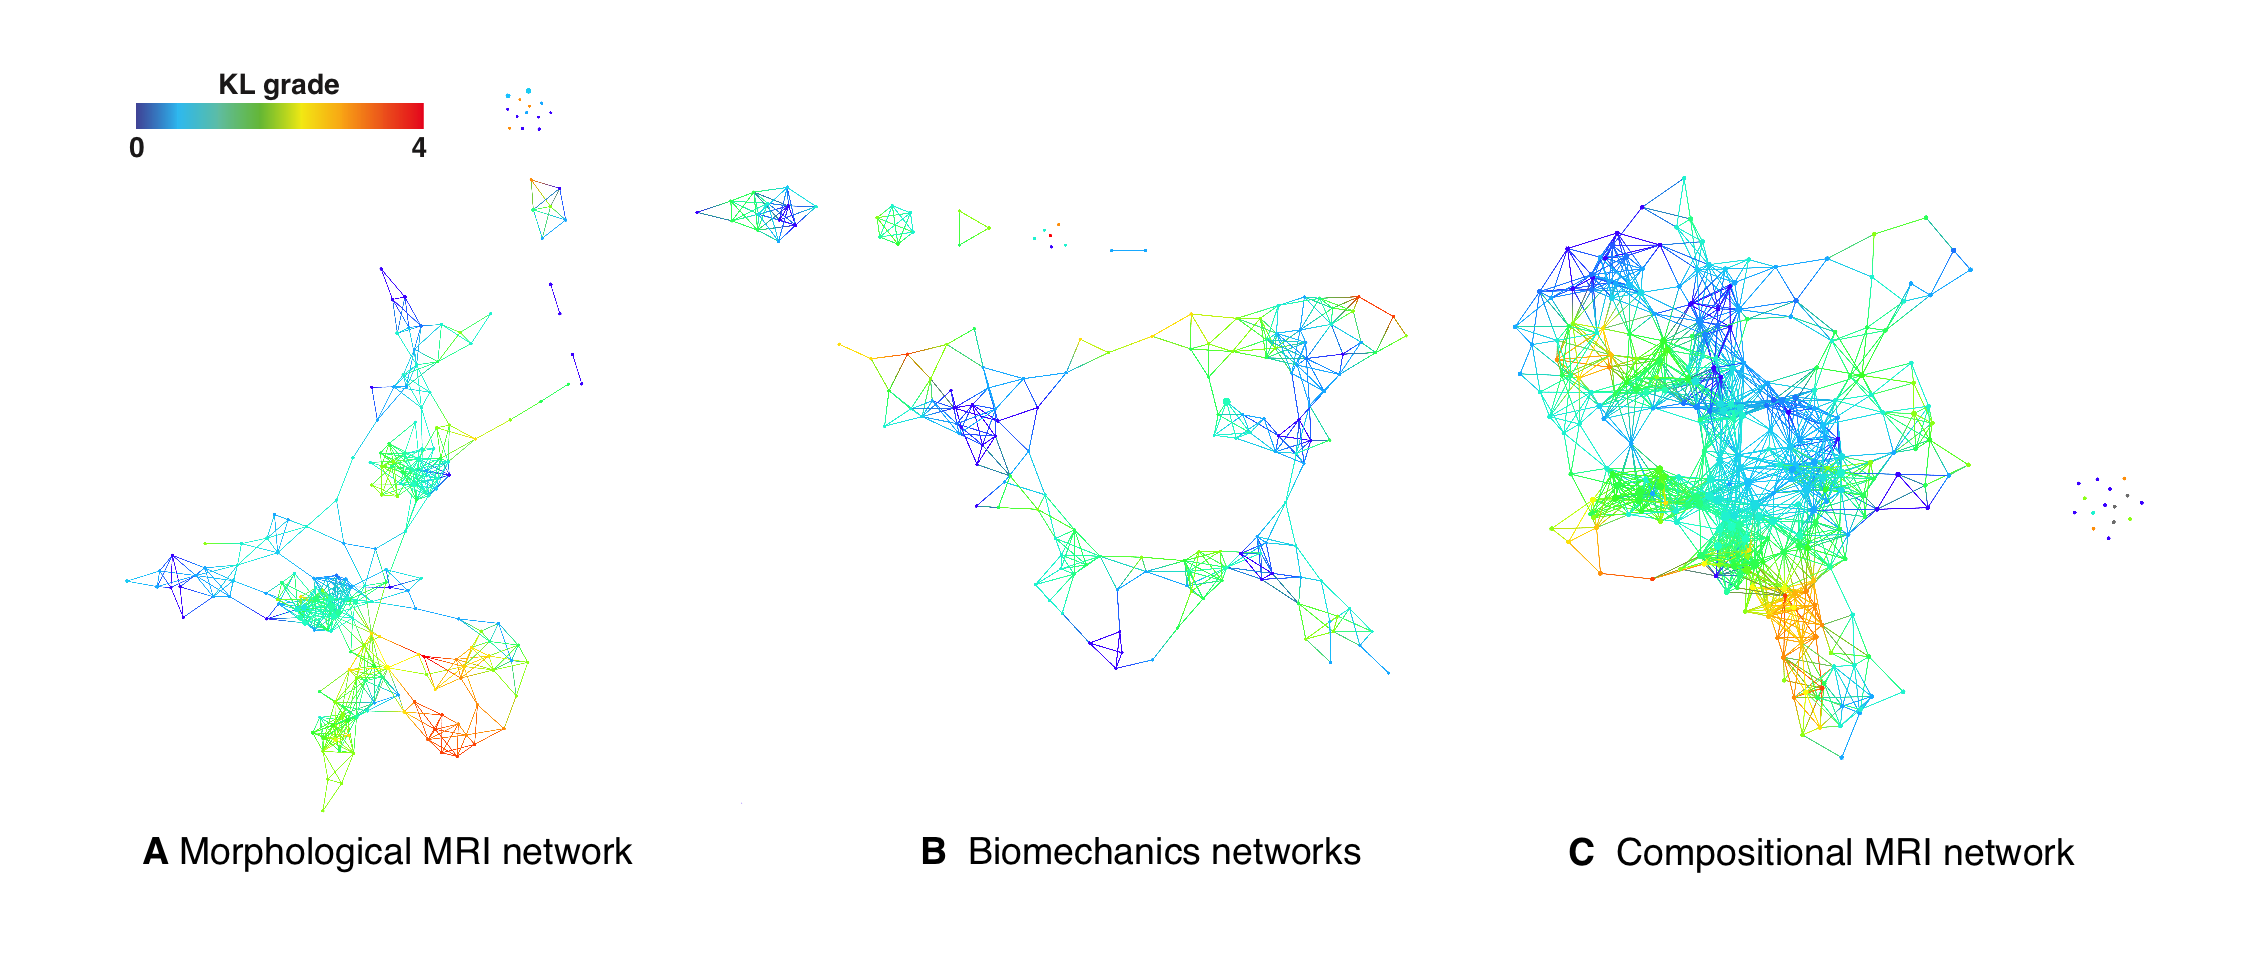
178 subjects were recruited for this study (N=57 KL>1 age 57.30±8.9, BMI 25.08±3.37; N=121 KL 0-1: age 49.19±8.33, BMI 24.35±3.54). Demographics, patient reported outcomes including: KOOS, Marx activity score, IPAQ, plain radiograph Kellgren-Lawrence grading, MRI WORMS morphological grading, cartilage T1ρ,T2 ,and R2-R1ρ (1/T2-1/T1ρ) relaxation times in loaded and unloaded conditions in cartilage global compartments, sub-compartments and layers, gait kinematics and kinetics during walking were collected and quantified, as shown in Figure 1, building for each subject a 366D heterogeneous feature vector. TDA was adopted to automatically render cross correlations across all predictors simultaneously7, obtaining a network that describe relationship between the subjects in the multidimensional feature space (Figure 2). Similar individuals were grouped into nodes. Individuals that appear in two different nodes were shown as connecting lines between nodes. The obtained networks were colored using one of the endpoints for visual interpretation. Separate networks were built using morphological MRI grading (Figure 3A), biomechanics (Figure 3B), compositional MRI (Figure 3C) and the combination of all the outcome variables (Figure 4). The four networks were rendered using KL grading. We next performed TDA on the quantitative measures alone, in the absence of clinical morphological MR grading information, to assess the feasibility of using TDA on quantitative measures as an automated clinical decision-support tool for the identification of subpopulations. Kolmogorov-Smirnov (K-S) test was used to verify the hypothesis generated by the visual interpretation of the networks, Benjamin Hochberger correction was used to adjust for multiple comparisons.Results
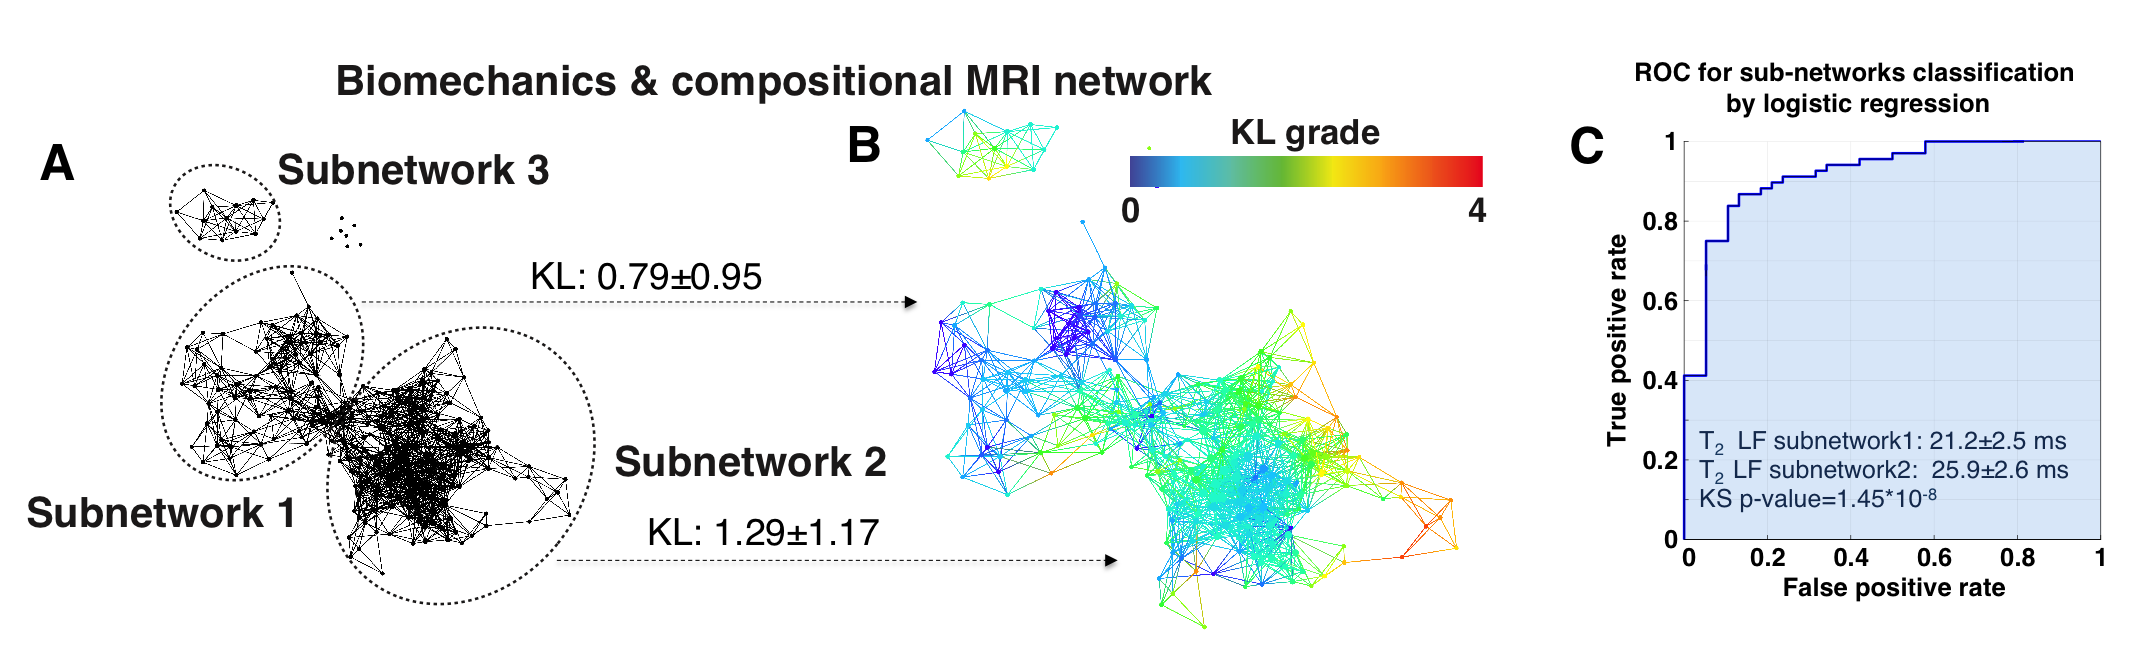
While both the morphological MRI and compositional MRI networks showed a clear subpopulation of subjects with definite signs of radiographic OA (red nodes in Figure 3) the biomechanical network showed less accuracy for distinguishing different KL grades. However, TDA extracted on the combined outcome domains of morphological MRI grading, biomechanics and compositional MRI (Figure 4) demonstrated improved accuracy and precision for KL grades, producing a clearly polarized network with severe patients appearing in the lower right and less severe in the upper left. Considering biomechanics and compositional MRI variables alone a clear network composed of 3 distinct subnetworks emerged as shown in Figure 5A. Significant KL differences were observed between the two main subnetworks, KL subnetwork1: 0.79±0.95, KL subnetwork2 1.29±1.17 p=0.010 (Figure 5B). Kolmogorov-Smirnov (K-S) test revealed 149 variables as significant predictors of subnetwork’ membership. Including T1ρ and T2 relaxation times (T2 LF subnetwork1: 21.2±2.5ms; T2 LF subnetwork2: 25.9±2.6ms KS p-value=1.45*10-8 T1ρ MT subnetwork1: 25.43±3.8ms; T1ρ MT subnetwork2: 28.96±3.31ms KS p-value=1.05*10-5). Patients in subnetwork 1 had 6.78% and 5.24% more intact medial and lateral femoral cartilage, 6.03% more intact medial meniscus body. 8.68% more Asian subjects are observed in subnetwork1 compared to subnetwork2. Logistic regression was used to assess the subnetworks’ classification performance using T2 LF alone (ROC-AUC: 91.06%, 95%C.I. 85.65%-96.46%, sensitivity 86.76% specificity 86.84%, Figure 5C).Discussion and Conclusions
in this study we presented the first application of TDA in OA. The results obtained revealed the presence of subjects’ subgroups. The data-driven clustering obtained with TDA proposes a new phenotyping of these subjects that is just in part overlapped to the classical radiographic-based disease status classification; and instead it defines distinctive subgroups characterized by a strong biochemical signature. The analysis performed in this study shows how TDA could be potentially used to extract insight from complex data, allowing for more personalized characterization of each individual. Further study on larger datasets and analyzing longitudinal changes in data topology are needed for a further assessment of TDA’s potential for OA clinical utility.Acknowledgements
Craig H. Neilsen Foundation (JH and ARF), R01NS067092 (ARF), R01NS088475 (ARF), Wings for Life (ARF), P50 AR060752 (SM), R01 AR062370 (RS), R01AR046905 (SM)References
[1] Peterfy, C.G., et al. Whole-Organ Magnetic Resonance Imaging Score (WORMS) of the knee in osteoarthritis. Osteoarthritis and cartilage / OARS, Osteoarthritis Research Society 12, 177-190 (2004). [2] Li, X. & Majumdar, S. Quantitative MRI of articular cartilage and its clinical applications. Journal of magnetic resonance imaging : JMRI 38, 991-1008 (2013). [3] Eckstein, F., et al. Brief Report: Cartilage Thickness Change as an Imaging Biomarker of Knee Osteoarthritis Progression: Data From the Foundation for the National Institutes of Health Osteoarthritis Biomarkers Consortium. Arthritis & rheumatology 67, 3184-3189 (2015). [3] Stahl, R., et al. Osteoarthritis of the knee at 3.0 T: comparison of a quantitative and a semi-quantitative score for the assessment of the extent of cartilage lesion and bone marrow edema pattern in a 24-month longitudinal study. Skeletal radiology 40, 1315-1327 (2011 [4] Li, X., et al. In vivo T(1rho) and T(2) mapping of articular cartilage in osteoarthritis of the knee using 3 T MRI. Osteoarthritis Cartilage 15, 789-797 (2007). ). [5] Felson, D.T. Osteoarthritis as a disease of mechanics. Osteoarthritis and cartilage / OARS, Osteoarthritis Research Society 21, 10-15 (2013). [6] Teng, H.L., et al. Associations between patellofemoral joint cartilage T1rho and T2 and knee flexion moment and impulse during gait in individuals with and without patellofemoral joint osteoarthritis. Osteoarthritis and cartilage / OARS, Osteoarthritis Research Society (2016). [7] Lum, P.Y., et al. Extracting insights from the shape of complex data using topology. Scientific reports 3, 1236 (2013). [8] Yao, Y., et al. Topological methods for exploring low-density states in biomolecular folding pathways. The Journal of chemical physics 130, 144115 (2009). [9] Nielson, J.L., et al. Topological data analysis for discovery in preclinical spinal cord injury and traumatic brain injury. Nature communications 6, 8581 (2015)Figures