0751
Separating positive and negative susceptibility sources in QSM1Department of Electrical and Computer Engineering, Seoul National University, Seoul, Korea, Republic of, 2Department of Radiology, Seoul St. Mary’s Hospital, College of Medicine, The Catholic University of Korea, Seoul, Korea, Republic of
Synopsis
We proposed a new QSM algorithm that separates positive and negative susceptibility sources within a voxel by utilizing signal relaxation (R2') for dipole inversion. The new method was tested in computer simulated phantoms and in-vivo data, and successfully separated positive and negative susceptibility sources.
Purpose
QSM is a tool to quantify magnetic susceptibility in the brain where both positive (e.g. iron) and negative (e.g. myelin) susceptibility (relative to water) sources exist. So far, the method measures averaged susceptibility and cannot separate positive and negative sources if they co-exist within a voxel. In this study, we developed a new QSM algorithm that generates positive and negative susceptibility maps.Methods
[New QSM algorithm] When susceptibility sources exist in a magnetic field, they induce magnetic field perturbation that can be formulated as f = Dp*χ where f is frequency shift from magnetic field perturbation, Dp is a so-called dipole kernel, and χ is susceptibility. This formulation can be rewritten as follows when the susceptibility sources are divided by their signs: $$f= D_p*(\chi_{pos}+\chi_{neg})\:\:\:\:\:\:\:\:\:[Eq.1]$$ where χpos(>0), and χneg(<0) are positive and negative susceptibility respectively. This formula suggests that if both positive and negative sources co-exist in a voxel, total susceptibility effects on f will decrease.
In magnitude signal relaxation, R2' (=R2*-R2) can be considered to be affected by the absolute susceptibility amount and can be formulated as follows: $${R_2}^{'}= D_m*(|\chi_{pos}|+|\chi_{neg}|)\:\:\:\:\:\:\:\:\:[Eq.2]$$ where Dm is a magnitude decay kernel. This formula assumes that susceptibility sources are far away from each other and R2' changes linearly with absolute susceptibility. The magnitude decay kernel is assumed to be a delta function (i.e. susceptibility effects on R2' is localized within a voxel). The amplitude of Dm is determined as 124Hz/ppm.1
Considering both frequency shifts and signal relaxation, a new QSM algorithm is modeled as follows:$$argmin_{\chi_{pos},\chi_{neg}}|({R_2}^{'}+i2\pi f)-D_m*(|\chi_{pos}|+|\chi_{neg}|)-i2\pi D_p*(\chi_{pos}+\chi_{neg})|+\lambda |g(\chi_{pos},\chi_{neg})|\:\:\:\:\:\:\:\:\:[Eq.3]$$
where g(χpos, χneg) is an optional regularization term to reduce streaking artifacts (MEDI was utilized in this study),2 and λ is a regularization factor. The formula was solved iteratively by updating and sequentially using conjugate gradient.
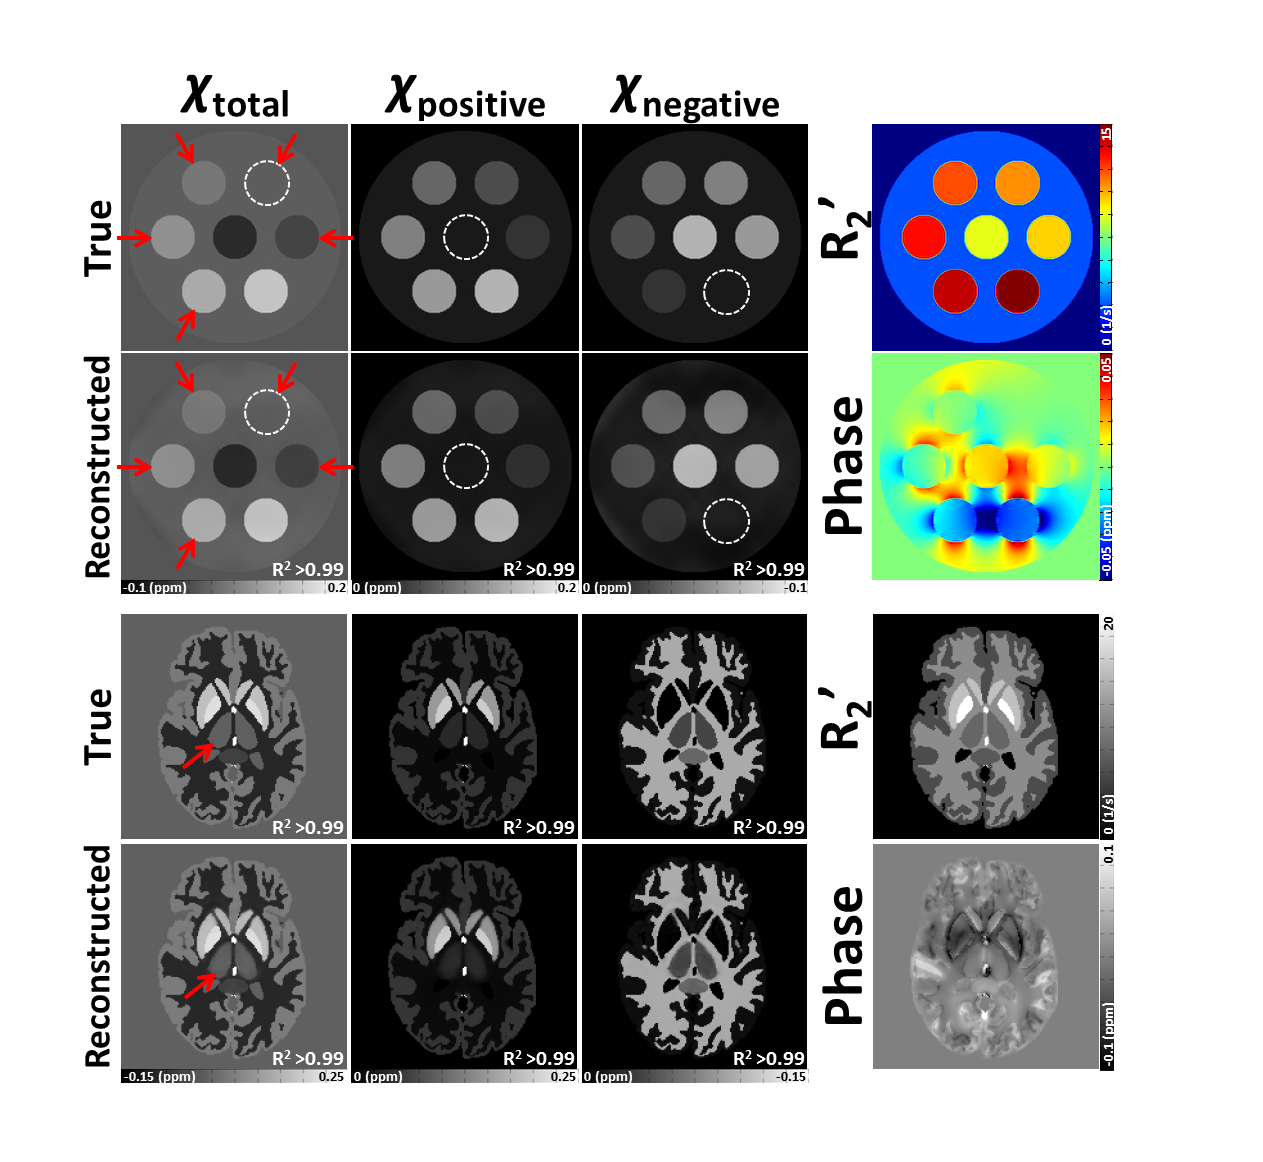
[Simulation] A geometric phantom and a Zubal phantom3 were utilized to test the new algorithm. Both positive and negative susceptibility were assigned with corresponding R2' (Fig. 1).
[Experiment] Data were acquired at 3T. GRE was acquired: FOV=192×192×120mm3, resolution=1×1×2mm3, TR=53ms, and TE=3.71:5.8:28.51ms. To estimate R2', an R2 map was acquired using multi-echo spin-echo (TR=5160ms, and TE=30:30:90ms). Additional GRE was acquired for gradient-echo myelin water imaging (GRE-MWI): FOV=208×256×48mm3, resolution=2×2×2mm3, TE=2.4:2.2:34.8ms.
To estimate a R2' map, R2* (and R2) maps were generated by mono-exponential fitting to the multi-echo data. A frequency shift map was calculated from the GRE data after background field removal.4 For a comparison, conventional QSM2 and GRE-MWI5 images were generated.
Results
In the phantom study, the proposed method successfully reconstructed susceptibility, separating the positive and negative susceptibility sources that coexisted in a voxel. (Fig. 1; R2>0.99).
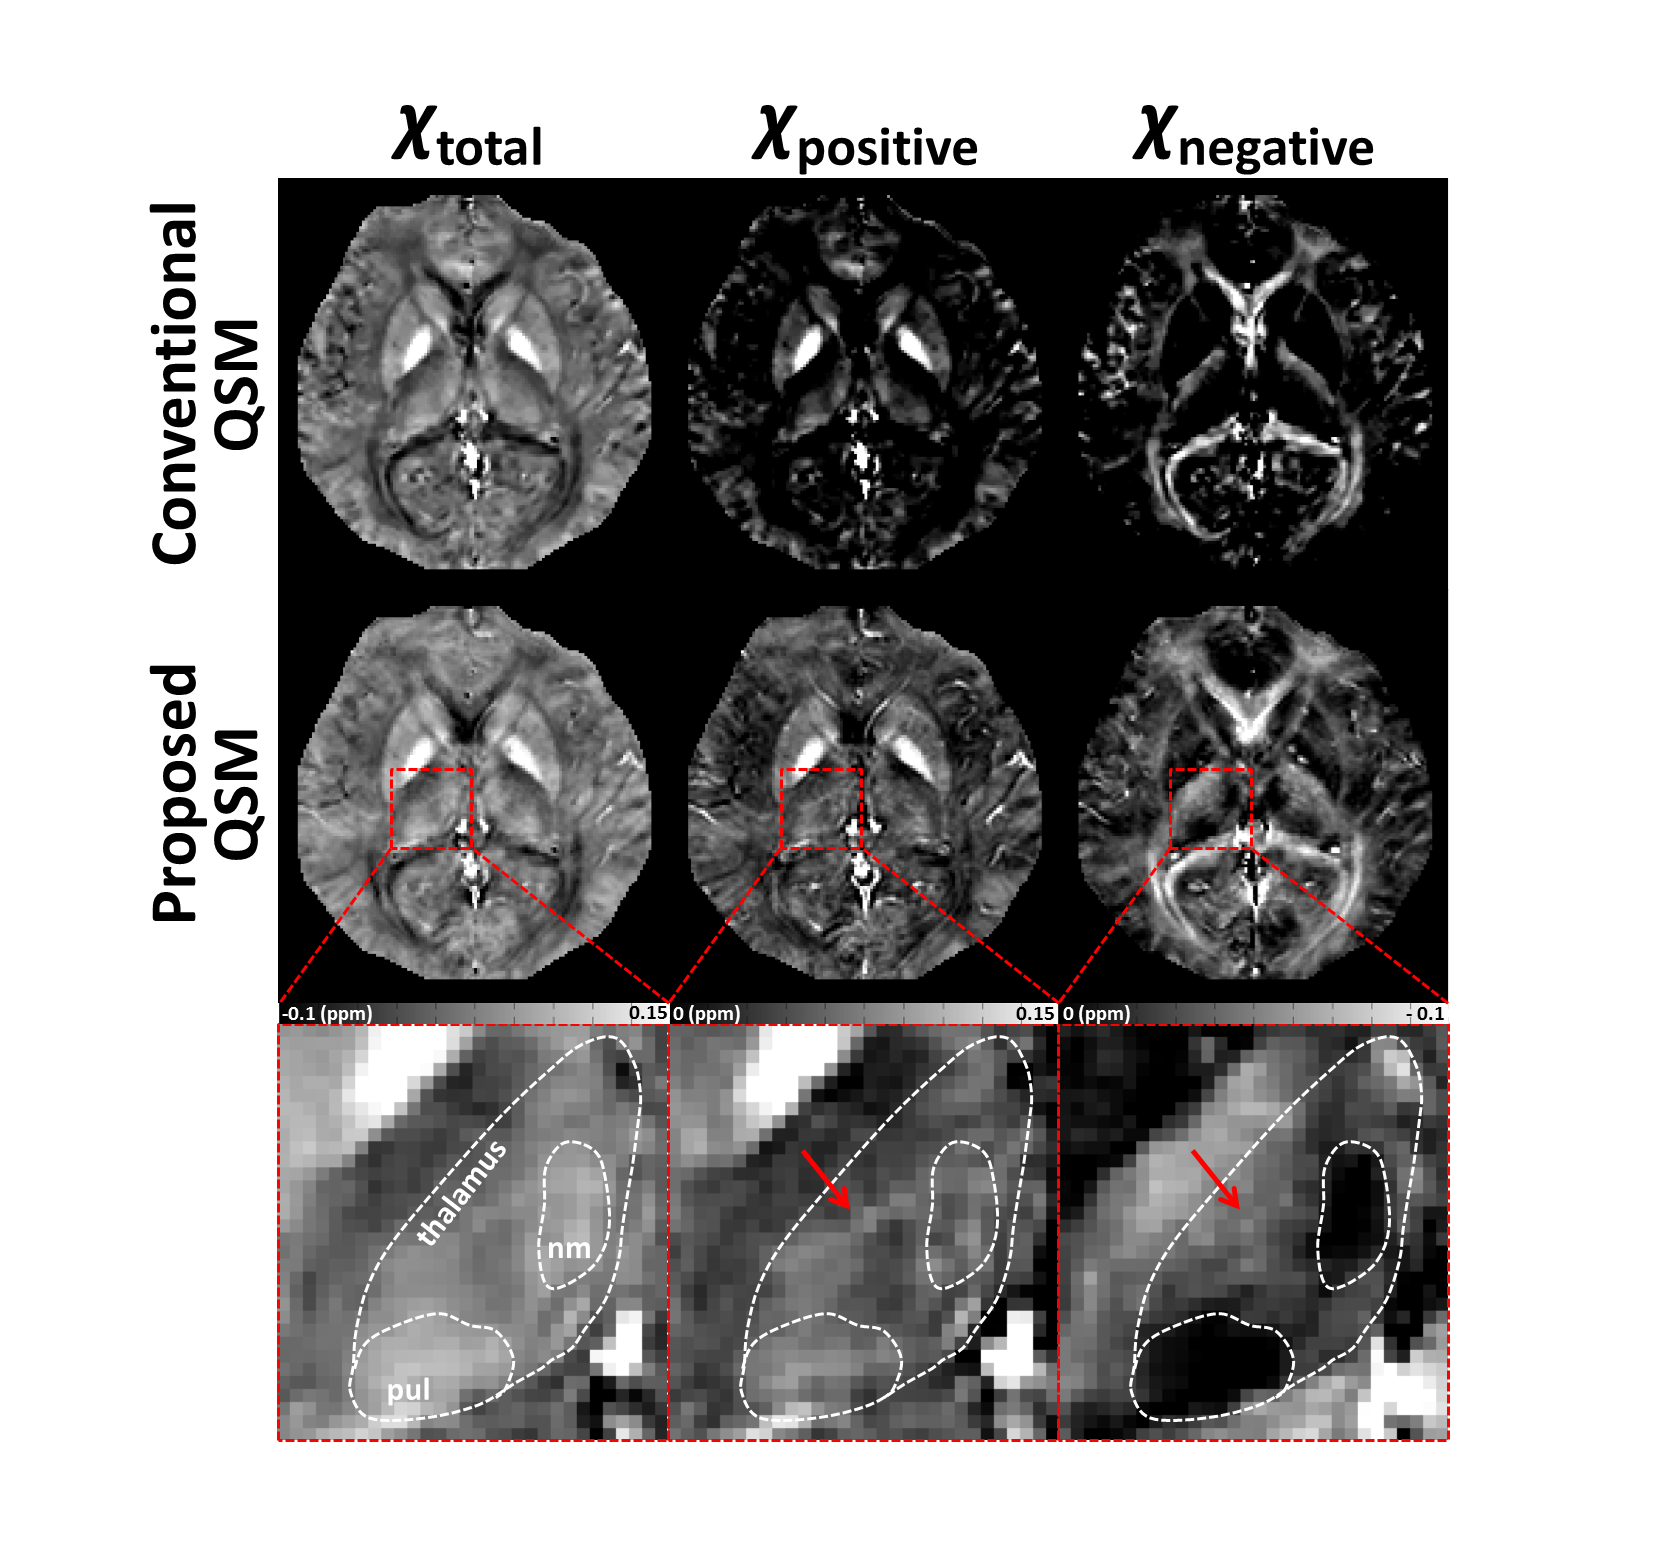
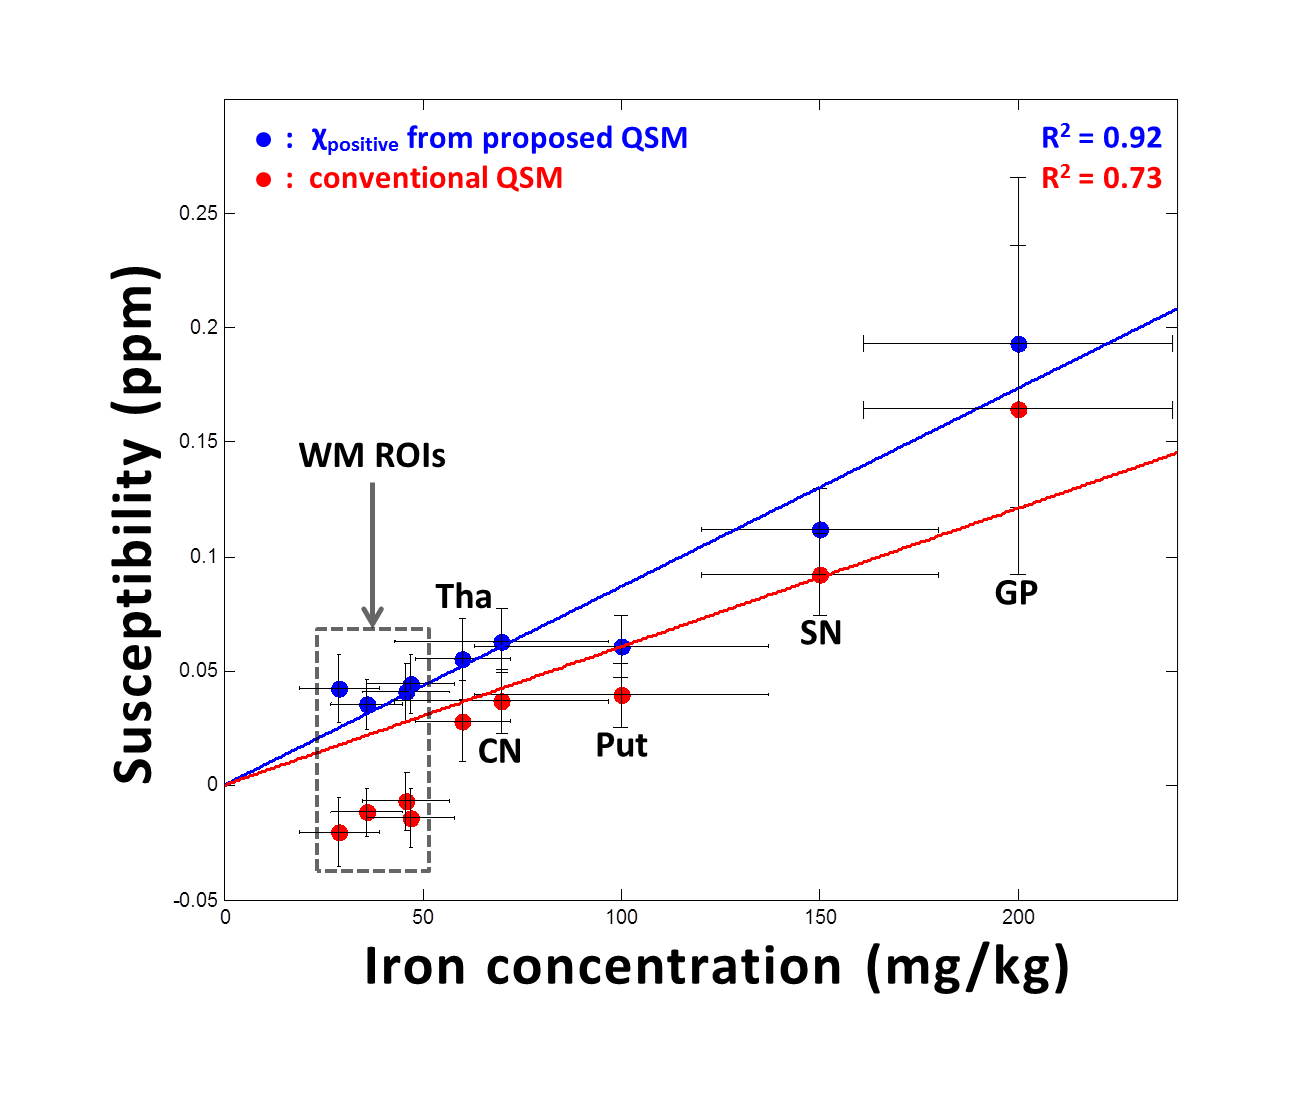
In in-vivo data, the total susceptibility map of the proposed QSM shows similar susceptibility distribution to the conventional QSM map in Figure 2 (left column). On the other hand, only the proposed method reveals voxels that contain both postive and negative susceptibilty sources (Fig.2; middle and right columns). The positive susceptibility map of the proposed QSM reveals moderate susceptibility concentration in white matter (Fig.2; middle column). The zoomed-in area shows thalamus (Fig.2; bottom row), which includes well-known iron-rich but myelin-lacking pulvinar and nucleus medialis.6,7 These sub-thalamic areas are clearly delineated only in the proposed method (χnegative). The rest of thalamus reveals coexistence of positive and negative susceptibilty sources (red arrows) that has been previously reported.8 In Figure 3, the positive susceptibility map of the proposed QSM is compared with iron concentration from literatures in a few ROIs.1,9 The ROI values from the proposed method show a strong linear relationship (R2=0.92) with the literature values including the white matter ROIs. On the other hand, the conventional QSM results show lower R2 (=0.73) and substantially underestimated susceptibility in the white matter ROIs, most likely, due to negative myelin susceptibility that is not separated.
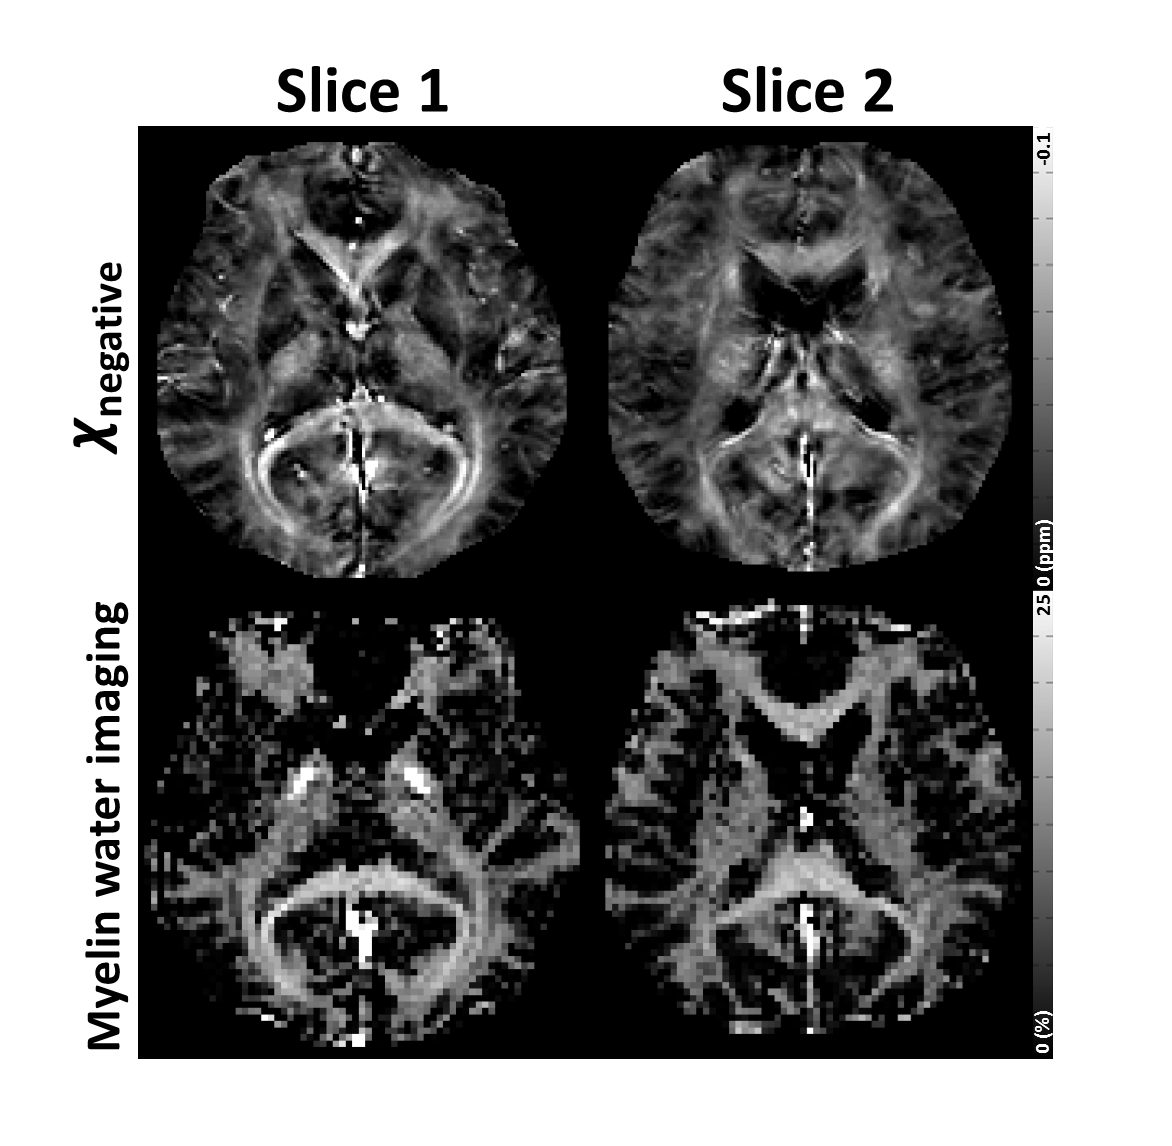
In Figure 4, comparison of the negative susceptibility map and the myelin concentration map from GRE-MWI reveals a good similarity, suggesting that myelin susceptibility has a substantial contribution in the negative susceptibility map.
Conclusion and Discussion
Here, a new QSM algorithm that separates positive and negative susceptibility sources is proposed. The algorithm has a few assumptions. First, we assumed that individual susceptibility source is distant from each other, avoiding phase cancellation within a voxel. In reality, however, iron and myelin may coexist in a close distance, violating this assumption. Additionally, Dm is assumed as a delta function, which may need to be revised more realistically. Our algorithm only considers isotropic susceptibility, ignoring susceptibility/microstructural anisotropy and exchange.11-13 The need for R2 requires additional scan time. Alternatively, R2* or nominal R2 removed R2*, which introduces a bias, can be used.Acknowledgements
This work was supported by the National Research Foundation of Korea (NRF) Grant funded by the Korean Government (No. NRF-2015M3C7A1031969), and by the Brain Korea 21 Plus Project in 2016.References
[1] Langkammer, Christian, et al. Quantitative susceptibility mapping (QSM) as a means to measure brain iron? A post mortem validation study. Neuroimage 62.3 (2012): 1593-1599.
[2] Liu, Tian, et al. Morphology enabled dipole inversion (MEDI) from a single-angle acquisition: comparison with COSMOS in human brain imaging. Magnetic resonance in medicine 66.3 (2011): 777-783.
[3] Zubal, I. George, et al. Computerized three-dimensional segmented human anatomy. Medical physics 21.2 (1994): 299-302.
[4] Liu, Tian, et al. A novel background field removal method for MRI using projection onto dipole fields (PDF). NMR in Biomedicine 24.9 (2011): 1129-1136.
[5] Nam, Yoonho, et al. Improved estimation of myelin water fraction using complex model fitting. NeuroImage 116 (2015): 214-221.
[6] Bender, B., et al. Optimized 3D magnetization-prepared rapid acquisition of gradient echo: identification of thalamus substructures at 3T. American Journal of Neuroradiology 32.11 (2011): 2110-2115.
[7] Drayer, Burton, et al. Magnetic resonance imaging of brain iron. American journal of neuroradiology 7.3 (1986): 373-380.
[8] Deistung, Andreas, et al. Toward in vivo histology: A comparison of quantitative susceptibility mapping (QSM) with magnitude-, phase-, and R2*-imaging at ultra-high magnetic field strength. Neuroimage 65 (2013): 299-314.
[9] Schweser, Ferdinand, et al. Quantitative imaging of intrinsic magnetic tissue properties using MRI signal phase: an approach to in vivo brain iron metabolism?. Neuroimage 54.4 (2011): 2789-2807.
[10] Straub, Sina, et al. Suitable reference tissues for quantitative susceptibility mapping of the brain. Magnetic Resonance in Medicine (2016).
[11] Lee, Jongho, et al. Sensitivity of MRI resonance frequency to the orientation of brain tissue microstructure. Proceedings of the National Academy of Sciences 107.11 (2010): 5130-5135.
[12] Wharton, Samuel, and Richard Bowtell. Fiber orientation-dependent white matter contrast in gradient echo MRI. Proceedings of the National Academy of Sciences 109.45 (2012): 18559-18564.
[13] Shmueli, Karin, et al. The contribution of chemical exchange to MRI frequency shifts in brain tissue. Magnetic resonance in medicine 65.1 (2011): 35-43.
Figures