0750
Dynamic Diffusion MRI Signal Changes Accompany Electrical Activity in Myelinated Axons1Mallinckrodt Institute of Radiology, Washington University School of Medicine, St. Louis, MO, United States, 2Hope Center for Neurological Disorders, Washington University School of Medicine, St. Louis, MO, United States
Synopsis
Because of its exceptionally robust nature, the ex vivo frog sciatic nerve has been the subject of numerous electrophysiology and MRI studies over the years. Here we report on diffusion MRI signal changes resulting from 50 and 100 Hz in-magnet electrical stimulation of perfused bullfrog sciatic nerves. The inexpensive perfusion system we have implemented allows for good long-term in-magnet stability and simultaneous MRI/electrophysiology studies. Decreases in water diffusivity and compound action potential conduction velocities accompany prolonged periods of repetitive electrical stimulation. Both of these changes are consistent with hypothesized microstructural alterations of the PNS myelin.
Introduction
Previously we demonstrated the utility of diffusion fMRI to assess function in the mouse optic nerve in vivo.1,2 In the current study, we developed and implemented a perfusion system that allows for electrical stimulation and compound action potential recording from ex vivo perfused frog sciatic nerves. This setup allows for well-defined stimulus intensity (in terms of the frequency of a supramaximal voltage stimulus) and recording of compound action potentials (CAP) and diffusion fMRI imaging data. Perfused nerves were fixed in-magnet in attempts to “lock in” microstructural alterations, which we hope will be detectable with electron microscopy (currently ongoing).Methods
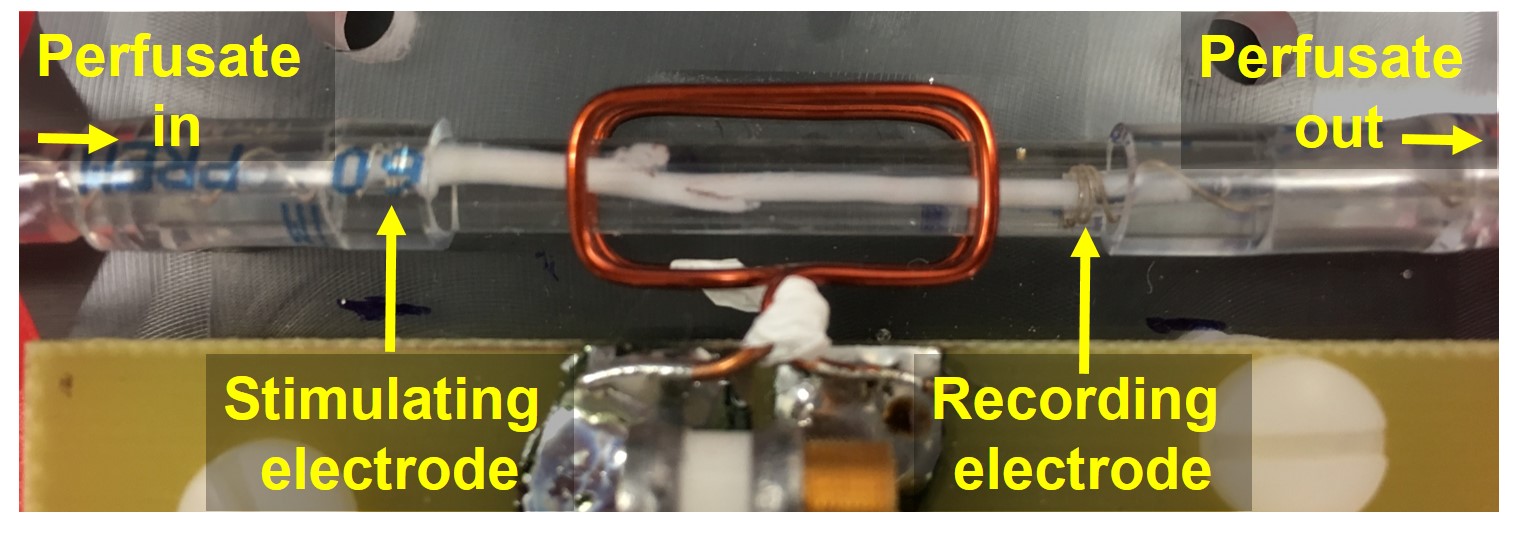
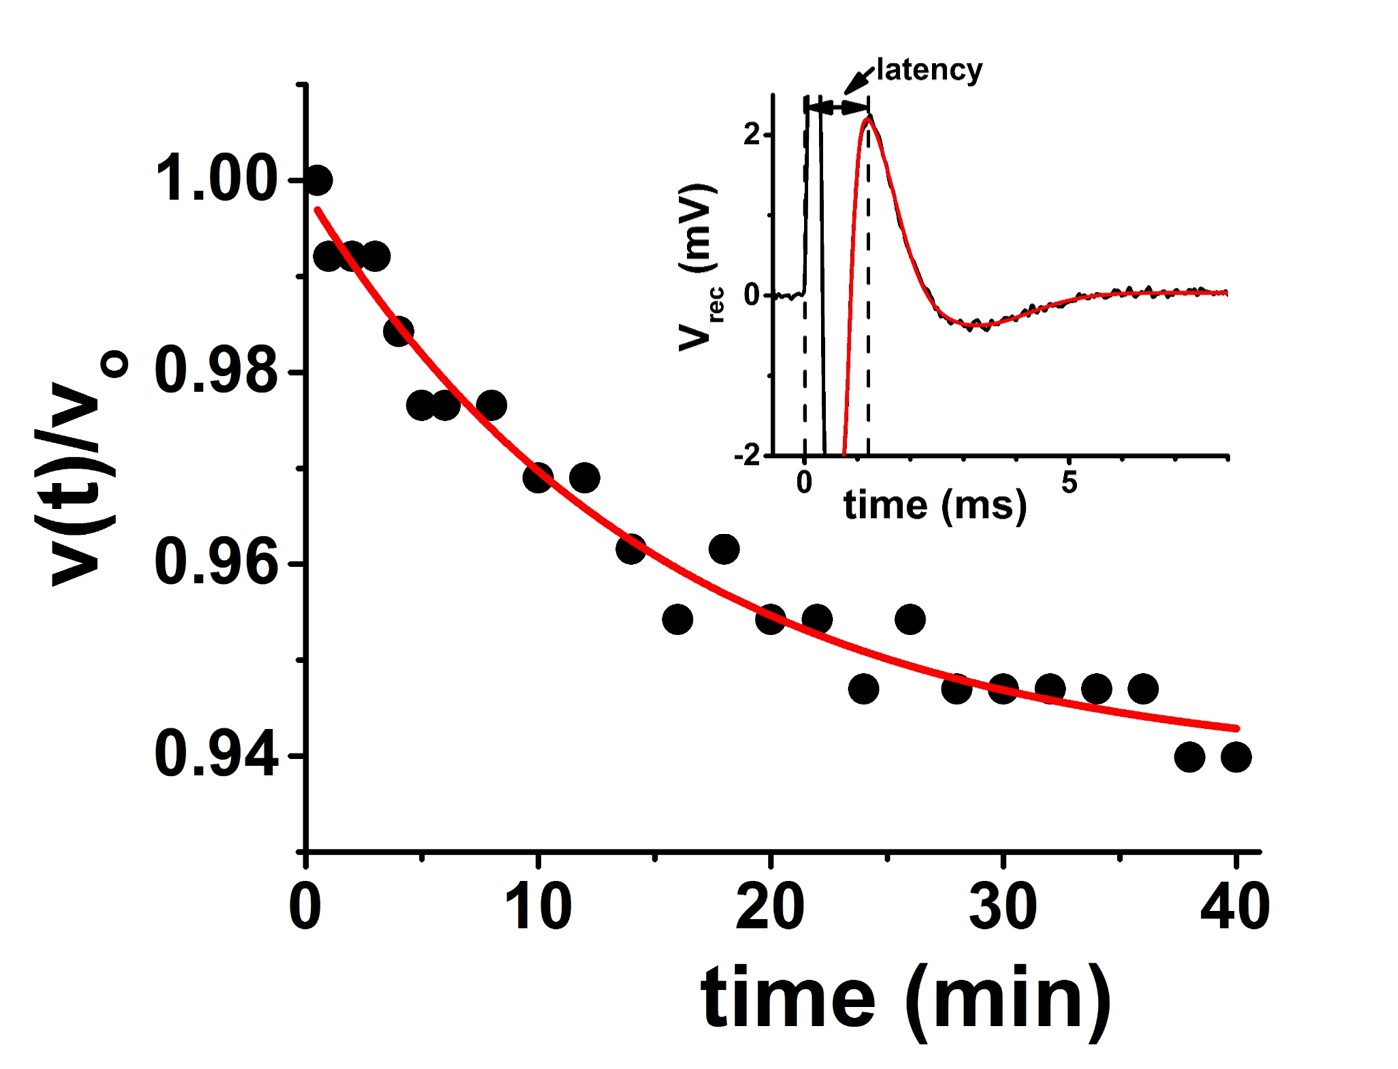
Freshly-harvested sciatic nerves from jumbo bullfrogs were used. Nerves were held in a perfusion flow cell fitted with retractable suction electrodes for in-magnet stimulation and recording (Figure 1). Electrical stimulation was delivered as 100 μs voltage pulses from an Agilent 33210A Pulse/Function Generator into an A-M System model 2200 Analog Stimulus Isolator. The recorded compound action potential was amplified (gain = 1000×) with a home-built amplifier and averaged with a Tektronix TBS1052B oscilloscope. Recorded CAP traces were transferred to a laptop computer for offline analysis (Figure 2). Oxygen-saturated frog Ringer’s solution flowing at a rate of 3 mL/hr is estimated to provide an ~ 20-fold excess of O2 above that required even during stimulation at 100Hz.3,4 Diffusion fMRI studies were carried out in a 4.7 T Agilent small-animal imaging system using home-built RF coils. Diffusion MRI data (25-direction, with maximum b value of 3.1 ms/μm2, δ = 5 ms, Δ = 18 ms) was acquired with a multi-echo spin-echo diffusion-weighted imaging sequence.5 To increase temporal resolution with the spin-echo-based imaging, data was acquired with a 32×32 matrix (7×7 mm2 fov). With TR = 1.5 s and 25 diffusion directions, this acquisition scheme results in 20-minute temporal resolution. A Hamming window was applied to the raw image data prior to zero-filling to 128×128 and denoising.6 The smaller matrix size resulted in an approximately 10% baseline offset (increase) in the ADC when compared to data acquired on a 64×64 matrix from the same nerves.Results
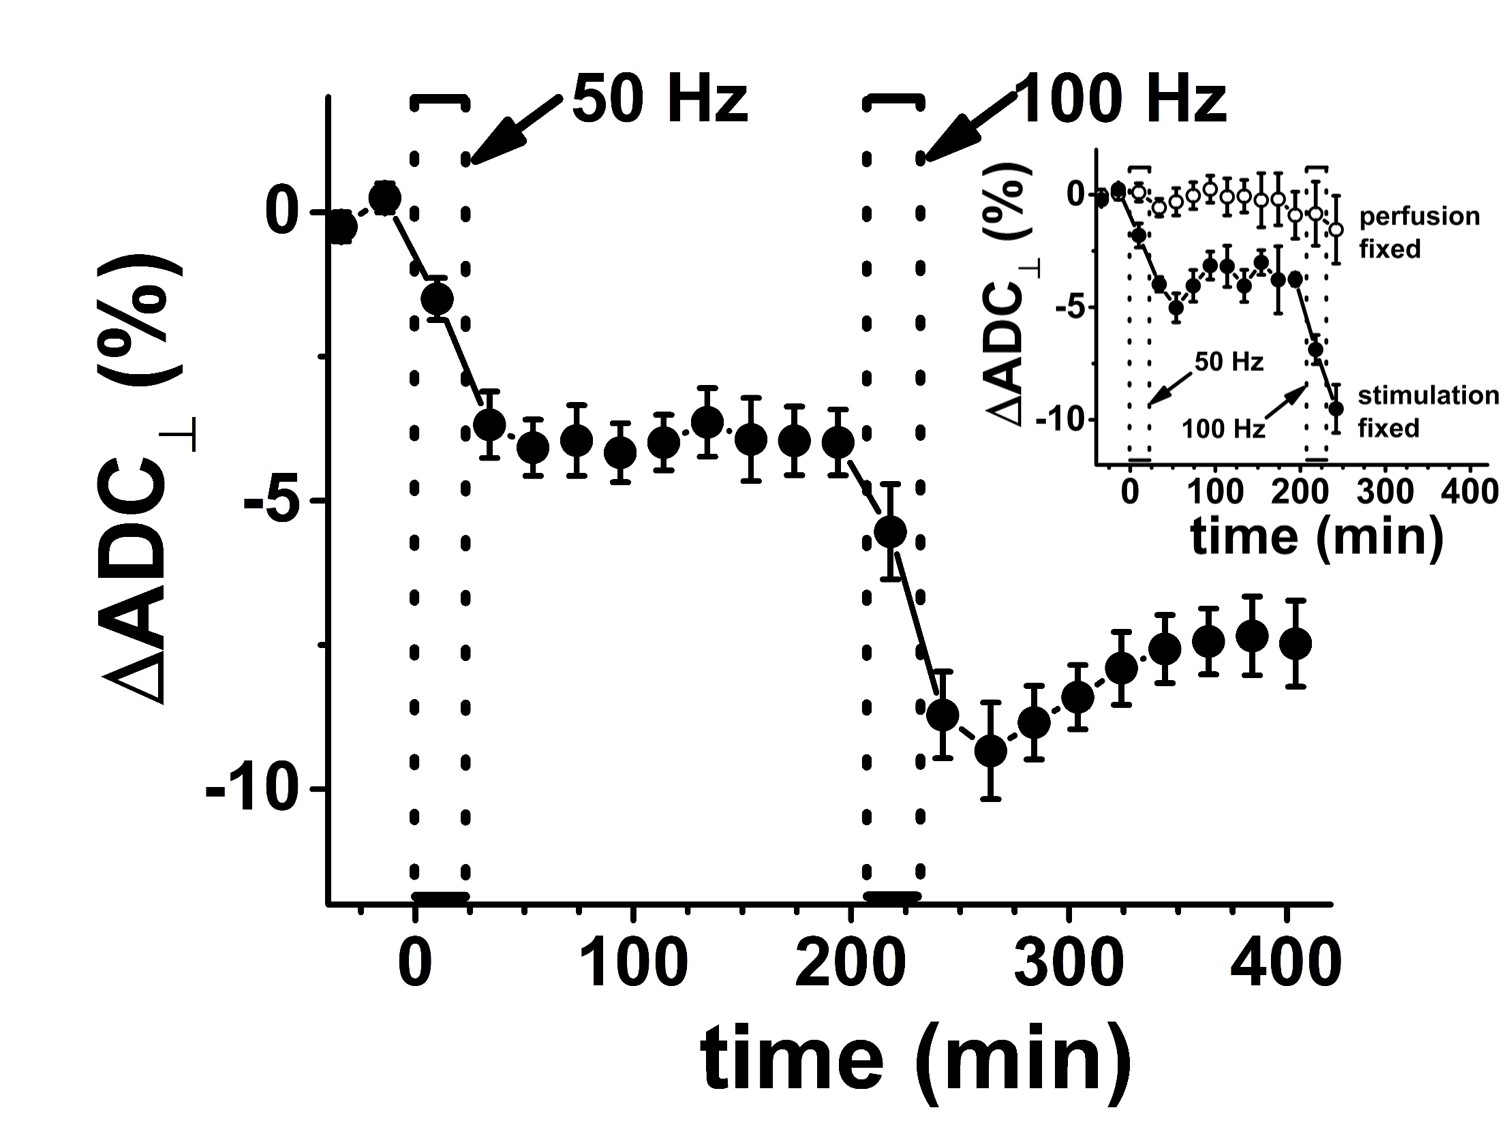
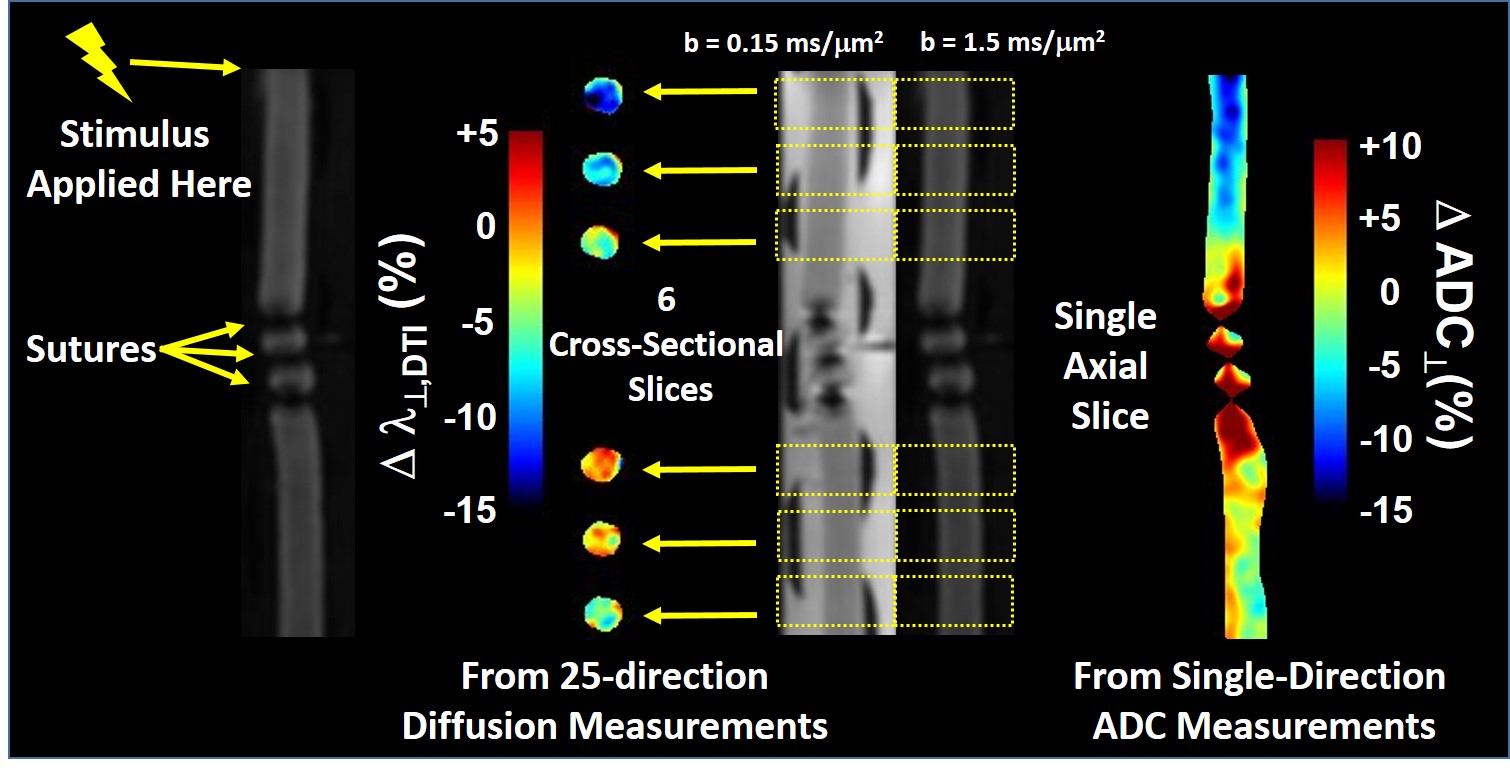
The CAP conduction velocity decreases across a period of repetitive electrical stimulation, as shown in the example (Figure 2). Accompanying the conduction velocity changes was a decreased ADCperp (the apparent diffusivity perpendicular to the axonal fibers). A 24-minute period of 50-Hz stimulus produced a 4% decrease in ADCperp (Figure 3). It is interesting that over the 3-hour period of observation post-stimulation, there is little tendency for the ADC to return to baseline levels. A subsequent 24-minute period of 100 Hz stimulation results in a further 5% decrease in ADCperp, after which there is some tendency to increase back to baseline levels (Figure 3). Stimulation at 100 Hz×40 min also results in a strong tendency to return to baseline ADC levels (data not shown), as if the PNS tissue exhibits an elastic response once tissue microstructure is altered significantly enough. A series of runs (Figure 3, inset) was also performed with immediate, in-magnet fixation. At the time of this writing, the tissue samples are being prepared for electron microscopy. In Figure 4, using sutures to tie off a perfused nerve, we demonstrate how the diffusion fMRI technique might be used to pinpoint a lesion site that results in CAP conduction blockage, even were the lesion not visible by other methods. In regions conducting repetitive electrical signals (upper portion) ADCperp decreases, while just distal to the conduction blockage this is not the case.Discussion
Taken alone, the diffusion MRI changes observed with repetitive electrical stimulation in the perfused frog sciatic nerve suggest an altered tissue microstructure. Indeed, three decades ago the production of (reversible) intramyelinic paranodal vacuoles with repetitive electrical stimulation was demonstrated in the in situ fixed frog sciatic nerve.7 This may be a general phenomenon, as exposure of potassium voltage gated channels (typically sequestered underneath the paranodal myelin) has been reported in repetitively-stimulated rat sciatic nerves.8 Our own in-magnet electrophysiology data demonstrates a decreasing propagation velocity for the compound action potential with repetitive electrical stimulation (cf. Figure 2). A swelling of the paranodal myelin, should it increase the exposed axonal membrane surface area at the nodes of Ranvier, would increase the axonal membrane capacitance (Cn) at the nodes. This, in turn, would be expected to increase the RC time-constant, τ, required to charge the nodal surface to the action-potential-firing threshold (τ = Ri·Cn; here Ri is the resistance to current flow through the intra-axonal cytoplasm).9 This provides a biophysical rationale for the observed decrease in CAP conduction velocity.Acknowledgements
Supported in part by NIH R01-NS047592, P01-NS059560, U01-EY025500 and NMSS RG 5258-A-5.References
1. WM Spees, TH Lin, SK Song, White-matter diffusion fMRI of mouse optic nerve. NeuroImage 2013; 65: 209-217.
2. TH Lin, WM Spees, CW Chiang, et al. Diffusion fMRI detects white-matter dysfunction in mice with acute optic neuritis. Neurobiology of Disease 2014; 67: 1-8.
3. F Brink, DW Bronk, FD Carlson, CM Connelly, The oxygen uptake of active axons. Cold Spring Harbor Symposia on Quantitative Biology 1952; 17: 53-67.
4. HL Clever, R Battino, H Miyamoto, et al. IUPAC-NIST solubility data series. 103. Oxygen and ozone in water, aqueous solutions, and organic liquids. J Phys Chem Ref Data 2014; 43: 033102.
5. TW Tu, MD Budde, M. Xie, et al. Phase-aligned multiple spin-echo averaging: A simple way to improve signal-to-noise ratio of in vivo mouse spinal cord diffusion tensor image. Magnetic Resonance Imaging 2014; 32; 1335-1343.
6. JP Haldar, VJ Wedeen, M Nezamzadeh, et al. Improved diffusion imaging through SNR-enhanced joint reconstruction. Magn Reson Med 2013; 69: 277-289.
7. CC Wurtz, MH Ellisman, Alterations in the ultrastructure of peripheral nodes of Ranvier associated with repetitive action potential propagation. J Neuroscience 1986; 6: 3133-3143.
8. O Morán, L Mateu, Loosening of paranodal myelin by repetitive propagation of action potentials. Nature 1983; 304: 344-345.
9. DK Hartline, DR Colman, Rapid conduction and the evolution of giant axons and myelinated fibers. Current Biology 2007; 17: R29-R35.
Figures