0744
Dependence of T2* Relaxation Time of Cardiac Cryo and RF Lesions on Time after Ablation: A New Approach to Non-contrast MRI of Cardiac Ablation Lesions1UCAIR, Department of Radiology and Imaging Science, University of Utah, Salt Lake City, UT, United States, 2CARMA Center, University of Utah, Salt Lake City, UT, United States
Synopsis
RF and Cryo ablations are being increasingly used for treatment of cardiac arrhythmias. LGE-MRI is widely used for characterization of RF and Cryo lesions. However, LGE-MRI requires contrast injection. Recently proposed native T1w techniques are only useful for visualization of acute (< 3 days) RF lesions. T2* relaxation time of RF and Cryo lesions significantly changes with time after ablation. T2* time of ablated myocardium is considerably lower that T2* time of normal myocardium after 1 week post-ablation. A native T2*-weighted MRI technique which can be used to visualize both RF and Cryo lesions has been developed and validated in animal studies.
Purpose
RF and Cryo-ablations are being increasingly used for treatment of cardiac arrhythmias. Late gadolinium enhancement (LGE) MRI can be used to evaluate RF and Cryo lesions. However, LGE-MRI requires contrast injection. Recently proposed non-contrast (native) T1-weighted (T1w) techniques are only useful for evaluation of acute (< 3 days) RF lesions. The main goals of this work were to study dependence of T2* relaxation time of RF and Cryo lesions on time after ablation and to demonstrate utility of native T2*w MRI to visualize the lesions.Methods
Ablations of left and right ventricles of canines (n=9, weight=23-37 kg) were performed according to IACUC approved protocols. Cryo lesions were created in 3 animals using Cryo catheter (Medtronic CryoCath) with freeze times of 2 and 4 minutes. RF lesions were created in 9 animals by RF catheter (ThermoCool, Biosense-Webster) at 30 Watts for 30 seconds. After the ablation procedure, each animal was moved to 3T scanner (Verio, Siemens Healthcare). Imaging protocol included T2* mapping, double inversion recovery (DIR) prepared T2w TSE, 3D T1w and 3D T2*w, followed by Gd-BOPTA injection (0.15 mmol/kg) and 3D LGE. Imaging studies were repeated for all animals at 1 and 4 weeks after ablation. The animals which underwent only RF ablation were also imaged 8 week after ablation.
The scan parameters were as follows. T2* Mapping – GRE sequence with TR/TE1-TE6=15.3/2.7-5.1-7.1-9.2-11.3-13.4 ms, flip angle (FA)=18o, resolution=1.44x1.44 mm, slice thickness=6 mm. T2w - respiratory navigated, DIR 2D TSE with TE=81 ms, TR=3 cardiac cycles, ETL=21, resolution=1.25x1.25 mm, slice thickness=4 mm. All 3D scans were acquired using respiratory navigated turbo-FLASH pulse sequence with resolution=1.25x1.25x2.5 mm. The other scan parameters for the 3D scans were as follows. Non-contrast T1w - saturation recovery (SR) preparation with TI=400 ms, TR/TE=3.1/1.4 ms, FA=12o. T2*w - SR preparation with TI=400 ms, TR/TE=7.5/5.0 ms, FA=12o, flow compensation. LGE - inversion recovery (IR) preparation with TI=230-330 ms, TR/TE=3.1/1.4 ms, FA=14o.
To calculate T2* value of ablated myocardium, ablation regions at T2* Mapping images were manually segmented using LGE images to detect lesion locations. T2* value for normal myocardium was estimated in regions distant to the ablation sites. T2w TSE images were used to exclude edematous areas from normal myocardium regions. Volume of ablation lesions was estimated from 3D T2*w and LGE images by manual segmentation.
Results
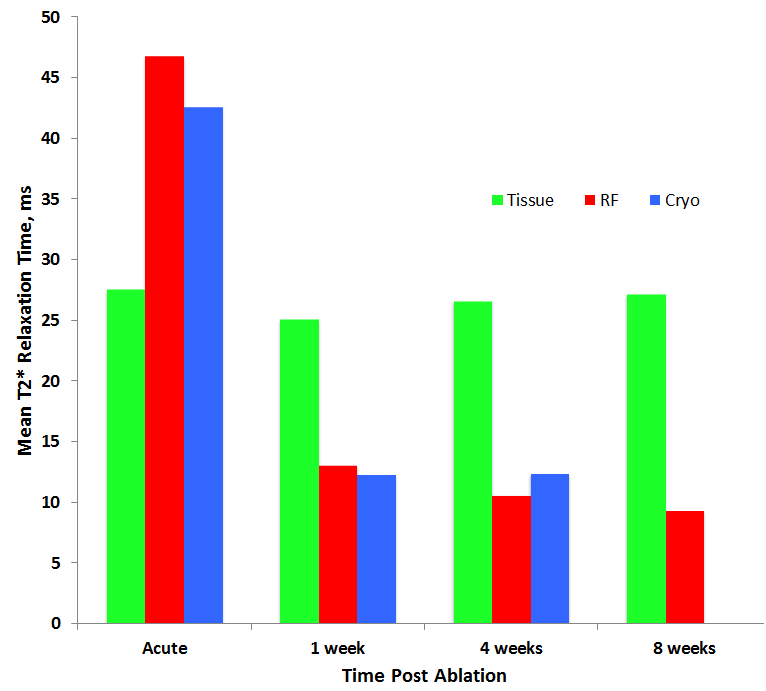
Dependence of T2* relaxation time of Cryo and RF lesions on time after ablation is shown on Figure 1. T2* time of Cryo and RF lesions (42.6+/-2.3 and 46.8+/-9.0 ms, correspondingly) was significantly (p<0.01) higher than T2* time for normal myocardium (27.6+/-3.9 ms) for acute studies. This observation may be explained by severe edema in the ablated regions. T2* time of Cryo and RF lesions was drastically reduced 1 week after ablation (12.3+/-3.7 and 13.1+/-2.7 ms, correspondingly). T2* of the Cryo and RF lesions was significantly (p < 0.01) lower that T2* of normal myocardium making T2* weighting useful for the lesion imaging.
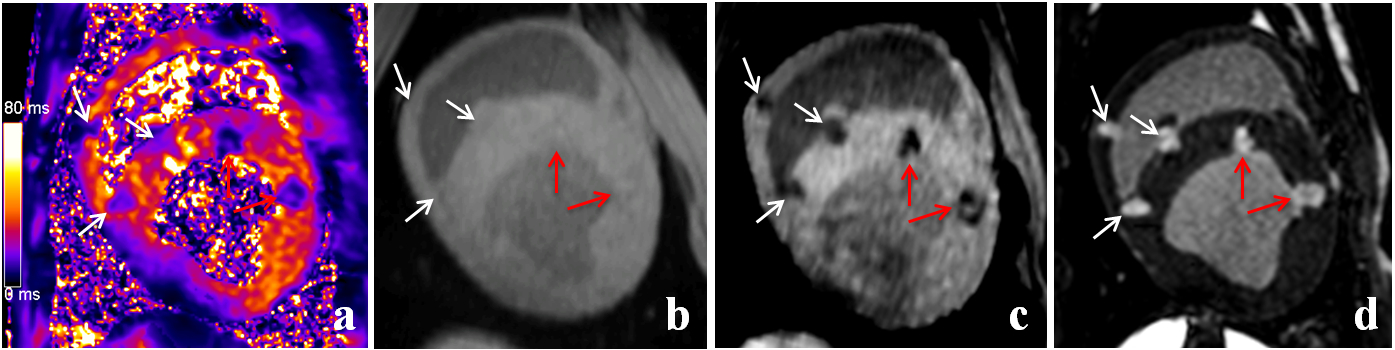
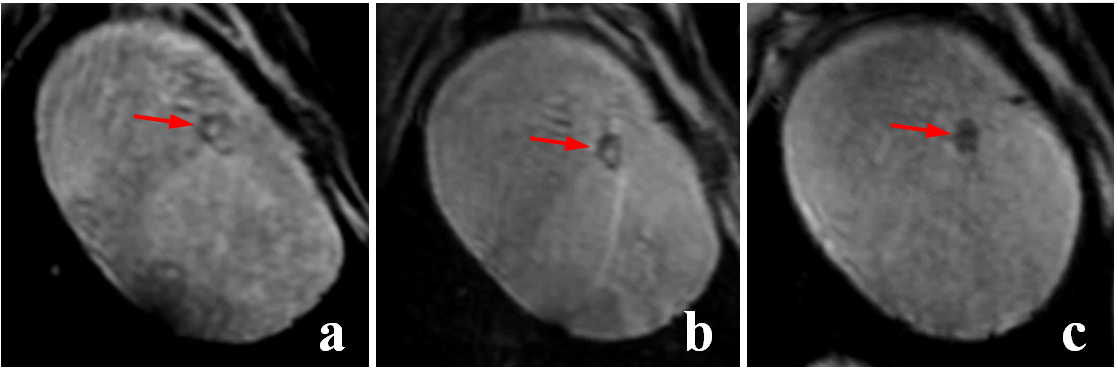
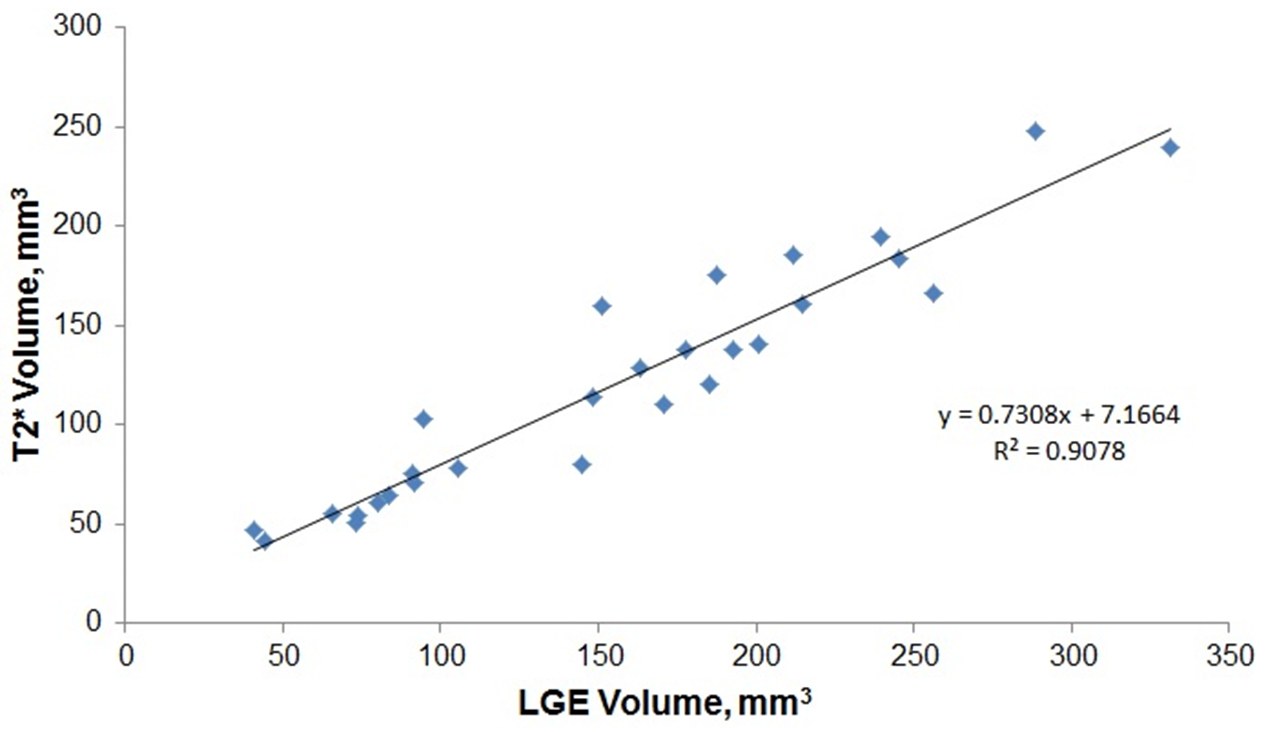
Representative T2* Mapping, T1w with TE=1.4 ms, T2*w (T1w with TE=5 ms), and LGE images of Cryo and RF lesions acquired 4 weeks after ablation are shown in Figure 2. The lesions are not observed on T1w images. Whereas, they are easily detectable in T2*w and LGE images. Visibility of the lesions in T2*w images improves with time after ablation (Fig. 3). RF Lesions have hypo-intense boundaries in T2* images acquired 1 and 4 weeks post-ablation. Whole RF lesions are hypo-intense in T2*w images acquired 8 weeks post-ablation. Strong correlation between lesions volumes estimated from LGE and T2*w acquired 8 weeks after ablation was found (Fig. 4).
Discussion and Conclusion
Change in T2* relaxation time of ablated myocardium may be explained by the following sequence of events. RF and Cryo ablations rupture and obstruct vessels at ablation sites. With time after ablation, hemoglobin at ablated myocardium starts undergoing transformation into paramagnetic hemosiderin. T2* time of ablated myocardium reduces with increase in hemosiderin concentration. MRI techniques exploiting the difference in T2* time between normal and ablated myocardium can be used to assess both Cryo and RF ablation lesions without contrast application.
T2* relaxation time of RF/Cryo ablated myocardium drastically changes with time after ablation. T2* time of ablated myocardium is considerably lower that T2* of normal myocardium after 1 week post-ablation. Utility of native T2*w technique for visualization of Cryo and RF ablations has been demonstrated in animal studies. The technique can be used to image both Cryo and RF lesions as early as a week after ablation. Visibility of the lesions in T2*w images improves with time after ablation as T2*w time of the lesions becomes shorter.
Acknowledgements
This study was supported in part by Biosense-Webster, Medtronic, and Marrek Inc.References
No reference found.Figures