0740
Tissue and device visualization using parallel transmission for interventional MRI1Imaging and Biomedical Engineering, King's College London, London, United Kingdom, 2Electrical Engineering, Stanford University, United States, 3Translational and Molecular Imaging Institute, The Icahn School of Medicine at Mount Sinai, New York, NY, United States
Synopsis
It is demonstrated that parallel transmit (PTx) can be used to both safely visualise tissue (no heating even from high SAR sequences), and safely visualise a wire by direct coupling using low power MR sequences. A low power version of a TSE sequence was found to give the best depiction of the wire when using this method.
Introduction
Cardiac catheterization procedures usually require x-rays for visualization of both the guidewire-catheter system and surrounding anatomical structures. Use of MRI for guidance leads to both improved soft tissue contrast and elimination of radiation dose 1. However the transmit field (B1+) of the MRI can induce currents on interventional devices which can lead to dangerous focal tissue heating 2–4. Etezadi-Amoli et al demonstrated that PTx can be used to reduce the potential RF coupling risks 5 by identifying strongly coupling modes (CM) and decoupled modes (DM) of the transmit system and the interventional device. DMs produce no wire current and can therefore be harnessed for safe imaging.
CMs produce wire currents and are typically discarded, yet they produce a magnetic field whose magnitude is inversely proportional to the radial distance from the wire. Consequently, even small wire currents can produce significant RF magnetic field adjacent to it. We previously introduced the use of this mechanism to enable guidewire visualisation via very low-power sequences that result in measurable signals only from the wire6. In this work we investigate the suitability of different pulse sequences and check for temperature effects.
Methods
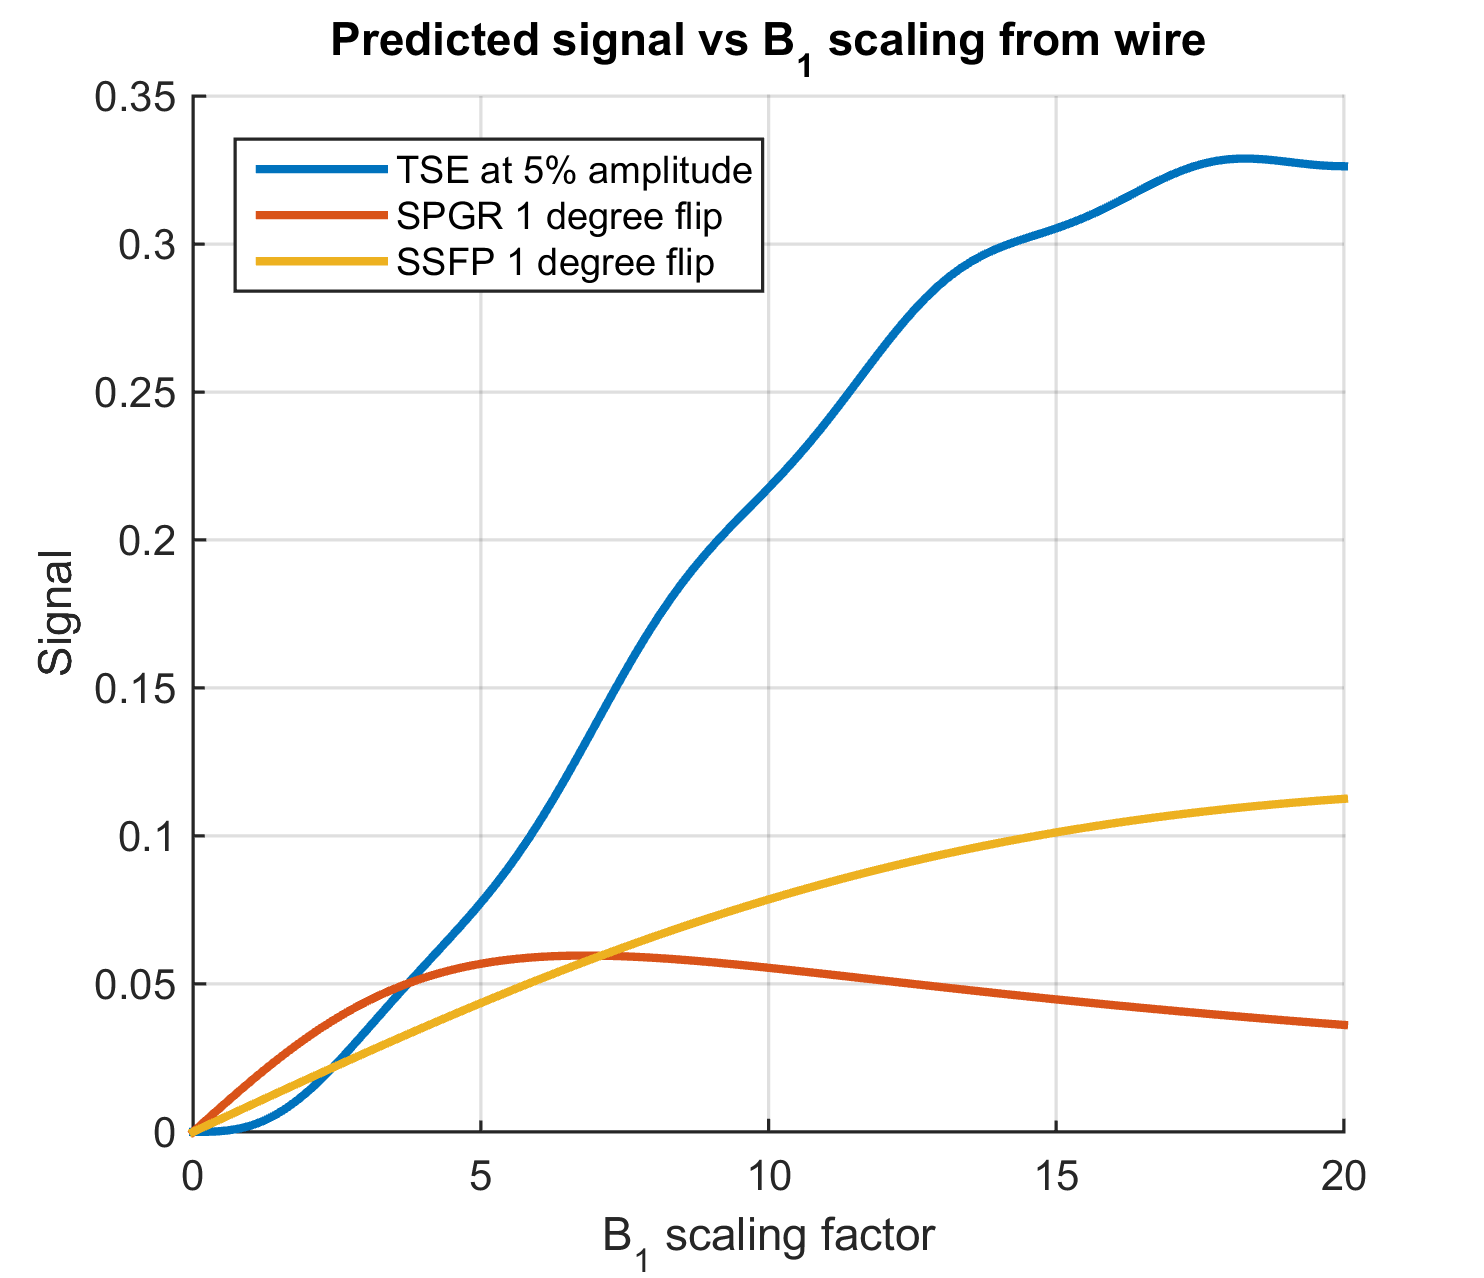
Candidate sequences must allow for rapid imaging with low RF power (to avoid heating when used with CM). Hence spoiled gradient echo (SPGR) with FA=1° and balanced steady-state free precession (bSSFP) with FA=1° were selected. A variant of Turbo Spin Echo (TSE) in which all RF pulses were scaled down to 5% of their nominal value (i.e. excitation angle 4.5°, refocusing angle 9°) was also included since it was hypothesized that non-linear behaviour of signal in TSE could enhance wire visibility. Expected signals were simulated for T1=1s, T2=50ms using well established signal relationships for SSFP/bSPGR and EPG calculation7 for the TSE.
Measurements were performed on a 3T Philips Achieva with an 8-channel TEM body coil 8 for transmit and a two-element surface loop-coil for receive. A half-pipe phantom was filled with poly acrylic acid gel 9 into which a nitinol guidewire (Terumo Corporation, Japan) was placed. The last 4mm of the wire’s polyurethane coating were stripped off and the wire was shaped to contain a small loop (dia ~5cm). An optically coupled toroidal current sensor10 placed over the proximal end of the guidewire was used to measure coupling. A single coupled mode and 7 decoupled modes were identified via SVD on current sensor readings 5. Temperature at the end of the wire was monitored using a fibre-optic temperature probe (LumaSense Technologies, Inc. USA).
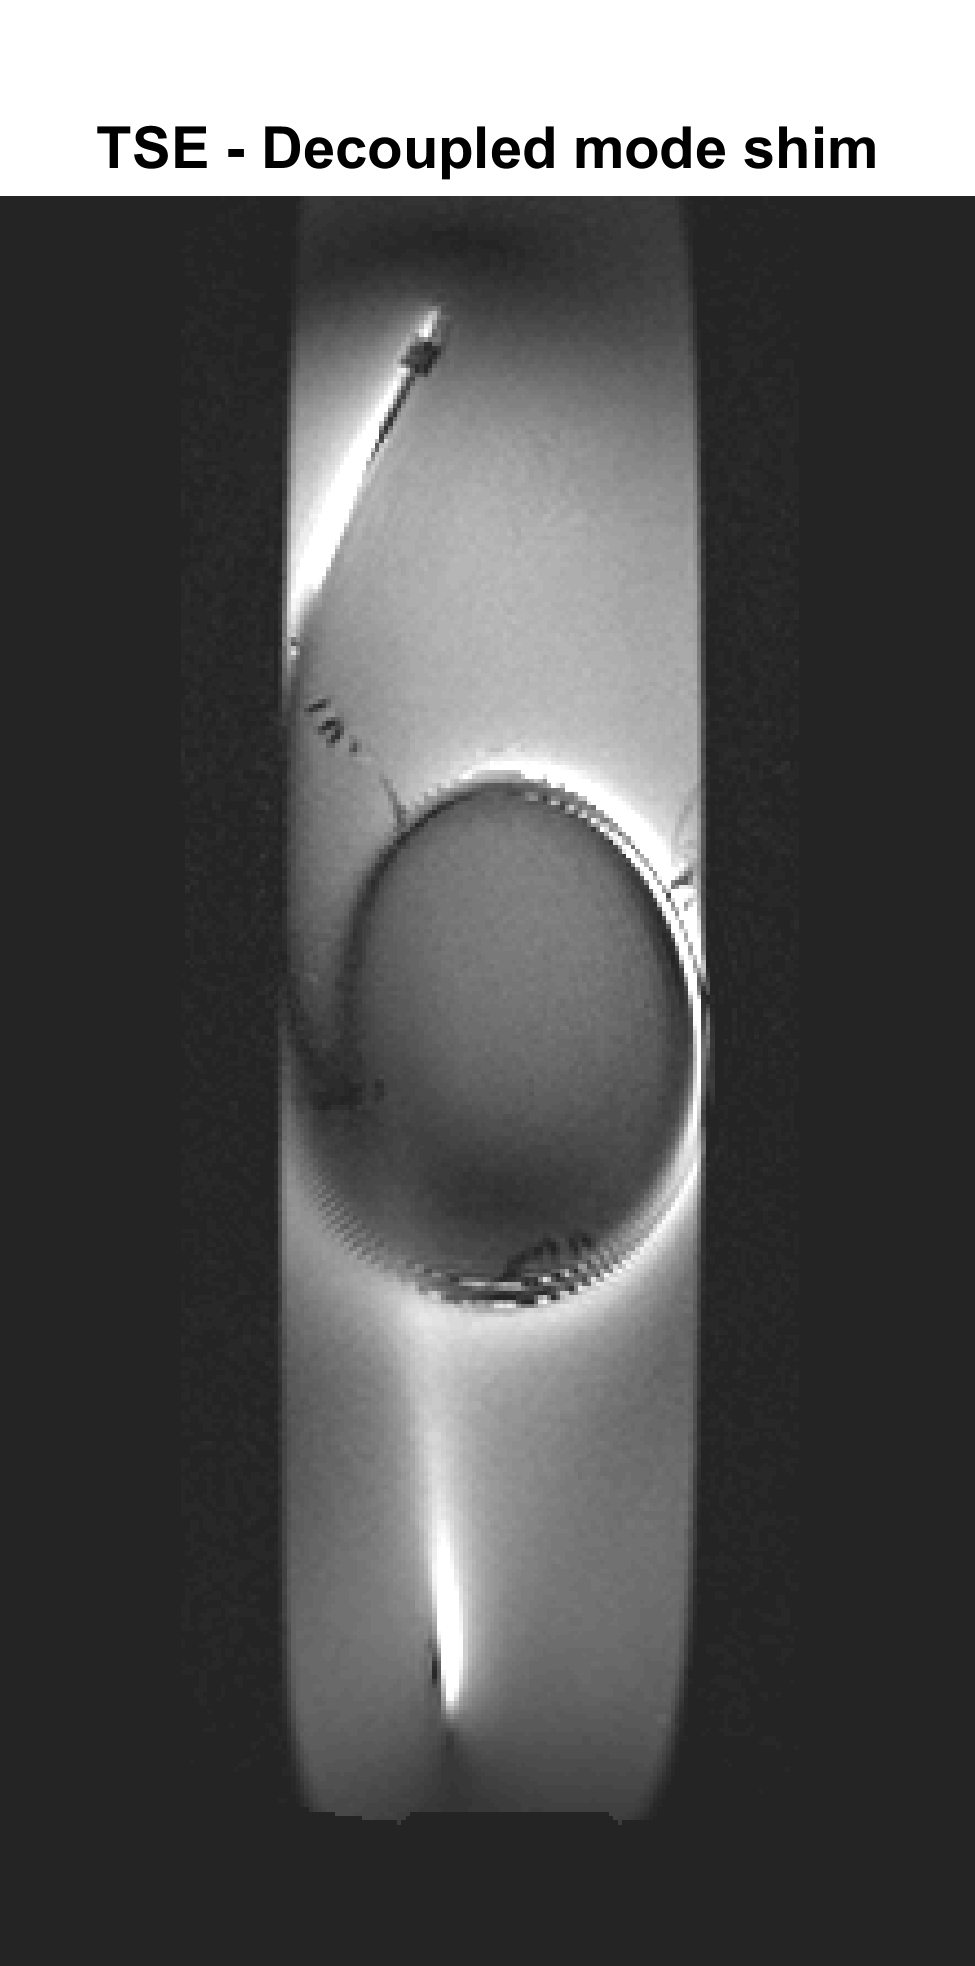
Magnitude-least-squares RF shimming 11 was used to identify a weighted combination of DM with reasonably uniform B1+, but no risk of heating. The shimming calculation used B1+ maps acquired with AFI12 in combination with low flip angle SPGR scans. The identified DM shim was used in conjunction with a multishot TSE imaging sequence (10 slices, 16 echoes, TE=60ms, TR=600ms, resolution=1x1x2mm3, reported SAR=100%, duration=3m48s) for ‘tissue’ visualisation.
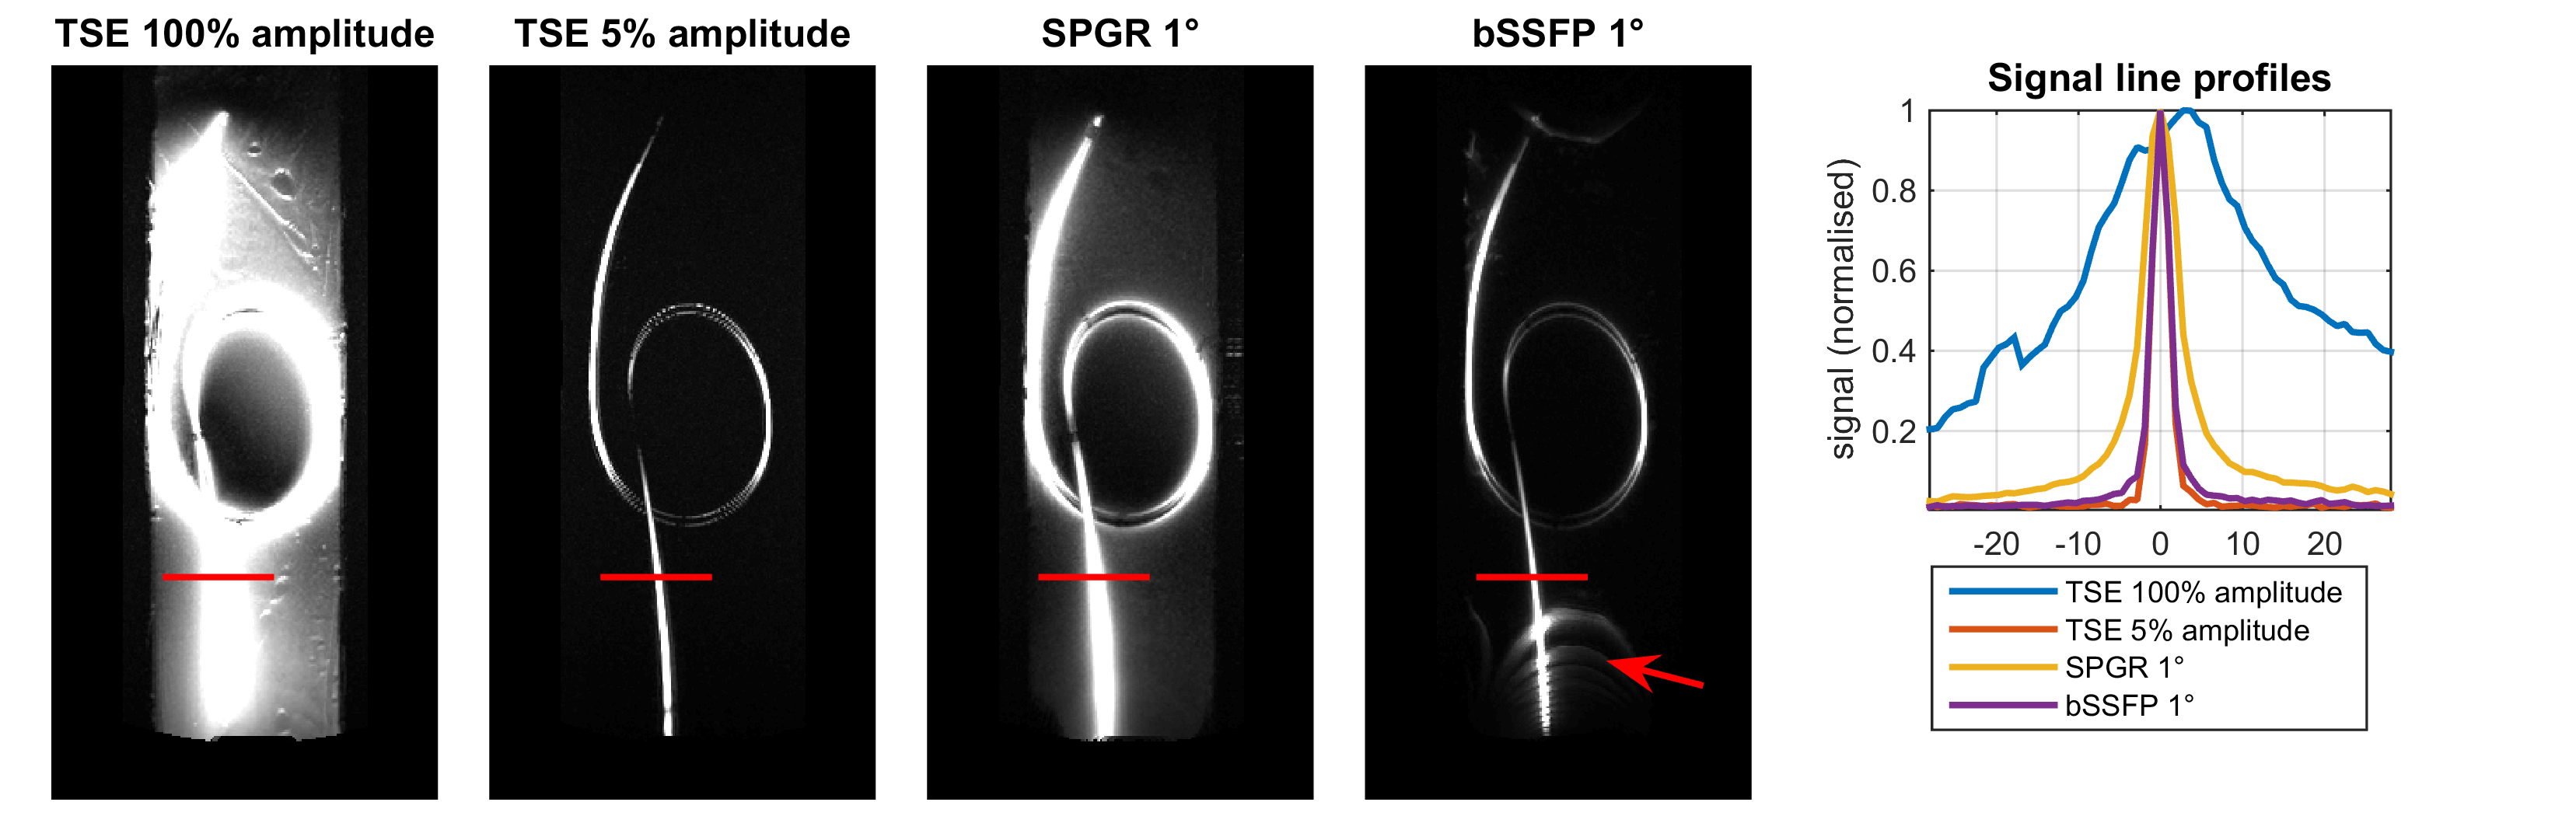
Device visualisation was attempted with the coupled mode using the candidate sequences listed previously. All scans had the same spatial resolution and field of view.
Results
Figure 1 plots the simulated signals from the visualisation sequences as a function of local B1+ enhancement factor; it is expected that using the CM results in B1+ scaling factor <1 far from the wire and large (~10) very close to it (actual values are variable).
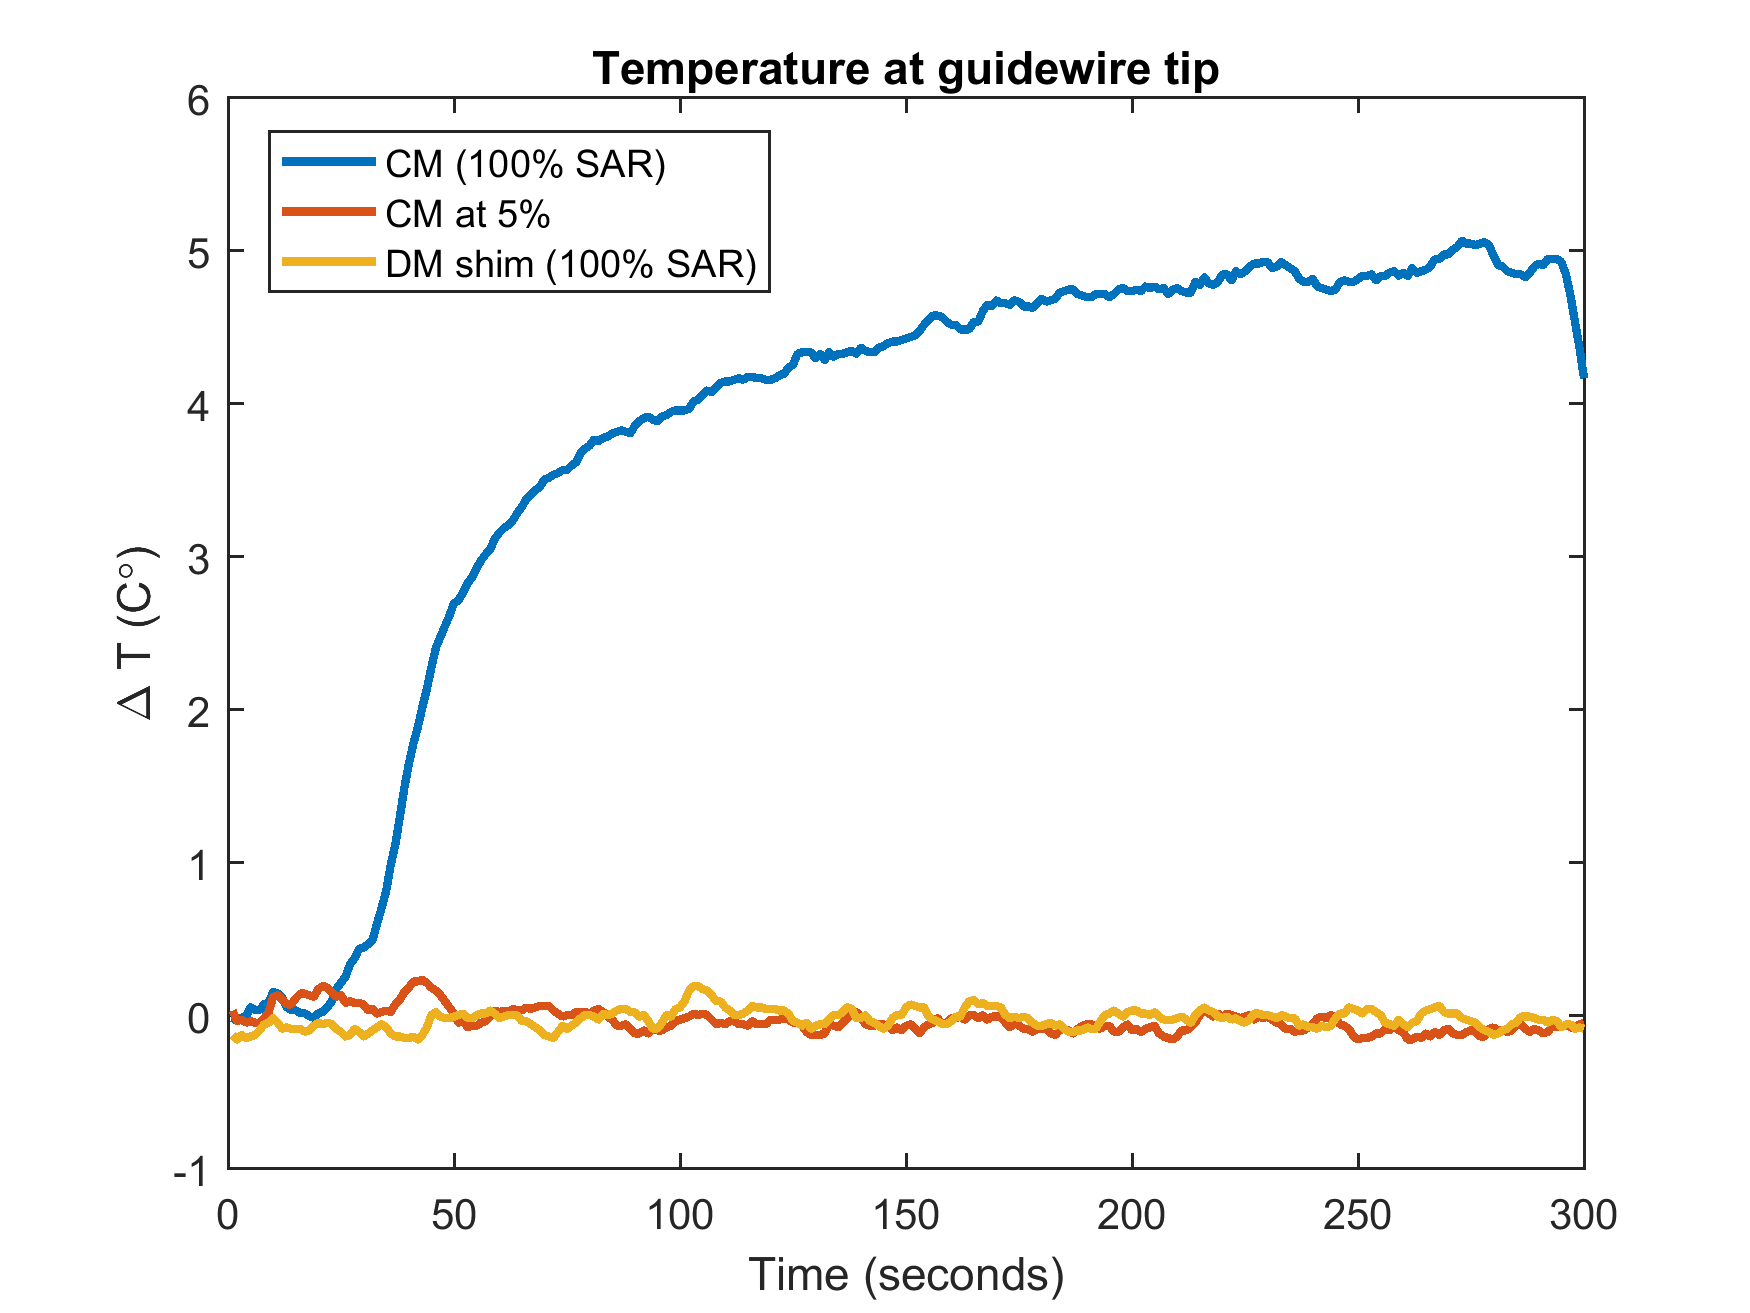
The ‘tissue’ visualisation image is shown in Figure 2 –some residual enhancement of the wire remains from receiver coupling but the background gel can clearly be visualised. Figure 3 shows maximum-intensity-projections (MIPs) of the images acquired using the coupling mode, along with a signal line profile through a region containing the wire. Measured temperatures when using the TSE sequences are shown in Figure 4.
Discussion
Visualization of background tissue can be achieved using DM with no recorded heating at the wire tip, even when running at 100% (reported) SAR. Significant heating results if the CM is used in this configuration. However if the amplitude of the TSE is scaled down to 5% (0.25% power) the CM can be safely used with TSE. Simulation predicts that SPGR will saturate for high B1 scaling factors, hence giving limited wire-to-background contrast. The images (Figure 3) support this prediction. bSSFP performs better but suffers from off-resonance artefacts (‘bright’ bands). Low power TSE is predicted to have strongest contrast between the wire and background since signals for low scaling factors are strongly suppressed. Imaging confirms this, suggesting this type of sequence can offer an inherently safe means for visualisation of conductors via induced currents.Acknowledgements
Funding for this project is provided by the Medical Research Counsel developmental pathway funding.References
1. Nazarian S, Kolandaivelu A, Zviman MM, et al. Feasibility of real-time magnetic resonance imaging for catheter guidance in electrophysiology studies. Circulation. 2008;118(3):223-229. doi:10.1161/CIRCULATIONAHA.107.742452.
2. Nitz WR, Oppelt A, Renz W, Manke C, Lenhart M, Link J. On the heating of linear conductive structures as guide wires and catheters in interventional MRI. J Magn Reson Imaging. 2001;13(1):105-114. doi:10.1002/1522-2586(200101)13:1<105::AID-JMRI1016>3.0.CO;2-0.
3. Park SM, Kamondetdacha R, Nyenhuis JA. Calculation of MRI-induced heating of an implanted medical lead wire with an electric field transfer function. J Magn Reson Imaging. 2007;26(5):1278-1285. doi:10.1002/jmri.21159.
4. Griffin GH, Anderson KJT, Celik H, Wright GA. Safely assessing radiofrequency heating potential of conductive devices using image-based current measurements. Magn Reson Med. 2015;73(1):427-441. doi:10.1002/mrm.25103.
5. Etezadi-Amoli M, Stang P, Kerr A, Pauly J, Scott G. Controlling radiofrequency-induced currents in guidewires using parallel transmit. Magn Reson Med. 2015;74(6):1790-1802. doi:10.1002/mrm.25543.
6. Padormo F, Beqiri A, Hajnal J V, Malik S. Interventional device visualisation using the coupling mode of a PTx transmit array. In: Proc. Intl. Soc. Mag. Reson. Med. ; 2016:23-25. doi:10.1002/mrm.25543.3.
7. Hennig J. Multiecho imaging sequences with low refocusing flip angles. J Magn Reson. 1988;78(3):397-407. doi:10.1016/0022-2364(88)90128-X.
8. Vernickel P, Röschmann P, Findeklee C, et al. Eight-channel transmit/receive body MRI coil at 3T. Magn Reson Med. 2007;58(2):381-389. doi:10.1002/mrm.21294.
9. ASTM standard F 2182-2002a. Standard test method for measurement of radio frequency induced heating near passive implants during magnetic resonance imaging. ASTM Int. 2002;(December):1-14. doi:10.1520/F2182-11A.1.7.
10. Etezadi-Amoli M, Stang P, Kerr A, Pauly J, Scott G. Interventional device visualization with toroidal transceiver and optically coupled current sensor for radiofrequency safety monitoring. Magn Reson Med. 2015;73(3):1315-1327. doi:10.1002/mrm.25187.
11. Setsompop K, Wald LL, Alagappan V, Gagoski BA, Adalsteinsson E. Magnitude least squares optimization for parallel radio frequency excitation design demonstrated at 7 tesla with eight channels. Magn Reson Med. 2008;59(4):908-915. doi:10.1002/mrm.21513.
12. Yarnykh VL. Actual flip-angle imaging in the pulsed steady state: A method for rapid three-dimensional mapping of the transmitted radiofrequency field. Magn Reson Med. 2007;57(1):192-200. doi:10.1002/mrm.21120.
Figures