0729
In Vivo Visualization of Orbital Immune Cell Infiltration During Early Development of Graves’ Disease by 19F MRI1Experimental Cardiovascular Imaging, Heinrich Heine University, Düsseldorf, Germany, 2Ophthalmic Clinic, University Hospital Essen, 3Molecular Ophthalmology, University Hospital Essen
Synopsis
Graves’ disease is an antibody-mediated autoimmune condition of the thyroid gland, which is frequently associated with Graves’ orbitopathy (GO), where inflammation of the orbit results in a detrimental remodeling of the orbital soft tissue. To investigate the molecular basis of GO and evaluate new therapeutic targets for treatment, we used a recently established mouse model of GO and analyzed the interplay of inflammation and adipogenesis using anatomical 1H MRI and 19F MRI for immune cell tracking. Hereby, the infiltration of immune cells could be identified as initial step leading to the remodeling of the orbital soft tissue in GO mice.
Introduction
Graves’ disease is an antibody-mediated autoimmune condition of the thyroid gland, where the primary pathogenic antigen is the TSHR-receptor (TSHR). A frequent complication is Graves’ orbitopathy (GO), also known as thyroid eye disease, where inflammation of the orbital muscle/connective tissue together with increased adipogenesis and deposition of hyaluronan results in a detrimental remodeling of the orbital soft tissue[1,2]. Until now there is no anti-inflammatory treatment available, which can prevent persisting defects[3]. Unfortunately, there is limited knowledge which factors influence the variable course of GO and preclinical studies of the pathophysiology of this disease have been difficult due to the absence of an experimental model.
We have recently established a mouse model of GO and lately shown its robustness and reproducibility in different environments[4,5]. The present study aimed at characterizing the disease progression in this model non-invasively by MRI to longitudinally investigate the molecular basis of GO and evaluate new therapeutic targets for treatment. In a first step, we analyzed the interplay of inflammation and adipogenesis in the early phase of the disease using anatomical 1H MRI and 19F MRI for immune cell tracking[6].
Methods
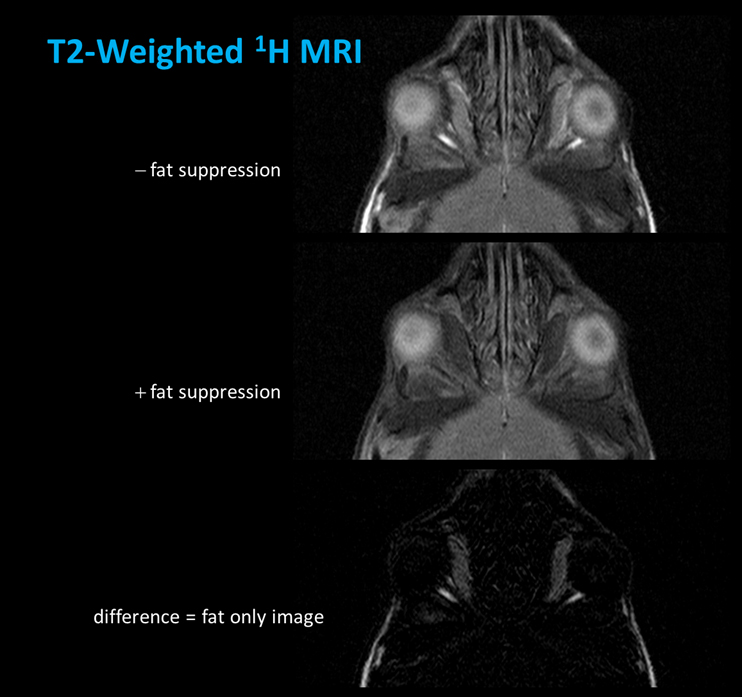
Induction of GO in mice was carried out by in vivo gene delivery by electroporation of eucaryotic plasmid expressing hTSHR A-subunit in four immunisation steps[4,5]. This resulted in production of anti-TSHR autoantibodies and manifestation of clinical signs of GO. The characteristics of the GO model include a heterogeneous phenotype similar to human patients, recapitulating orbital inflammation, adipogenesis and proptosis of the eyeball[4,5]. For in vivo monitoring of disease progression, mice were analyzed at 9.4T using a 25-mm birdcage resonator tuneable to both 1H and 19F. For visualization of inflammatory processes by 19F MRI[6], mice received an intravenous bolus injection of a 10% emulsion of perfluoro-15-crown-5 ether (PFC; 3 mM/kg BW) 48 h prior MRI to ensure appropiate PFC-loading of circulating immune cells. Orbital adipogenesis was quantified from T2-weighted TSE images with and without fat suppression. With the same receiver gain, 2 image sets were recorded with and without chemical shift selective fat suppression. To produce fat-only images, fat-suppressed data were substracted in absolute intensity mode from non-suppressed datasets by using an in-house-developed software module.Results and Discussion
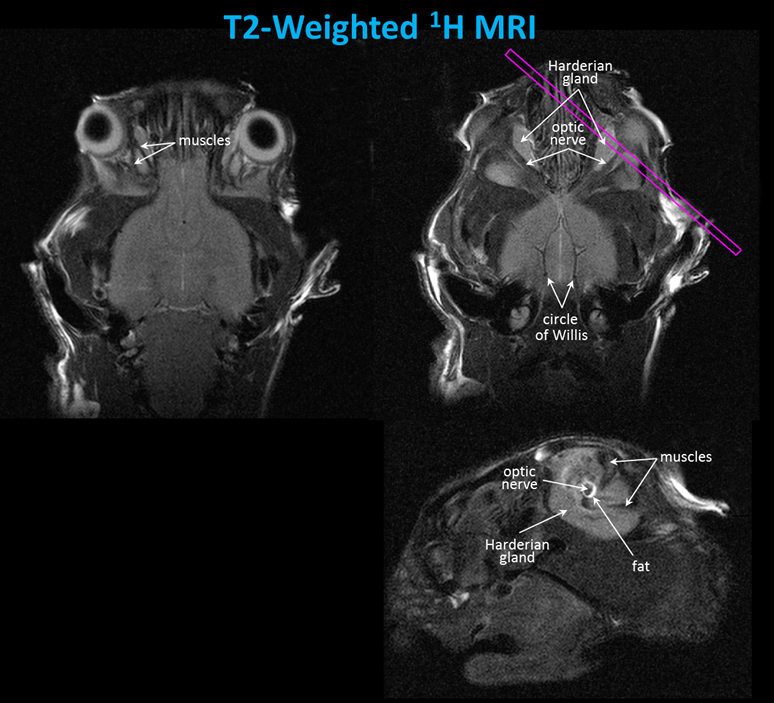
In T2-weighted 1H MRI scans acquired with an in-plane resolution of 50x50 µm2 (500 µm slice thickness, 16 slices to cover the entire orbital region), the anatomy of the murine orbit could be visualized in great detail. Figure 1 shows that the dimensions of the optic nerve and its surrounding fat tissue as well as muscle and Harderian gland can be easily quantified from these images. For an unequivocal identification of fat tissue, images with and without fat suppression were acquired and the total amount of fat was quantified from fat-only images (Figure 2).
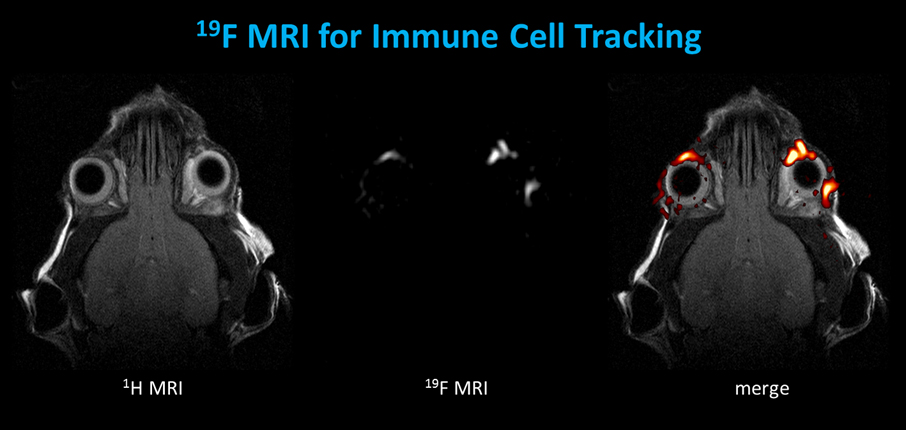
In order to track in parallel the in vivo progression of orbital inflammation, we used perfluorocarbon nanoemulsions (PFCs) which are avidly taken up by circulating monocytes/macrophages[7]. After immigration into inflamed tissue, the fate of PFC-loaded immune cells is readily detected with 19F MRI. Figure 3 displays anatomically corresponding 1H and 19F images from the mouse head 4 weeks after the last immunisation step showing a substantial accumulation of 19F signal around both eyeballs (red/yellow in the merged images). Interestingly, at this early point in time only moderate differences in adipose tissue content were observed between GO and control mice (1.71±0.11 vs 1.54±0.14 µl, n=6 vs 3), while the quantification of 19F signals indicated already a major infiltration of PFC-loaded immune cells into the orbit of immunised mice (13.3±6.7 vs 1.6±0.5 arbitrary units, n=6 vs 3). The large standard deviation clearly reflects the heterogeneous phenotype in this disease model very similar to GO patients.
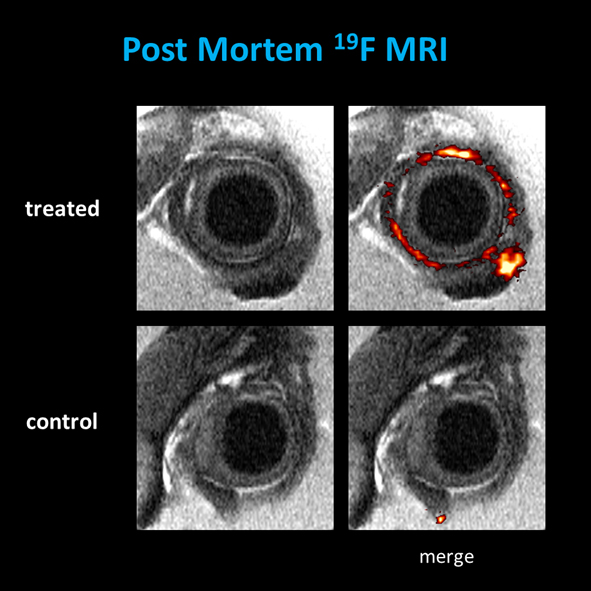
The strategy of loading inflammatory cells with PFCs was finally corrobated by examination of postmortem tissue after fixation and 3D high resolution analysis of the excised orbital tissue – thus, 1H/19F MRI at an isotropic voxel size of 40 µm confirmed the predominant PFC deposition in the periorbital tissue of GO compared to control mice (Figure 4).
Conclusions
Using 1H/19F MRI, an early infiltration of immune cells could be clearly visualized in the GO mouse model and identified as initial step leading to the detrimental remodeling of the orbital soft tissue in these mice. For future studies, we propose to evaluate advanced state of disease progression in the orbital region by applying CEST techniques for monitoring the time course of hyaluronan deposition. Furthermore, T1 and T2 mapping will provide valuable information about development of fibrosis and oedema for further insight into the molecular pathophysiology of GO.Acknowledgements
This work was supported by the Deutsche Forschungsgemeinschaft (DFG), subprojects B2+B5 of the Sonderforschungsbereich 1116.References
[1] Bahn RS. Graves’ ophthalmopathy. New England J Med 2010; 362: 726-738.
[2] Shan SJS and Douglas RS. The pathophysiology of thyroid eye disease. J Neuro-ophthalmol 2014; 34:177-185.
[3] Salvi M. Immunotherapy for Graves’ ophthalmopathy. Curr Opin Endocrinol Diabetes Obesity 2014; 21: 409-414.
[4] Moshkelgosha S, So PW, Deasy N Diaz-Cano S, Banga JP. Cutting Edge: Retrobulbar inflammation, adipogenesis and acute orbital congestion in a preclinical female mouse model of Graves’ orbitopathy induced by thyrotropin receptor plasmid in-vivo electroporation. Endocrinol 2013; 154: 3008-3015.
[5] Berchner-Pfannschmidt U, Moshkelgosha S, Diaz-Cano S, Edelmann B, Görtz GE, Horstmann M, Noble A, Hansen W, Eckstein A, Banga JP. Comparative assessment of female mouse model of Graves' orbitopathy under different environments, accompanied by pro-inflammatory cytokine and T cell responses to thyrotropin hormone receptor antigen. Endocrinol 2016; 157:1673-82.
[6] Flögel U, Ding Z, Hardung H, Jander S, Reichmann G, Jacoby C, Schubert R, Schrader J. In vivo monitoring of inflammation after cardiac and cerebral ischemia by fluorine magnetic resonance imaging. Circulation. 2008; 118:140-8.
[7] Temme S, Bönner F, Schrader J, Flögel U. 19F magnetic resonance imaging of endogenous macrophages in inflammation. Wiley Interdiscip Rev Nanomed Nanobiotechnol. 2012; 4:329-43.
Figures