0724
High Resolution Diffusion Imaging of the Human Hippocampus1University of Alberta, Edmonton, Canada
Synopsis
Diffusion imaging of the human hippocampus is typically limited to low spatial resolution due to challenges with low signal-to-noise ratio. Here we demonstrate error in fractional anisotropy/mean diffusivity in high resolution diffusion imaging acquired with multiple gradient directions and 1 average, which is mitigated by acquiring fewer directions and multiple signal averages. Using this approach, 1x1x1 mm3 diffusion data at 3T is shown to produce mean diffusion weighted images with excellent contrast within the hippocampus, acquired in a clinically feasible scan time of 6 minutes. High resolution diffusion imaging will impact the study of numerous disorders affecting the hippocampus.
Purpose
In-vivo diffusion MRI of the human hippocampus has shown changes in aging1,2, dementia3,4, etc. albeit at low spatial resolution (e.g. 2-2.5 mm isotropic2,4,5 or 3-4 mm thick slices1,3), limiting the ability to visualize and accurately measure diffusion parameters in subfields which may be independently affected in neurological conditions (e.g. epilepsy6). However, reducing voxel size lowers signal-to-noise ratio (SNR), which can bias tensor calculation. Indeed, data is presented here demonstrating that at ultra-high spatial resolution, high angular resolution single average acquisition yields low SNR images with erroneous tensor parameters (fractional anisotropy, FA; mean diffusivity, MD); however, this bias is mitigated by acquiring multiple averages over fewer directions. Accordingly, we demonstrate an acquisition strategy that yields high quality 1 mm isotropic resolution diffusion images of the human hippocampus within a clinically feasible scan time of ~6 minutes at 3T.Methods
Isotropic diffusion images of various resolutions (0.8x0.8x0.8 =0.5 mm3; 0.9x0.9x0.9 =0.73 mm3; 1.0x1.0x1.0=1.0 mm3; 1.1x1.1x1.1=1.3 mm3; 1.2x1.2x1.2=1.7 mm3; 1.3x1.3x1.3=2.2 mm3, 2.0x2.0x2.0=8.0 mm3) were collected in 2 healthy adults (31±1 years) on a 3T Siemens Prisma with a 64 channel head coil via single shot 2D EPI (GRAPPA R=2; 6/8 PPF; FOV 220 mm; A/P phase encode). Scan time was limited by acquiring 10-25 slices over a 2 cm slab parallel to the hippocampus length that also enabled a short TR of 3300 ms. A lower than typical b value of 500 s/mm2 was used to minimize signal loss and yielded short TE of 52-77 ms even with longer EPI trains. A clinically relevant scan time of 6 minutes was targeted by acquiring 10 diffusion gradient directions and 10 b0s with 10 averages each. This choice was based on an experiment comparing 256 directions x 1 average, 30 directions x 8 averages, 10 directions x 25 averages; all at 1x1x1 mm3, b=500 s/mm2, TE= 72 ms, TR= 3300 ms, 14:29-15:22 min. ExploreDTI was used for tensor calculation (RESTORE algorithm) and manual ROIs to obtain FA and MD in white matter, cerebrospinal fluid, cortical grey matter and hippocampus. Lastly, hippocampal subfields were identified on the mean DWI image to determine the feasibility of manual segmentation on diffusion data.Results
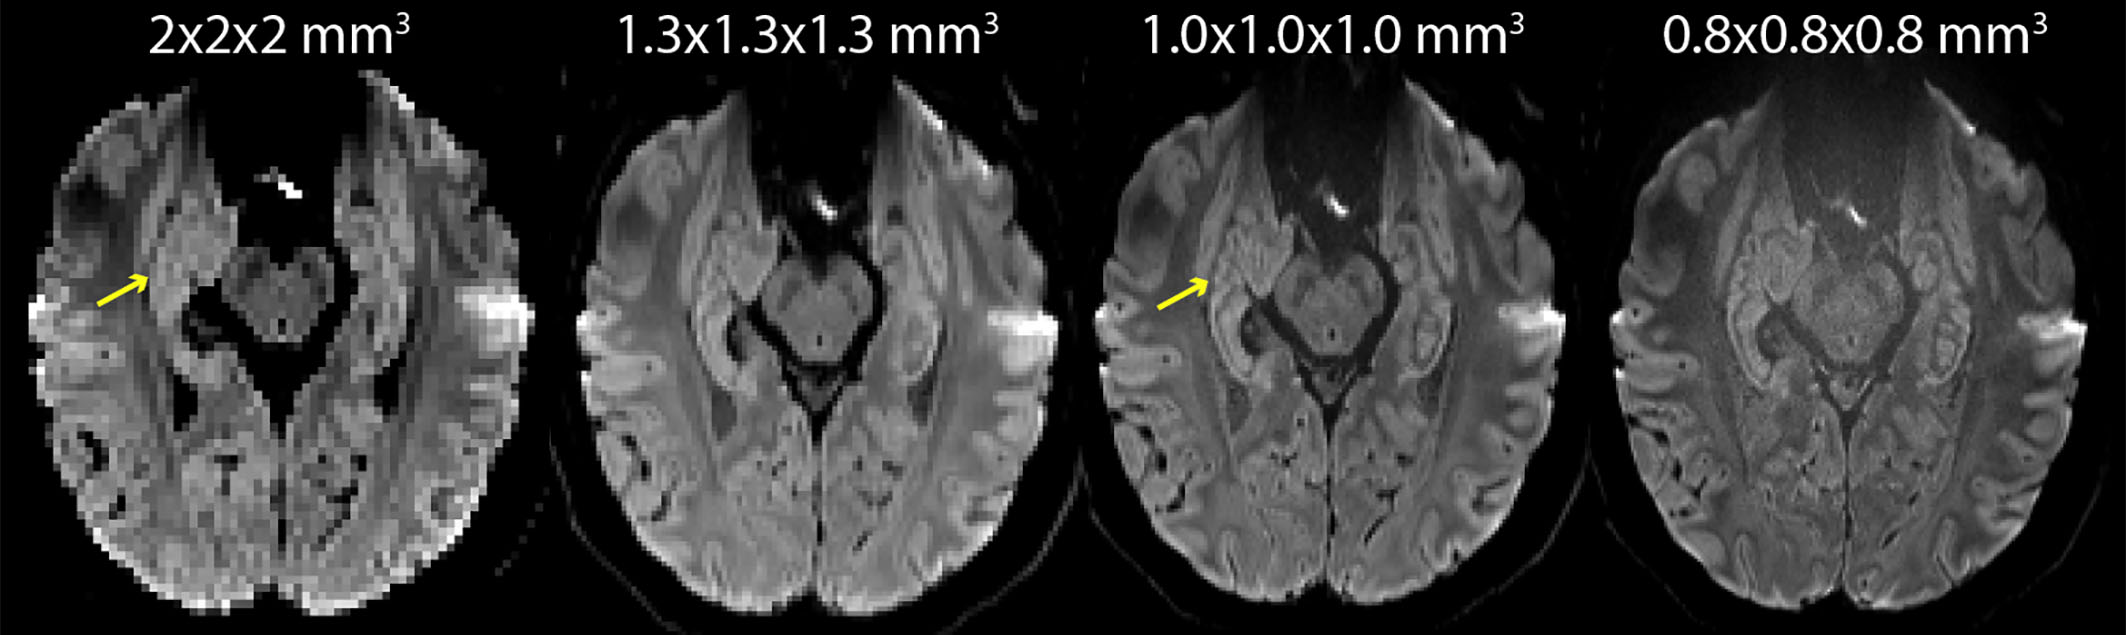
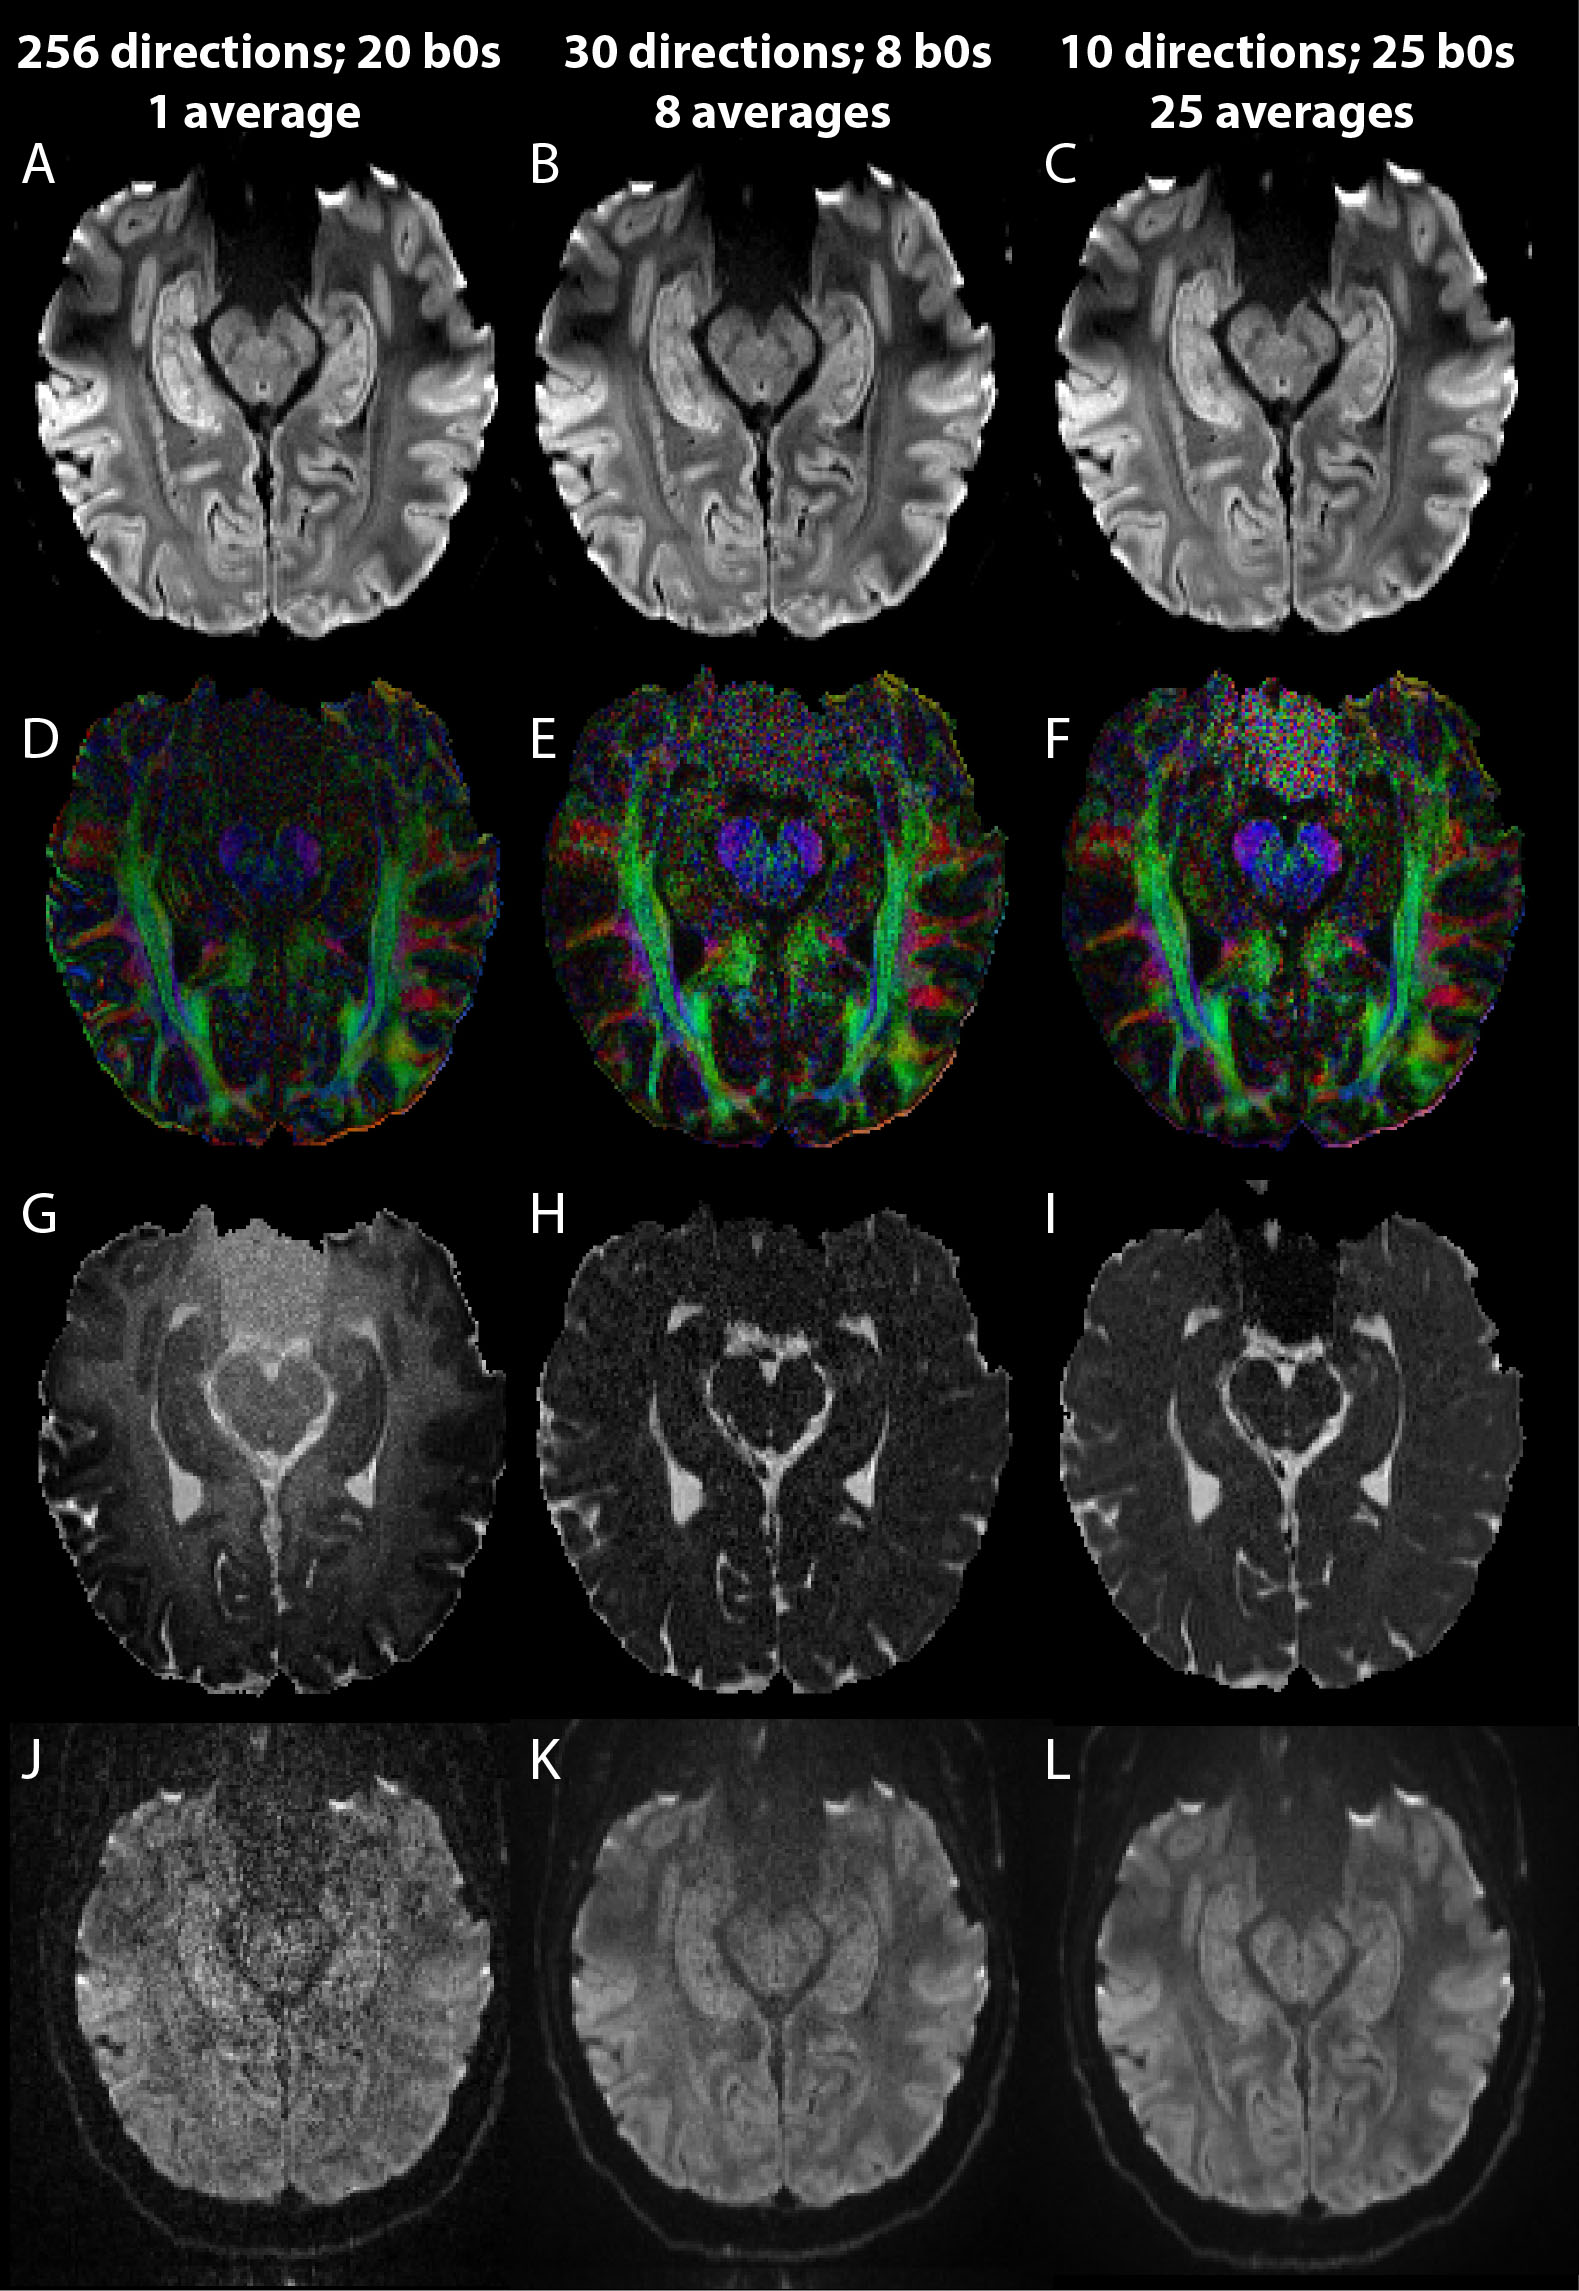
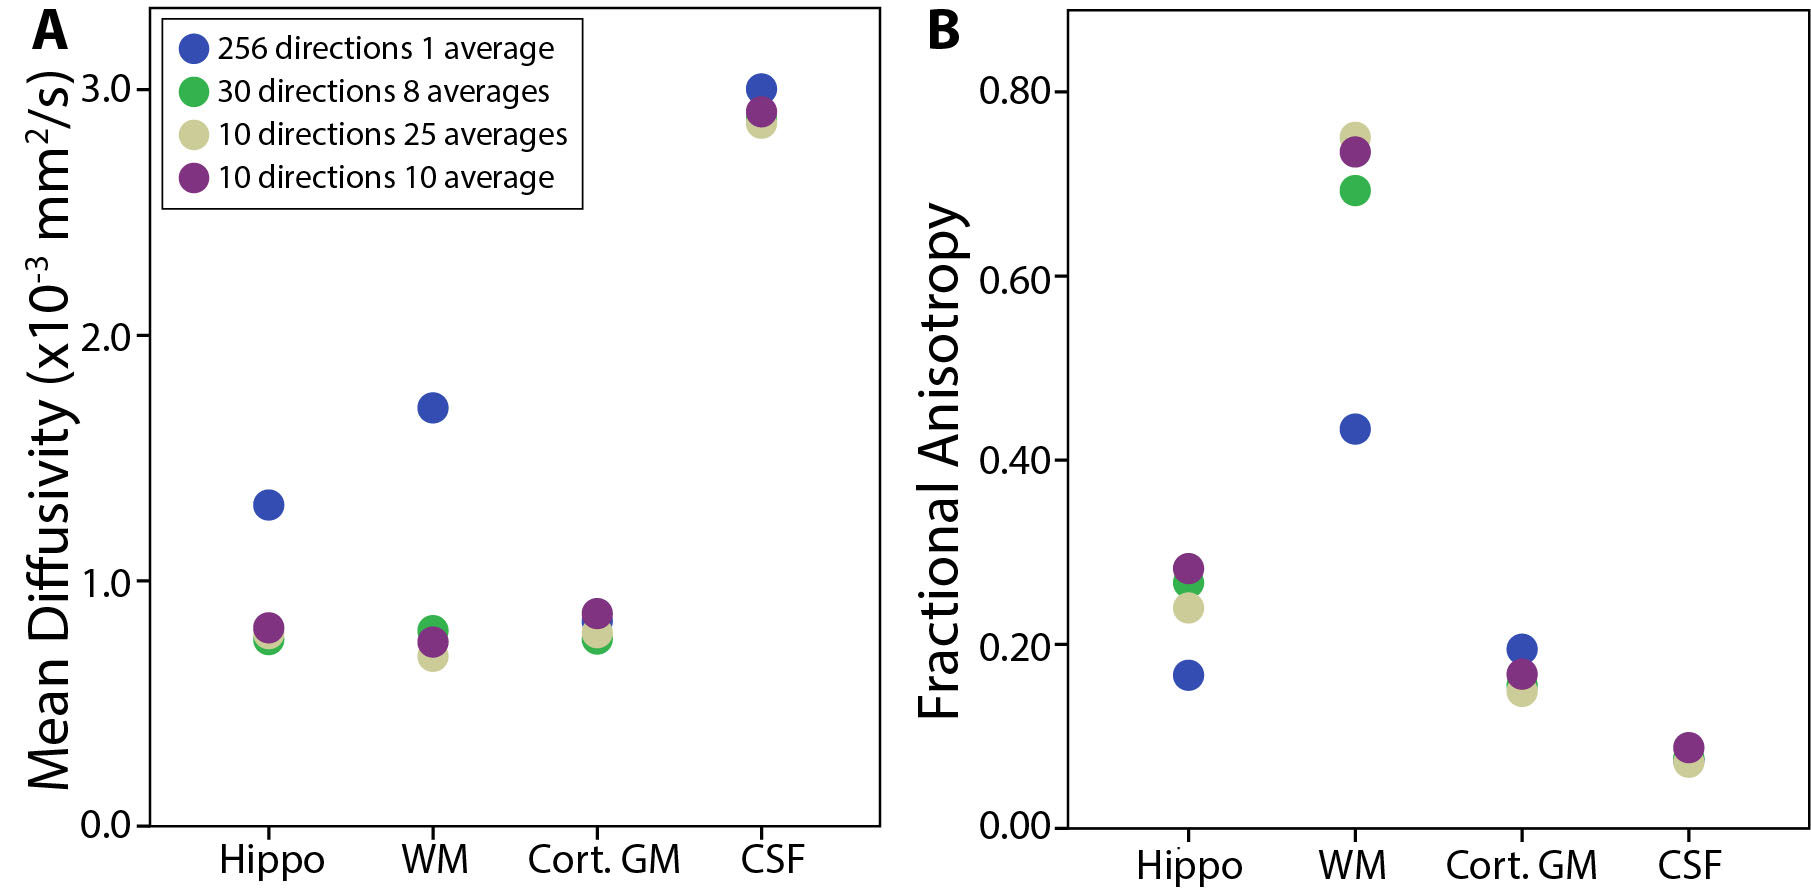
There is marked improvement in the visualization of the internal structure of the hippocampus on the mean DWI images with increasing resolution from ‘standard’ 2 mm to 0.8 mm isotropic, which reduces voxel volume by a factor of 16 (Figure 1). The 1 mm isotropic resolution produces a good compromise for image quality and contrast needed to identify hippocampal regions. However, marked reductions of SNR in the raw diffusion images at higher spatial resolutions can cause errors in the diffusion parameter estimates from the tensor calculation, particularly if the individual directions have only 1 average, see Figure 2J. This error was clearly noted by the appearance of unexpected grey-white contrast in the MD maps of single average 256 direction data (Figure 2G), where the MD of white matter was erroneously high by a factor of 2 (Figure 3A). However, if the input images into the tensor calculation have sufficient SNR by averaging over each direction first, for example 8 averages x 30 directions or 25 averages x 10 directions (Figure 2K,L), the result is the expected homogeneous grey-white matter MD map (Figure 2H,I).
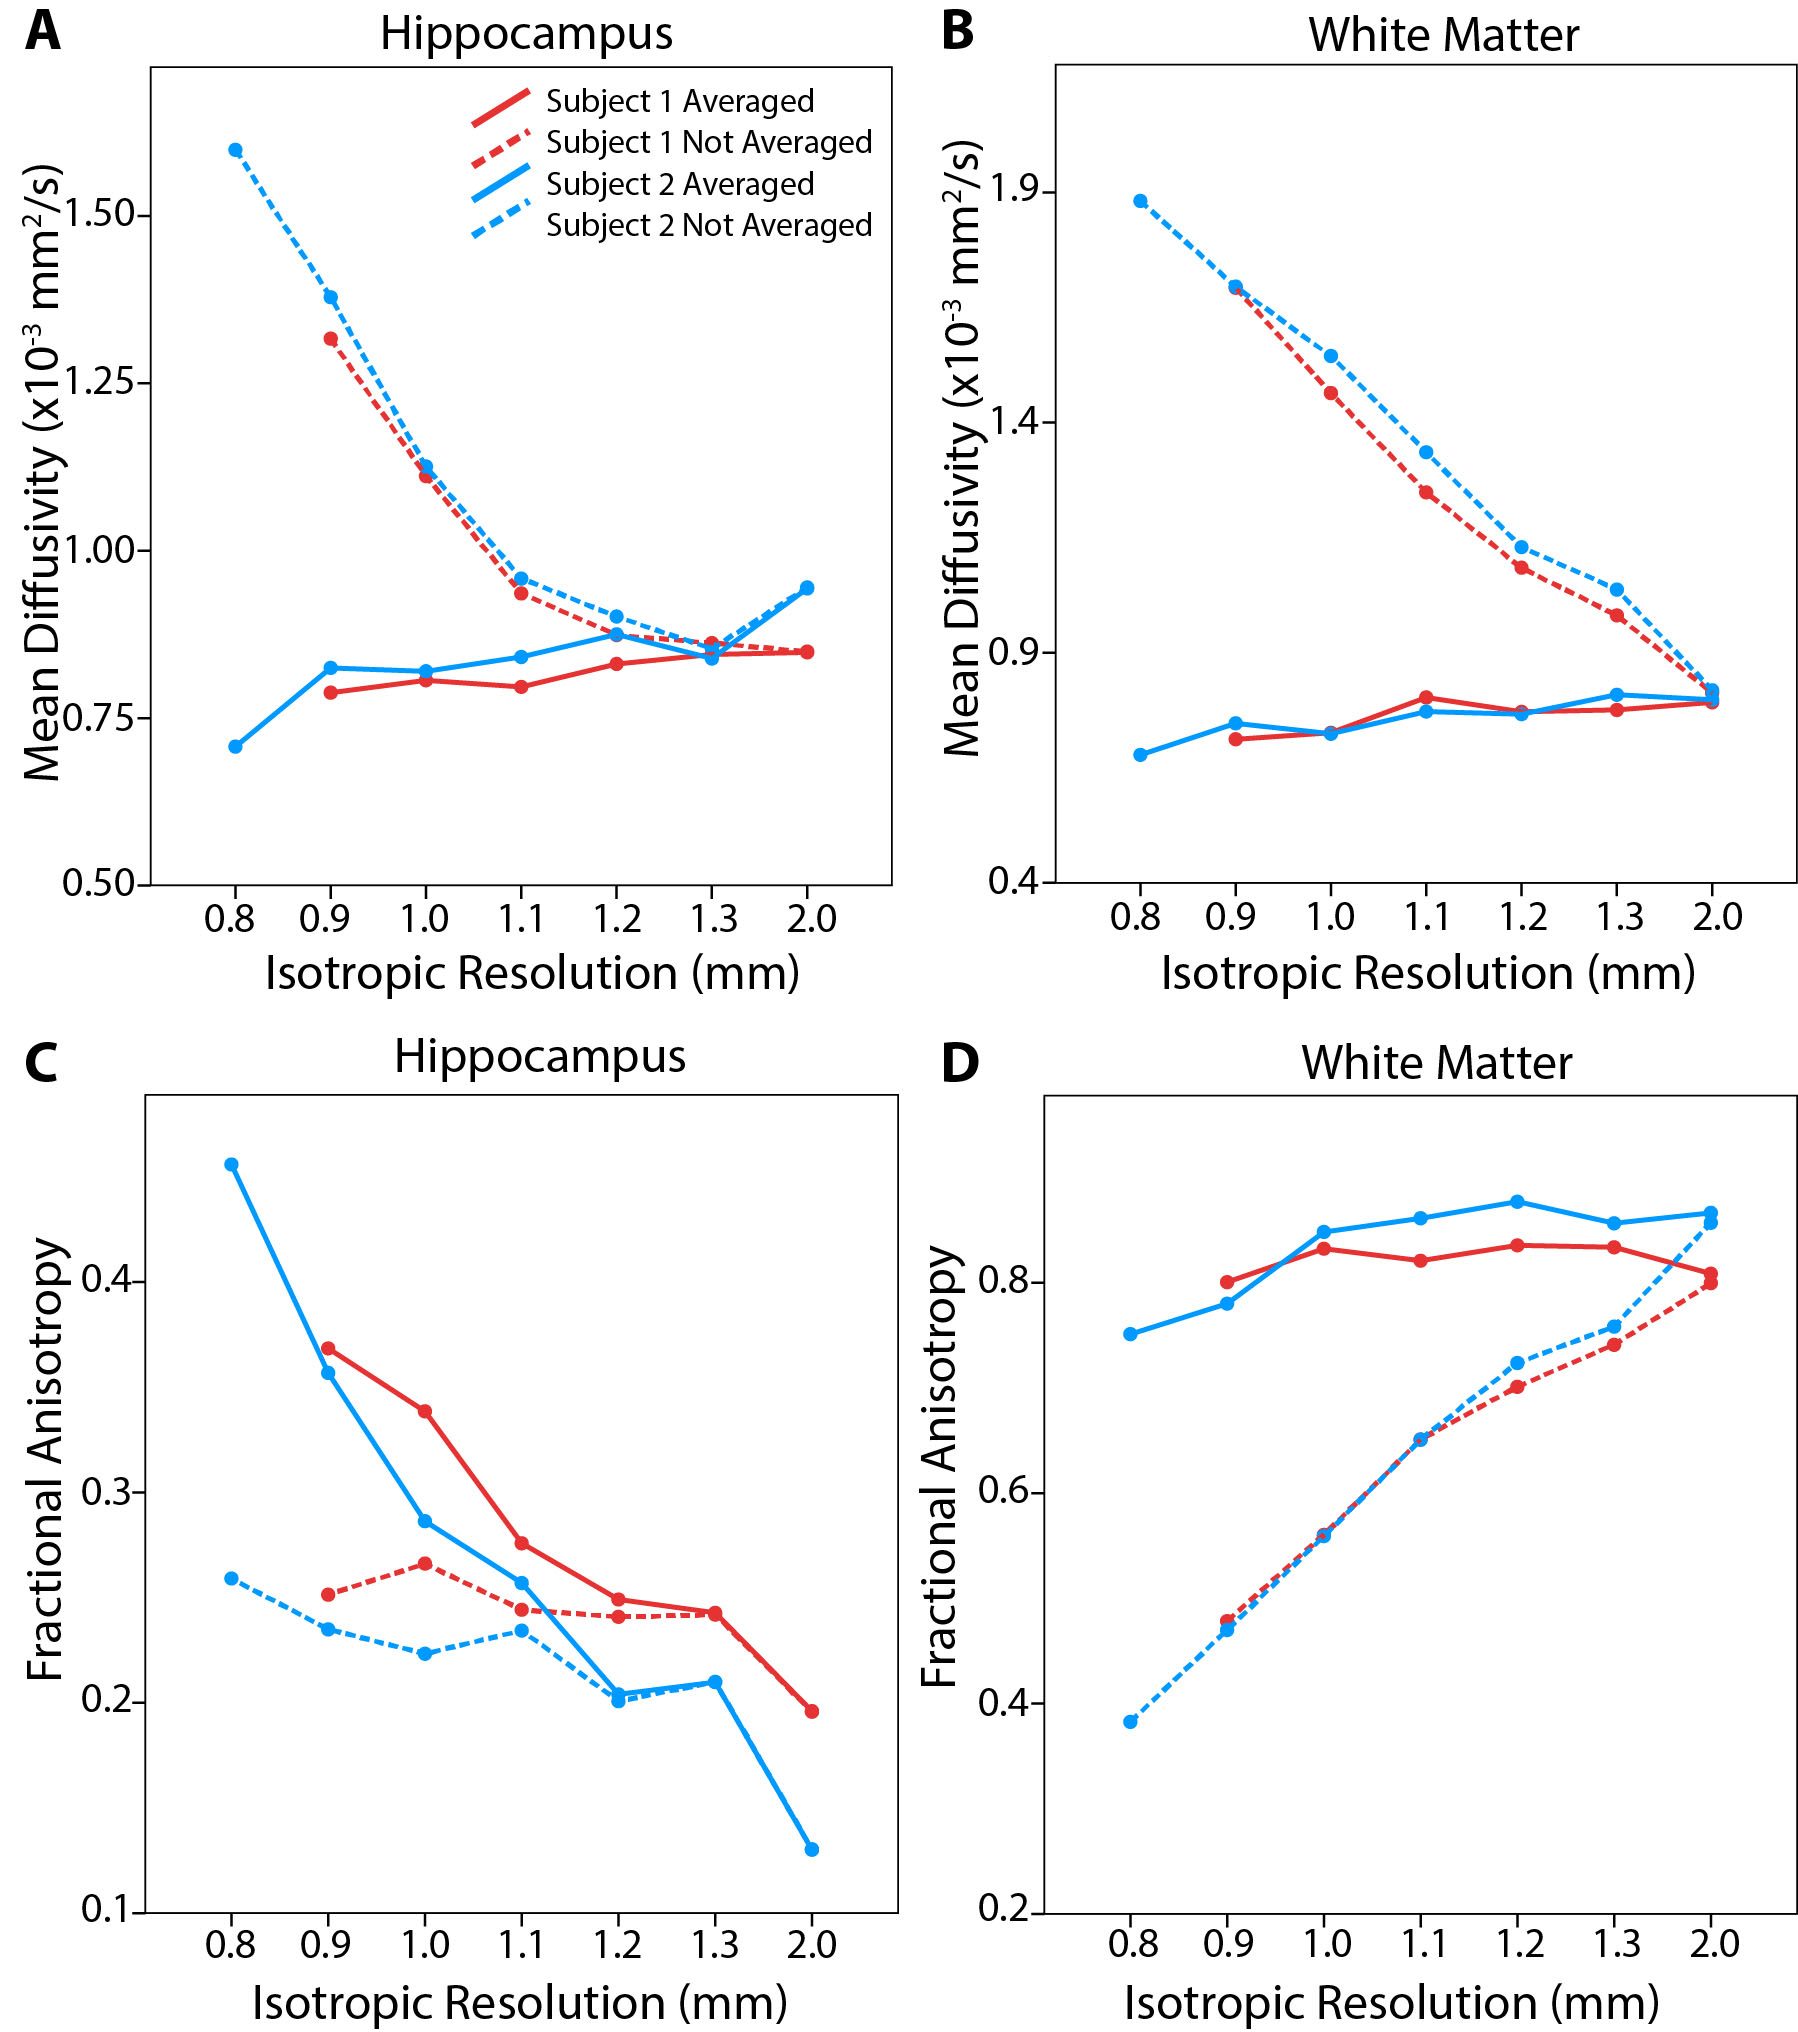
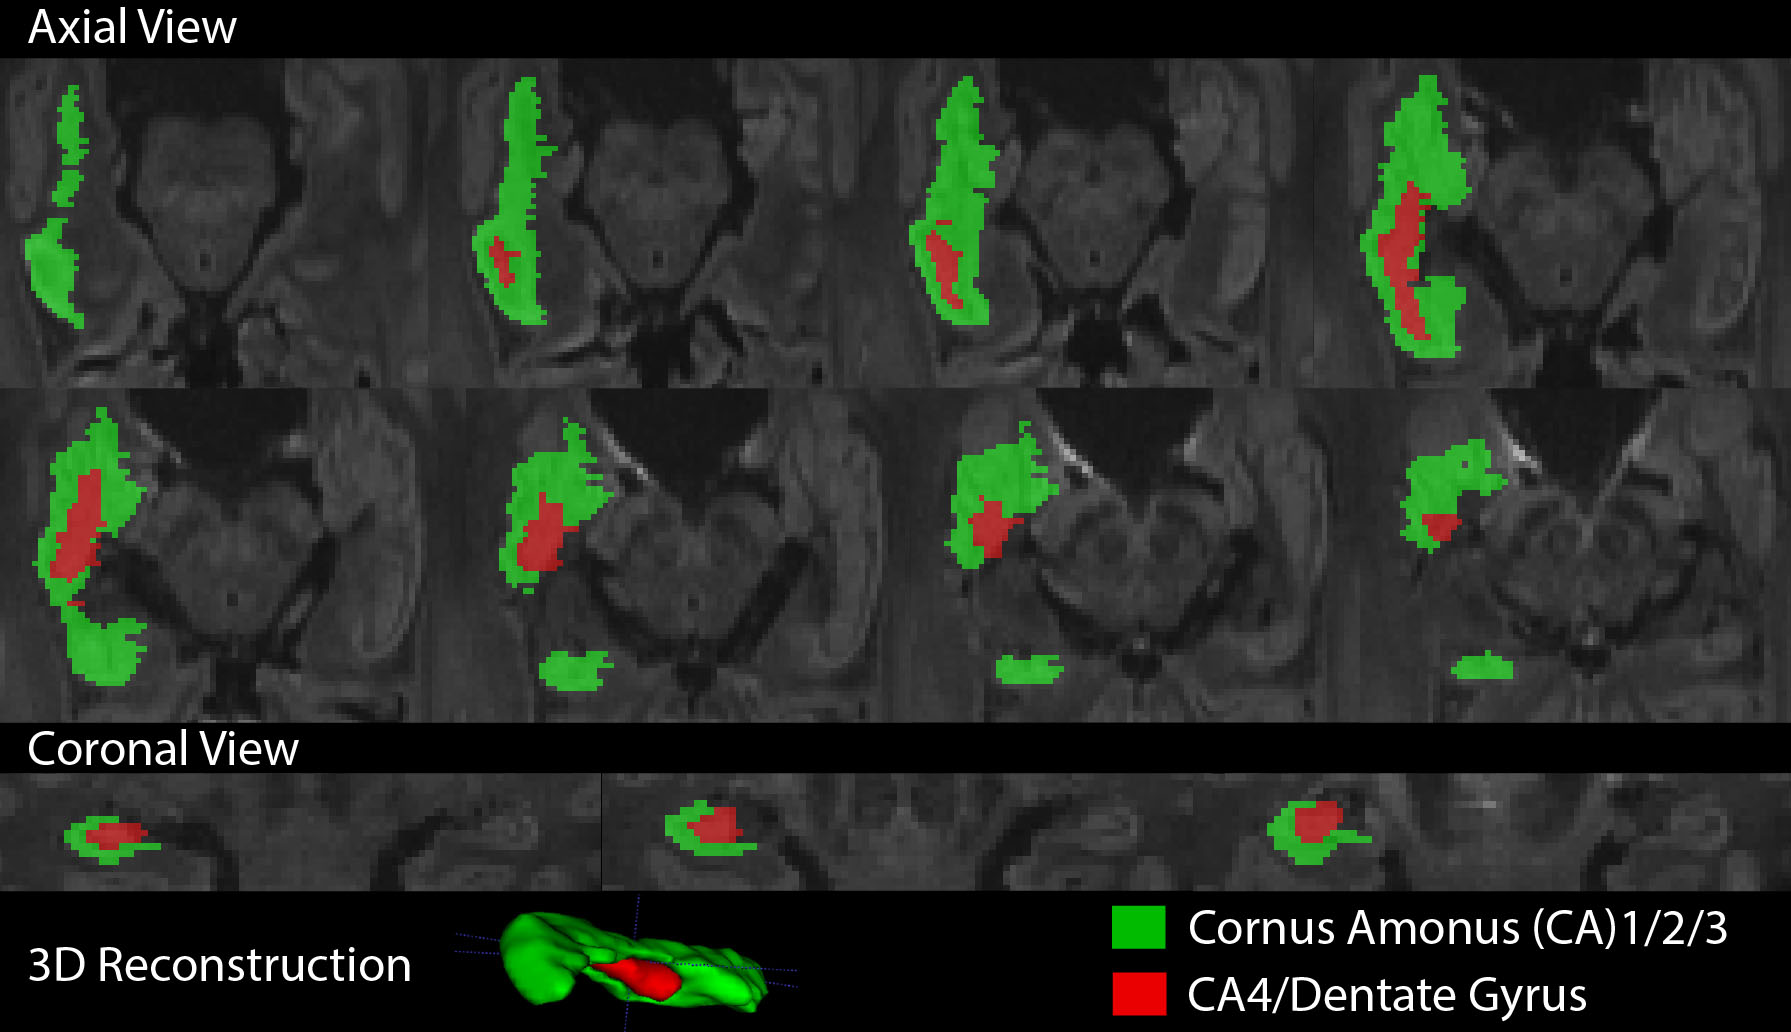
Using the 10 direction/10 average 6 min protocol, there is marked bias of MD in both white matter and hippocampus with smaller voxel size when the 100 images are analyzed separately (no averaging), but this bias is eliminated if the 10 acquisitions for each direction are averaged first (Figure 4A,B). In white matter, averaging the data produces stable FA values around 0.8 across all resolutions (Figure 4D); however, FA of the hippocampus increases with smaller voxel size even in averaged data (Figure 4C). In both tissues, the effect of averaging is largest in the highest resolution acquisitions and not present in 2 mm isotropic resolutions. Finally, the hippocampus was divided into a lateral (CA1-3) and mesial segment (CA4/dentate gyrus) on a 10 direction 10 average 1.0 mm isotropic protocol (Figure 5).
Conclusions
This 3T study demonstrates the feasibility of acquiring exquisite high resolution (1 mm isotropic) diffusion images capable of discerning hippocampal sub-field structure in a clinically feasible scan time of 6 minutes, which will have major implications for a range of disorders. We also show that, counter-intuitive to some recommendations, more directions is not better for accurate calculation of quantitative tensor parameters if the SNR is too low and that it is necessary to signal average fewer directions.Acknowledgements
This work was funded by the Canadian Institutes of Health Research (CIHR).References
1. Yassa MA, Mattfeld AT, Stark SM, Stark CEL. Age-related memory deficits linked to circuit-specific disruptions in the hippocampus. Proceedings of the National Academy of Sciences of the United States of America. 2011;108(21):8873-8878.
2. Pereira JB, Valls-Pedret C, Ros E, et al. Regional Vulnerability of Hippocampal Subfields to Aging Measured by Structural and Diffusion MRI. Hippocampus. 2014;24(4):403-414.
3. Li YD, Dong HB, Xie GM, Zhang LJ. Discriminative Analysis of Mild Alzheimer's Disease and Normal Aging Using Volume of Hippocampal Subfields and Hippocampal Mean Diffusivity: An In Vivo Magnetic Resonance Imaging Study. American Journal of Alzheimers Disease and Other Dementias. 2013;28(6):627-633.
4. Kobe T, Witte AV, Schnelle A, et al. Vitamin B-12 concentration, memory performance, and hippocampal structure in patients with mild cognitive impairment. American Journal of Clinical Nutrition. 2016;103(4):1045-1054.
5. van Uden IW, Tuladhar AM, van der Holst HM, et al. Diffusion tensor imaging of the hippocampus predicts the risk of dementia; the RUN DMC study. Hum Brain Mapp. 2016;37(1):327-337.
6. Steve TA, Jirsch JD, Gross DW. Quantification of subfield pathology in hippocampal sclerosis: A systematic review and meta-analysis. Epilepsy Res. 2014;108(8):1279-1285.
Figures