0720
Mapping of cerebral cortical microstructure characterized by non-Gaussian water diffusion in aging1Department of Radiology, Children's Hospital of Philadelphia, Philadelphia, PA, United States, 2Department of Radiology, Perelman School of Medicine, University of Pennsylvania, Philadelphia, PA, United States, 3Department of Imaging, Huntington Medical Research Institutes, 4Department of Radiology, University of Texas Southwestern Medical Center, 5Department of Radiology, Johns Hopkins University
Synopsis
The cellular and molecular processes inside the cerebral cortex play a critical role in aging and neurodegenerative disorders. The microstructural changes associated
Purpose:
The cellular and molecular processes inside the cerebral cortex play a critical role in aging and neurodegenerative disorders [1]. DTI, characterizing Gaussian water diffusion, has been primarily used to study microstructural changes of the white matter in the aging brain [2-3]. However, non-Gaussian diffusion is more prominent in the cerebral cortex. Compared to the measurement of metrics derived from conventional DTI [4-5] on cortical microstructural changes, diffusion kurtosis imaging (DKI) [6] with multi-shell diffusion MRI may provide refreshing insight into the cortical microstructural changes associated with the cellular and molecular processes in the cortex. Here, we aimed to accurately quantify the regional cortical microstructural changes of the aging brains. Multi-shell diffusion MRI was acquired to measure mean kurtosis (MK) derived from DKI at the center of the cerebral cortical layer for specific cortical regions.Methods:
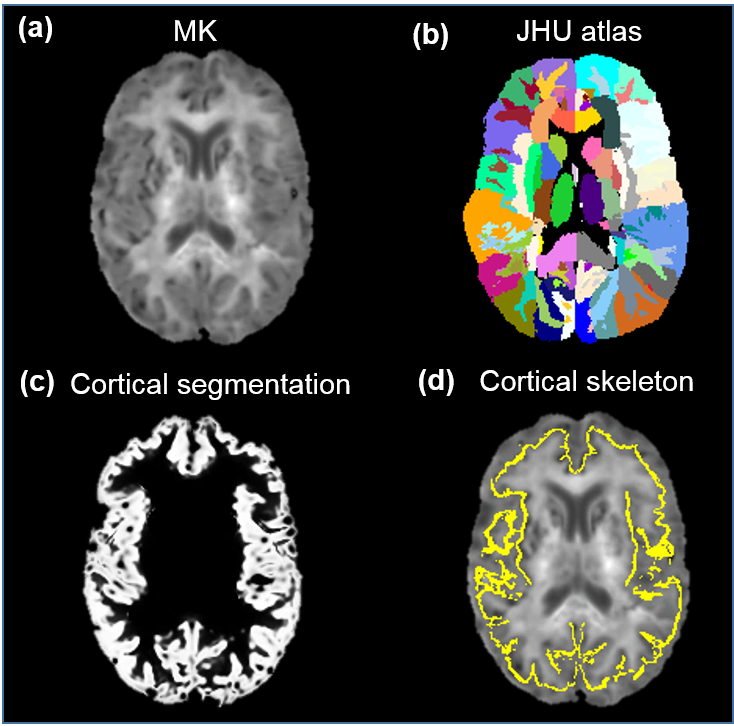
Subjects and data acquisition: 52 healthy subjects with the age of 60 to 82 years were recruited. All scans were performed on a 3T Philips Achieva system (Best, the Netherland). Multi-shell diffusion MR images (dMRI) were acquired using single-shot echo-planar imaging (EPI) and SENSE=2.3 with the following parameters: three b-values: 0, 1000 and 2500 s/mm2; 32 independent diffusion gradient directions; TR/TE=6200/62ms; FOV=224x224mm2; in-plane imaging resolution=2x2mm2, slice thickness=2.2mm with 65 slices without gap covering the entire brain. The multi-shell dMRI data of 51 subjects was used for the following analysis after discarding dMRI of one subject with incomplete acquisition. Fitting of diffusion kurtosis: Diffusion-weighted images were first corrected for head motion using affine transformation with DTIstudio. The mean kurtosis (MK) was calculated after fitting diffusion kurtosis [5] using the DKE package (http://academicdepartments.musc.edu/cbi/dki/). Fractional anisotropy (FA) maps were obtained after diffusion tensor fitting with DTIstudio for driving the image registration to the template space below. Calculation of regional cortical MK of at the center of the cortical layer: The cortical segmentation was obtained by using SPM (http://www.fil.ion.ucl.ac.uk/spm) with the contrasts of b0. FA maps of individual subjects were registered to the FA map of JHU atlas [7] template using FSL (http://www.fmrib.ox.ac.uk/fsl). The cortical segmentation maps of individual subjects were transferred to the template space with the same transformation obtained by FA registration. Skeletonization function in TBSS [8] of FSL was used to extract the “cortical skeleton” [9] based on the averaged cortical segmentation map in the template space. The cortical skeleton and labels of JHU atlas were inversely transferred to the native space. The MK of a specific cortical gyrus was calculated in the native space using the transferred JHU atlas labels overlaid on the cortical skeleton as the region of interests (ROI), as demonstrated in Fig 1. A general linear model was used to investigate the relationship of the MK measurement of a specific cortical region and age.Results:
Fig 2a-2d show significant MK decreases (p<0.05) in primary sensorimotor regions including left and right primary somatosensory (S1) and left primary motor (M1) regions. The MK measurements in right M1 regions show trend of significant decrease (p=0.063). MK decreases in the left and right visual (V1) and prefrontal cortex are not significant. Fig 2 and Fig 3 demonstrate that significant MK decreases occur mainly at primary sensorimotor cortex, but not other cortical regions.Discussion and conclusion:
Significant MK decreases were found in the primary somatosensory regions, but not in prefrontal and visual regions, suggesting differentiated aging processes in different cortical regions. FA derived from DTI is a widely used metric characterizing microstructural changes. However, cortical FA measurements are at noise level and cannot offer meaningful insight into cortical microstructural changes. On the contrary, measurements of cortical MK derived from DKI could serve as an effective microstructural biomarker representing cortical tissue architecture associated with microstructural barriers [10]. The significant MK decreases observed only in primary sensorimotor regions, but not in visual or prefrontal cortical regions, may indicate the decline of primary sensorimotor function from age 60 to 82 years. Age-dependent cortical MK decreases may be related to the loss of dendrite connections and tissue compaction. The approach of measuring MK on the “cortical skeleton” was adopted to alleviate the partial volume effects in the relatively thin cortical mantle with the thickness of 2-4 mm. The delineation of the cortical MK changes during aging in all cortical gyri and measured on the cortical skeleton is underway.Acknowledgements
This study is funded by NIH UL1TR001105, MH092535, MH092535-S1 and HD086984. The content is solely the responsibility of the authors and does not necessarily represent the official views of the NIH.References
[1] Braak H, et al. Neuropathological staging of Alzheimer-related changes. Acta Neuropathologica, 1991; 82(4): 239-259.
[2] Wozniak JR, et al. Advances in white matter imaging: a review of in vivo magnetic resonance methodologies and their applicability to the study of development and aging. Neuroscience & Biobehavioral Reviews, 2006; 30(6): 762-774.
[3] Madden DJ, et al. Diffusion tensor imaging of cerebral white matter integrity in cognitive aging. Biochim. Biophys. Acta., 2012; 1822(3): 386-400.
[4] Ray KM, et al, Mild cognitive impairment: apparent diffusion coefficient in regional gray matter and white matter structures. Radiology, 2006; 241(1): 197-205.
[5] Jeon T, et al. Regional changes of cortical mean diffusivities with aging after correction of partial volume effects. Neuroimage, 2012; 62(3): 1705-1716.
[6] Jensen JH, et al. Diffusional kurtosis imaging: the quantification of non-Gaussian water diffusion by means of Magnetic Resonance Imaging. Magnetic Resonance in Medicine, 2005; 53(6):1432-1440.
[7] Susumu M, et al. Stereotaxic white matter atlas based on diffusion tensor imaging in an ICBM template. Neuroimage, 2008; 40(2): 570-582.
[8] Smith SM, et al. Tract-based spatial statistics: voxelwise analysis of multisubject diffusion data. Neuroimage, 2006; 31(4):1487-1505.
[9] Yu Q, et al. Structural development of human fetal and preterm brain cortical plate based on population-averaged templates. Cerebral Cortex, 2016; 26: 4381-4391.
[10] Helpern JA, et al. Preliminary evidence of altered gray and white matter microstructural development in the frontal lobe of adolescents with attention-deficit hyperactivity disorder: A diffusional kurtosis imaging study. Journal of Magnetic Resonance Imaging, 2011;33(1):17-23.
Figures