0719
HARDI and oscillating gradient diffusion MRI reveal disrupted embryonic cortical microstructure1Radiology, Johns Hopkins University School of Medicine, BALTIMORE, MD, United States, 2BCMB Allied Graduate Program, Weill Cornell Graduate School of Medical Sciences, 3Developmental Biology Program, Memorial Sloan Kettering Cancer Center, 4Graduate Program in Neuroscience, Weill Cornell Graduate School of Medical Sciences, 5Radiology, New York University School of Medicine, NY, United States
Synopsis
We investigated the capability of advanced diffusion MRI, including high-angular resolution diffusion MRI (HARDI) and oscillating gradient diffusion MRI, to characterize cortical microstructural organization in the embryonic mouse brains. HARDI-based tractography revealed reduced axons in the intermediate zone of the embryonic cortex in the Sas-4-/-;p53-/- mice compared to the wildtypes. The oscillating gradient diffusion MRI delineated a three-lamina structure in the cortex of the normal embryonic brain, reflecting the neuronal cell distributions during embryonic brain development, which was altered by mislocalized RGPs in extra-ventricular zone, resulting in diminished contrast in the mutant cortex.
Introduction
Diffusion MRI (dMRI) is an important tool to study early brain development as it can generate superb tissue contrasts that are sensitive to tissue microstructural organization in the embryonic and neonatal brain1, which is critical for monitoring brain development. For example, diffusion tensor imaging (DTI) can visualize early white matter pathways and the radial organization of the embryonic mouse cortex2; and the formation of more complex microstructures (e.g., cross fibers) can be revealed by high-angular resolution diffusion MRI (HARDI)3,4. Recent advances in oscillating gradient dMRI5 have shown potential in providing additional tissue contrasts that reflect cellularity6-10, and potentially neuronal size and density in the brain11-13. In this study, we used oscillating gradient dMRI and HARDI to characterize the cortical microstructure in wild-type and the Sas-4-/-;p53-/- embryonic mouse brain, which has abnormal neuronal migration14.Methods
Ex vivo MRI of wildtype and Sas4f/f;p53f/f Emx1Cre/+ (referred as Sas-4-/-;p53-/- hereafter) mouse brains at embryonic day 15.5 (E15.5) (n=4 for both groups) were performed on an 11.7 T spectrometer (Bruker Biospin) with a 10 mm volume transceiver coil. HARDI data were acquired using a 3D diffusion-weighted gradient spin echo (GRASE) sequence15 with double sampled EPI readout and twin navigators at 80 μm isotropic resolution, TE/TR = 26/600 ms, 2 signal averages, δ/Δ=4/12 ms, 30 diffusion directions and two b-shells of 1000 and 2000 s/mm2. Reconstruction of the HARDI data were performed using constraint spherical deconvolution16 (lmax=6) in MRtrix, and streamlines were generated at a step size of 0.02 mm and a minimal fiber length of 0.5 mm, based on which the track-density image (TDI)17 and apparent fiber density (AFD)18 were calculated. Oscillating gradient (OGSE) dMRI data were acquired using a 3D trapezoid cosine diffusion gradient GRASE sequence with oscillating frequencies of 50, 100, 150, and 200 Hz (effective diffusion time of 5, 2.5, 1.67, and 1.25 ms), at 80 μm isotropic resolution, TE/TR = 60/800 ms, 2 signal averages, 10 diffusion directions with b-value of 800 s/mm2. Co-registered pulsed gradient (PGSE) dMRI data were acquired at Δ=10 and 20 ms at the same resolution, TE, TR, and diffusion encoding. ADC maps were calculated from dMRI data at all diffusion times, and the rate of ADC changes with increasing oscillating frequency (ΔfADC) were estimated using linear fitting.Results
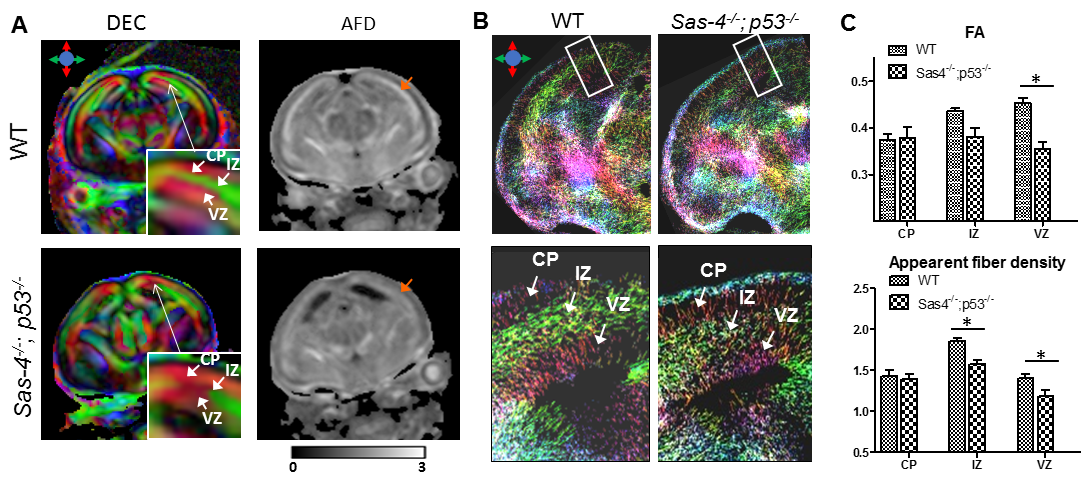
Directionally-encoded-colormap (DEC) (Fig. 1A) showed three distinct layers in the E15.5 WT mouse cortex (the cortical plate (CP), intermediate zone (IZ), and ventricular zone (VZ)). The IZ, which contains axons running parallel to the cortical surface as visualized in the TDI map (Fig. 1B), had high AFD values compared to VZ and CP. Images from the E15.5 Sas-4-/-;p53-/- mouse brain showed reduced AFD values in the IZ and VZ, reduced FA in the VZ (Fig. 1C), and less fiber streamlines in the IZ than the WT mouse brain, suggesting reduced number of axons in this region.
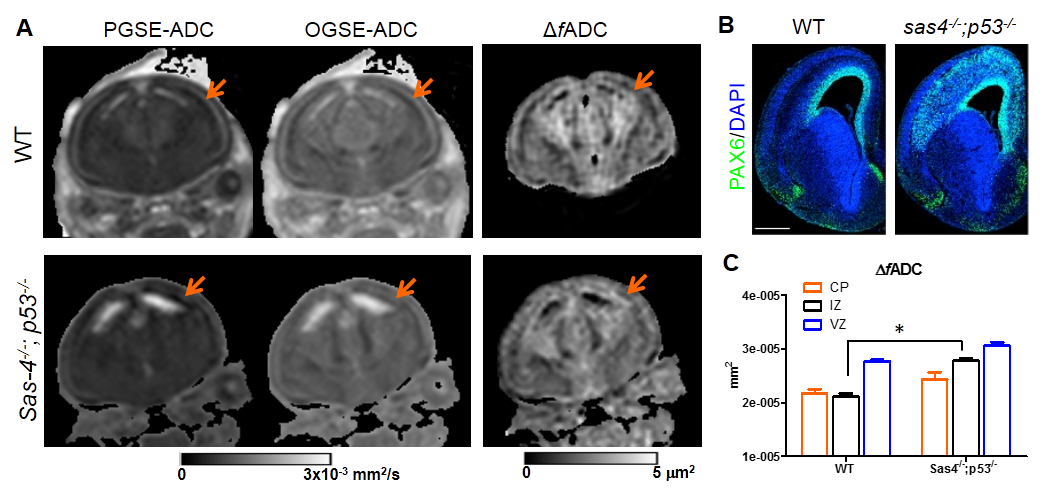
The CP, IZ, and VZ were also visible in the PGSE and OGSE ADC maps of the WT E15.5 mouse brain (Fig. 2A). The ΔfADC map of the WT mouse brain showed lower ΔfADC values in the IZ than the CP and VZ, which agreed well with the DAPI staining (Fig. 2B) that had low cell concentration in the IZ. The contrasts in both ADC and ΔfADC maps for these layers were attenuated in the Sas-4-/-;p53-/- mouse brain (Fig. 2A), due to significantly increased ΔfADC values in the IZ than the WT (p<0.01) (Fig. 2C). This change is possibly due to disrupted cortical organization at E15.5, marked by the ectopic radial glial progenitors (RGPs, labeled by PAX6) outside the ventricular zone (VZ) and into the IZ14 (Fig. 2B).
Discussion and Conclusion
We
investigated the use of advanced dMRI techniques to characterize microstructural
organizations in wildtype and the Sas-4-/-;p53-/- mouse brain at E15.5. In the Sas-4-/-;p53-/- mouse brain, dysfunction of the RGPs resulted in abnormal cortical
organization and neuronal migration14. The HARDI-based
tractography revealed reduced fiber structures in IZ of the Sas-4-/-;p53-/- mutants, which suggests
reduced axons in the IZ. OGSE dMRI was previously shown to highlight neuronal layers
in the adult mouse brain12,13. Here, it was able to delineate the
three-layer structure in the embryonic cortex and the contrast reflected the distribution
of neuronal density, which was altered in the Sas-4-/-;p53-/- mutants. Our results demonstrated the capability of HARDI and OGSE dMRI
in distinguishing microstructural phenotypes in the embryonic mouse brain.Acknowledgements
This work was made possible by the following funding supports: R01HD074593 (JZ) and R21 NS098018 (DW).References
1. Mori, S. & Zhang, J. Principles of diffusion tensor imaging and its applications to basic neuroscience research. Neuron 51, 527-539, doi:10.1016/j.neuron.2006.08.012 (2006).
2. Zhang, J. et al. Three-dimensional anatomical characterization of the developing mouse brain by diffusion tensor microimaging. Neuroimage 20, 1639-1648 (2003).
3. Tuch, D. S., Reese, T. G., Wiegell, M. R. & Wedeen, V. J. Diffusion MRI of complex neural architecture. Neuron 40, 885-895 (2003).
4. Aggarwal, M., Gobius, I., Richards, L. J. & Mori, S. Diffusion MR Microscopy of Cortical Development in the Mouse Embryo. Cereb Cortex 25, 1970-1980, doi:10.1093/cercor/bhu006 (2015).
5. Gore, J. C. et al. Characterization of tissue structure at varying length scales using temporal diffusion spectroscopy. NMR in biomedicine 23, 745-756, doi:10.1002/nbm.1531 (2010).
6. Portnoy, S., Fichtner, N. D., Dziegielewski, C., Stanisz, M. P. & Stanisz, G. J. In vitro detection of apoptosis using oscillating and pulsed gradient diffusion magnetic resonance imaging. NMR in biomedicine 27, 371-380, doi:10.1002/nbm.3070 (2014).
7. Xu, J., Does, M. D. & Gore, J. C. Quantitative characterization of tissue microstructure with temporal diffusion spectroscopy. J Magn Reson 200, 189-197, doi:10.1016/j.jmr.2009.06.022 (2009).
8. Xu, J., Does, M. D. & Gore, J. C. Dependence of temporal diffusion spectra on microstructural properties of biological tissues. Magn Reson Imaging 29, 380-390, doi:10.1016/j.mri.2010.10.002 (2011).
9. Xu, J. et al. Characterizing tumor response to chemotherapy at various length scales using temporal diffusion spectroscopy. PLoS One 7, e41714, doi:10.1371/journal.pone.0041714 (2012).
10. Xu, J. et al. Influence of cell cycle phase on apparent diffusion coefficient in synchronized cells detected using temporal diffusion spectroscopy. Magn Reson Med 65, 920-926, doi:10.1002/mrm.22704 (2011).
11. Aggarwal, M., Burnsed, J., Martin, L. J., Northington, F. J. & Zhang, J. Imaging neurodegeneration in the mouse hippocampus after neonatal hypoxia-ischemia using oscillating gradient diffusion MRI. Magn Reson Med 72, 829-840, doi:10.1002/mrm.24956 (2014).
12. Aggarwal, M., Jones, M. V., Calabresi, P. A., Mori, S. & Zhang, J. Probing mouse brain microstructure using oscillating gradient diffusion MRI. Magn Reson Med 67, 98-109, doi:10.1002/mrm.22981 (2012).
13. Wu, D., Martin, L. J., Northington, F. J. & Zhang, J. Oscillating gradient diffusion MRI reveals unique microstructural information in normal and hypoxia-ischemia injured mouse brains. Magn Reson Med 72, 1366-1374, doi:10.1002/mrm.25441 (2014).
14. Insolera, R., Bazzi, H., Shao, W., Anderson, K. V. & Shi, S. H. Cortical neurogenesis in the absence of centrioles. Nature Neuroscience 17, 1528-1535, doi:10.1038/nn.3831 (2014).
15. Wu, D. et al. In vivo high-resolution diffusion tensor imaging of the mouse brain. Neuroimage 83, 18-26, doi:10.1016/j.neuroimage.2013.06.012 (2013).
16. Tournier, J. D., Calamante, F. & Connelly, A. Robust determination of the fibre orientation distribution in diffusion MRI: non-negativity constrained super-resolved spherical deconvolution. Neuroimage 35, 1459-1472, doi:10.1016/j.neuroimage.2007.02.016 (2007).
17. Calamante, F. et al. Super-resolution track-density imaging studies of mouse brain: Comparison to histology. NeuroImage 59, 286-296, doi:10.1016/j.neuroimage.2011.07.014 (2012).
18. Raffelt, D. et al. Apparent Fibre Density: A novel measure for the analysis of diffusion-weighted magnetic resonance images. NeuroImage 59, 3976-3994, doi:10.1016/j.neuroimage.2011.10.045 (2012).
Figures