0718
Layer-specific analysis of cortical microstructure using in-vivo 7T diffusion MRI1Department of Cognitive Neuroscience, Maastricht University, Maastricht, Netherlands, 2Center for Imaging of Neurodegenerative Diseases, Veterans Affairs Health Care System, San Francisco, CA, United States, 3Center for Magnetic Resonance Research, University of Minnesota, Minneapolis, MN, United States
Synopsis
We present unique in-vivo human 7T diffusion MRI data and a dedicated layer-specific analysis pipeline. We leverage the high spatial and angular resolution of this dataset to improve cortical fiber orientation mapping (i.e. limit gyral bias and identify fiber crossings), and study axonal trajectories within the cortex across depths.
Purpose
Recent work1-3 about cortical tractography has illustrated the tendency of such approaches to predominantly terminate in the gyral crowns and less often reach the sulcal fundi. However, this gyral bias has not been observed in anatomical tracer studies and is likely explained by a combination of technical limitations of current diffusion MRI data (dMRI) and analysis methods1. In particular, most fiber orientations in the gyral walls and sulcal fundi are tangential to the white matter (WM) / gray matter (GM) surface. Although this organization is observed in the WM in histological data1, ex-vivo studies also show that, in the gyral walls, axonal trajectories curve at oblique angles into the cortex before becoming radial. In sulcal fundi, fibers curve sharply into the cortex. Crossing fibers, tangential to the WM/GM surface, have also been observed throughout the cortex, and in particular in layers I, IV-VI4-6. Recent work on the organization of fibers in and around the human cortex using dMRI have shown improved detection of fibers perpendicular to the gyral walls and sulcal fundi7, laminar organization with distinct radial and tangential diffusion properties in post-mortem brain blocks from the visual cortex5, transition from radial to tangential diffusion tensor orientation between the motor and somatosensory cortices8, and dependence of anisotropy and orientation on cortical depth9,10. Here, we present an in-vivo imaging protocol based on the Human Connectome Project’s 7T dMRI protocol11, and a dedicated layer-specific analysis pipeline12, to investigate the organization of axonal trajectories within the cortex.Methods
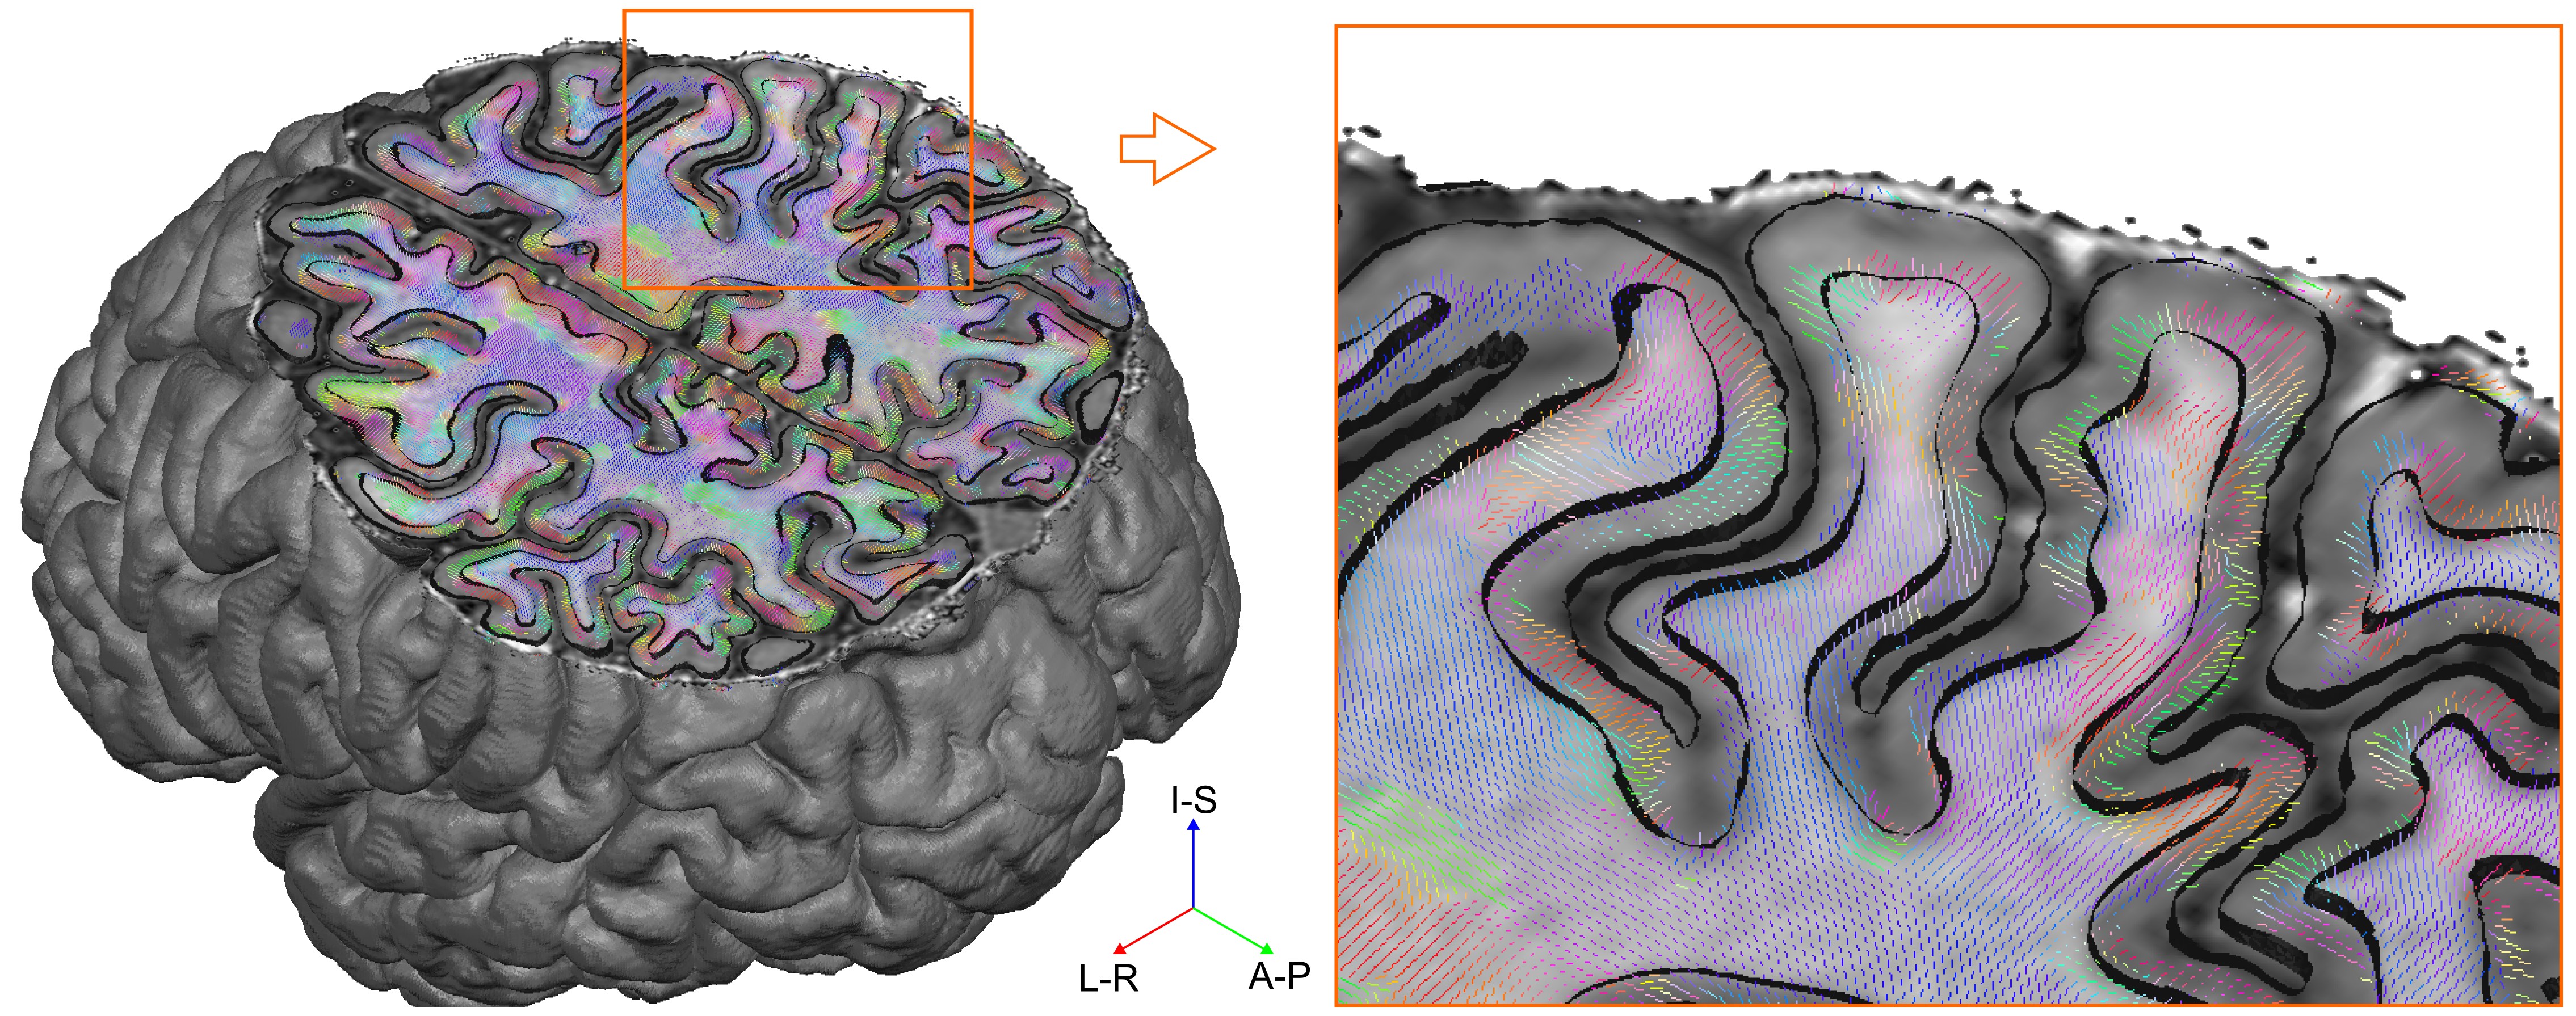
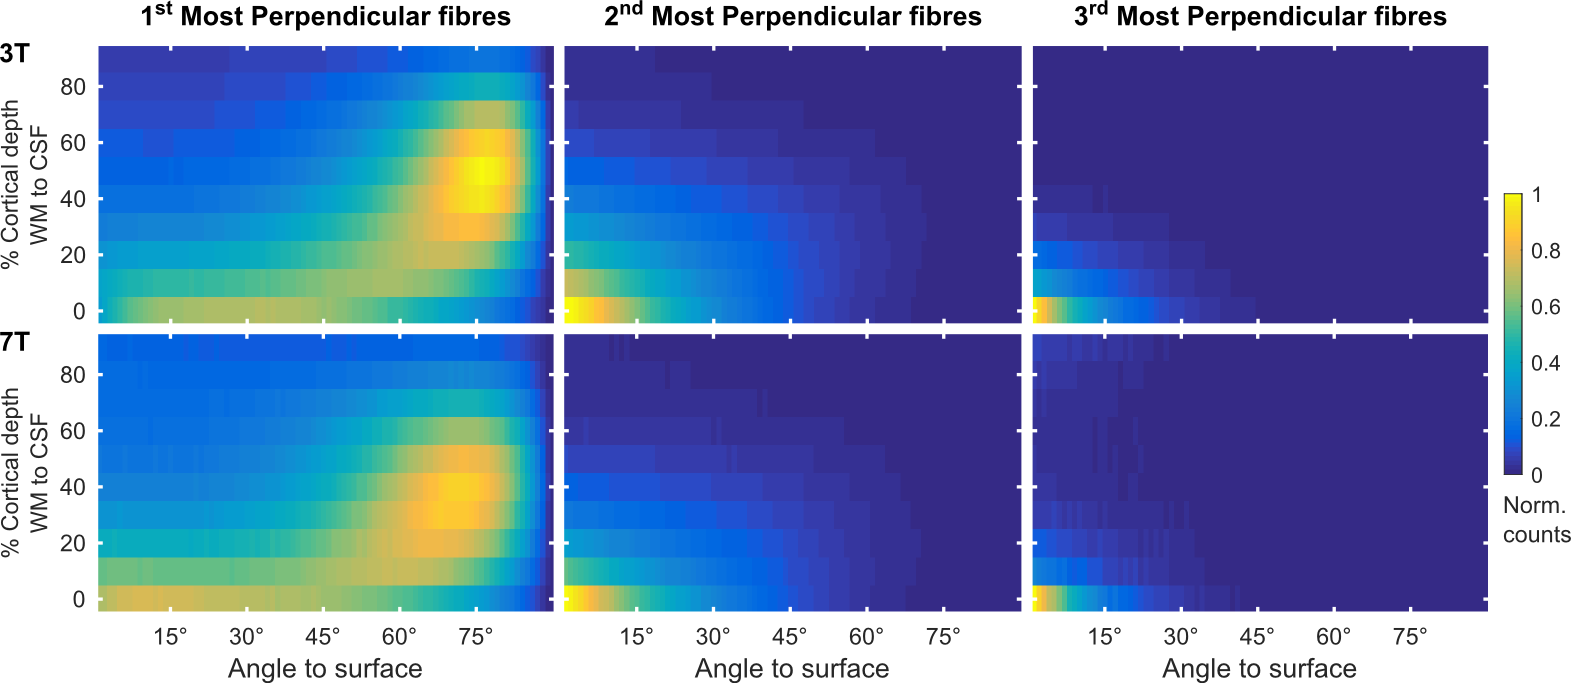
We collected whole brain dMRI data (voxel size=1.05 mm isotropic; MB=2; GRAPPA=3; b-values =1000, 2000, 3000 s/mm2; 66 directions and 11 b=0 volumes per b-value, obtained both in AP and PA phase encoding directions), and T1- and PD-weighted anatomical (voxel size=0.7 mm isotropic) measurements in N=6 healthy volunteers at 7 Tesla (Siemens), using a volume coil with 32 receive channels (Nova Medical). For comparison, pre-processed 3 Tesla dMRI data13 from N=6 healthy volunteers (voxel size=1.25 mm isotropic; MB=3; b-values=1000, 2000, 3000 s/mm2; 90 directions and 5 b=0 volumes per b-value, obtained both in RL and LR phase encoding directions) were obtained from the Human Connectome Project (https://www.humanconnectome.org/). The 3T and 7T total scan time was the same (~ 1 hr.), each providing unprecedented human data sets for in-vivo diffusion imaging. Surfaces at different cortical depths were obtained by segmenting the cortical ribbon from unbiased T1 data14 at 7T and from standard T1 data at 3T. Boundary based registration15 as implemented in FSL16 was used to register anatomical and dMRI data (Fig. 1). In dMRI space, we computed, for every surface vertex and at every cortical depth, the maximum dot product between fiber orientations (with volume fraction f > 5%) and the surface normal (i.e. radiality). Normalized histogram counts were obtained by dividing each histogram by the maximum count across cortical depths and excluding the corpus callosum. Group maps (at 7T) were obtained by averaging single subject results after cortex-based alignment17.Results and Discussion
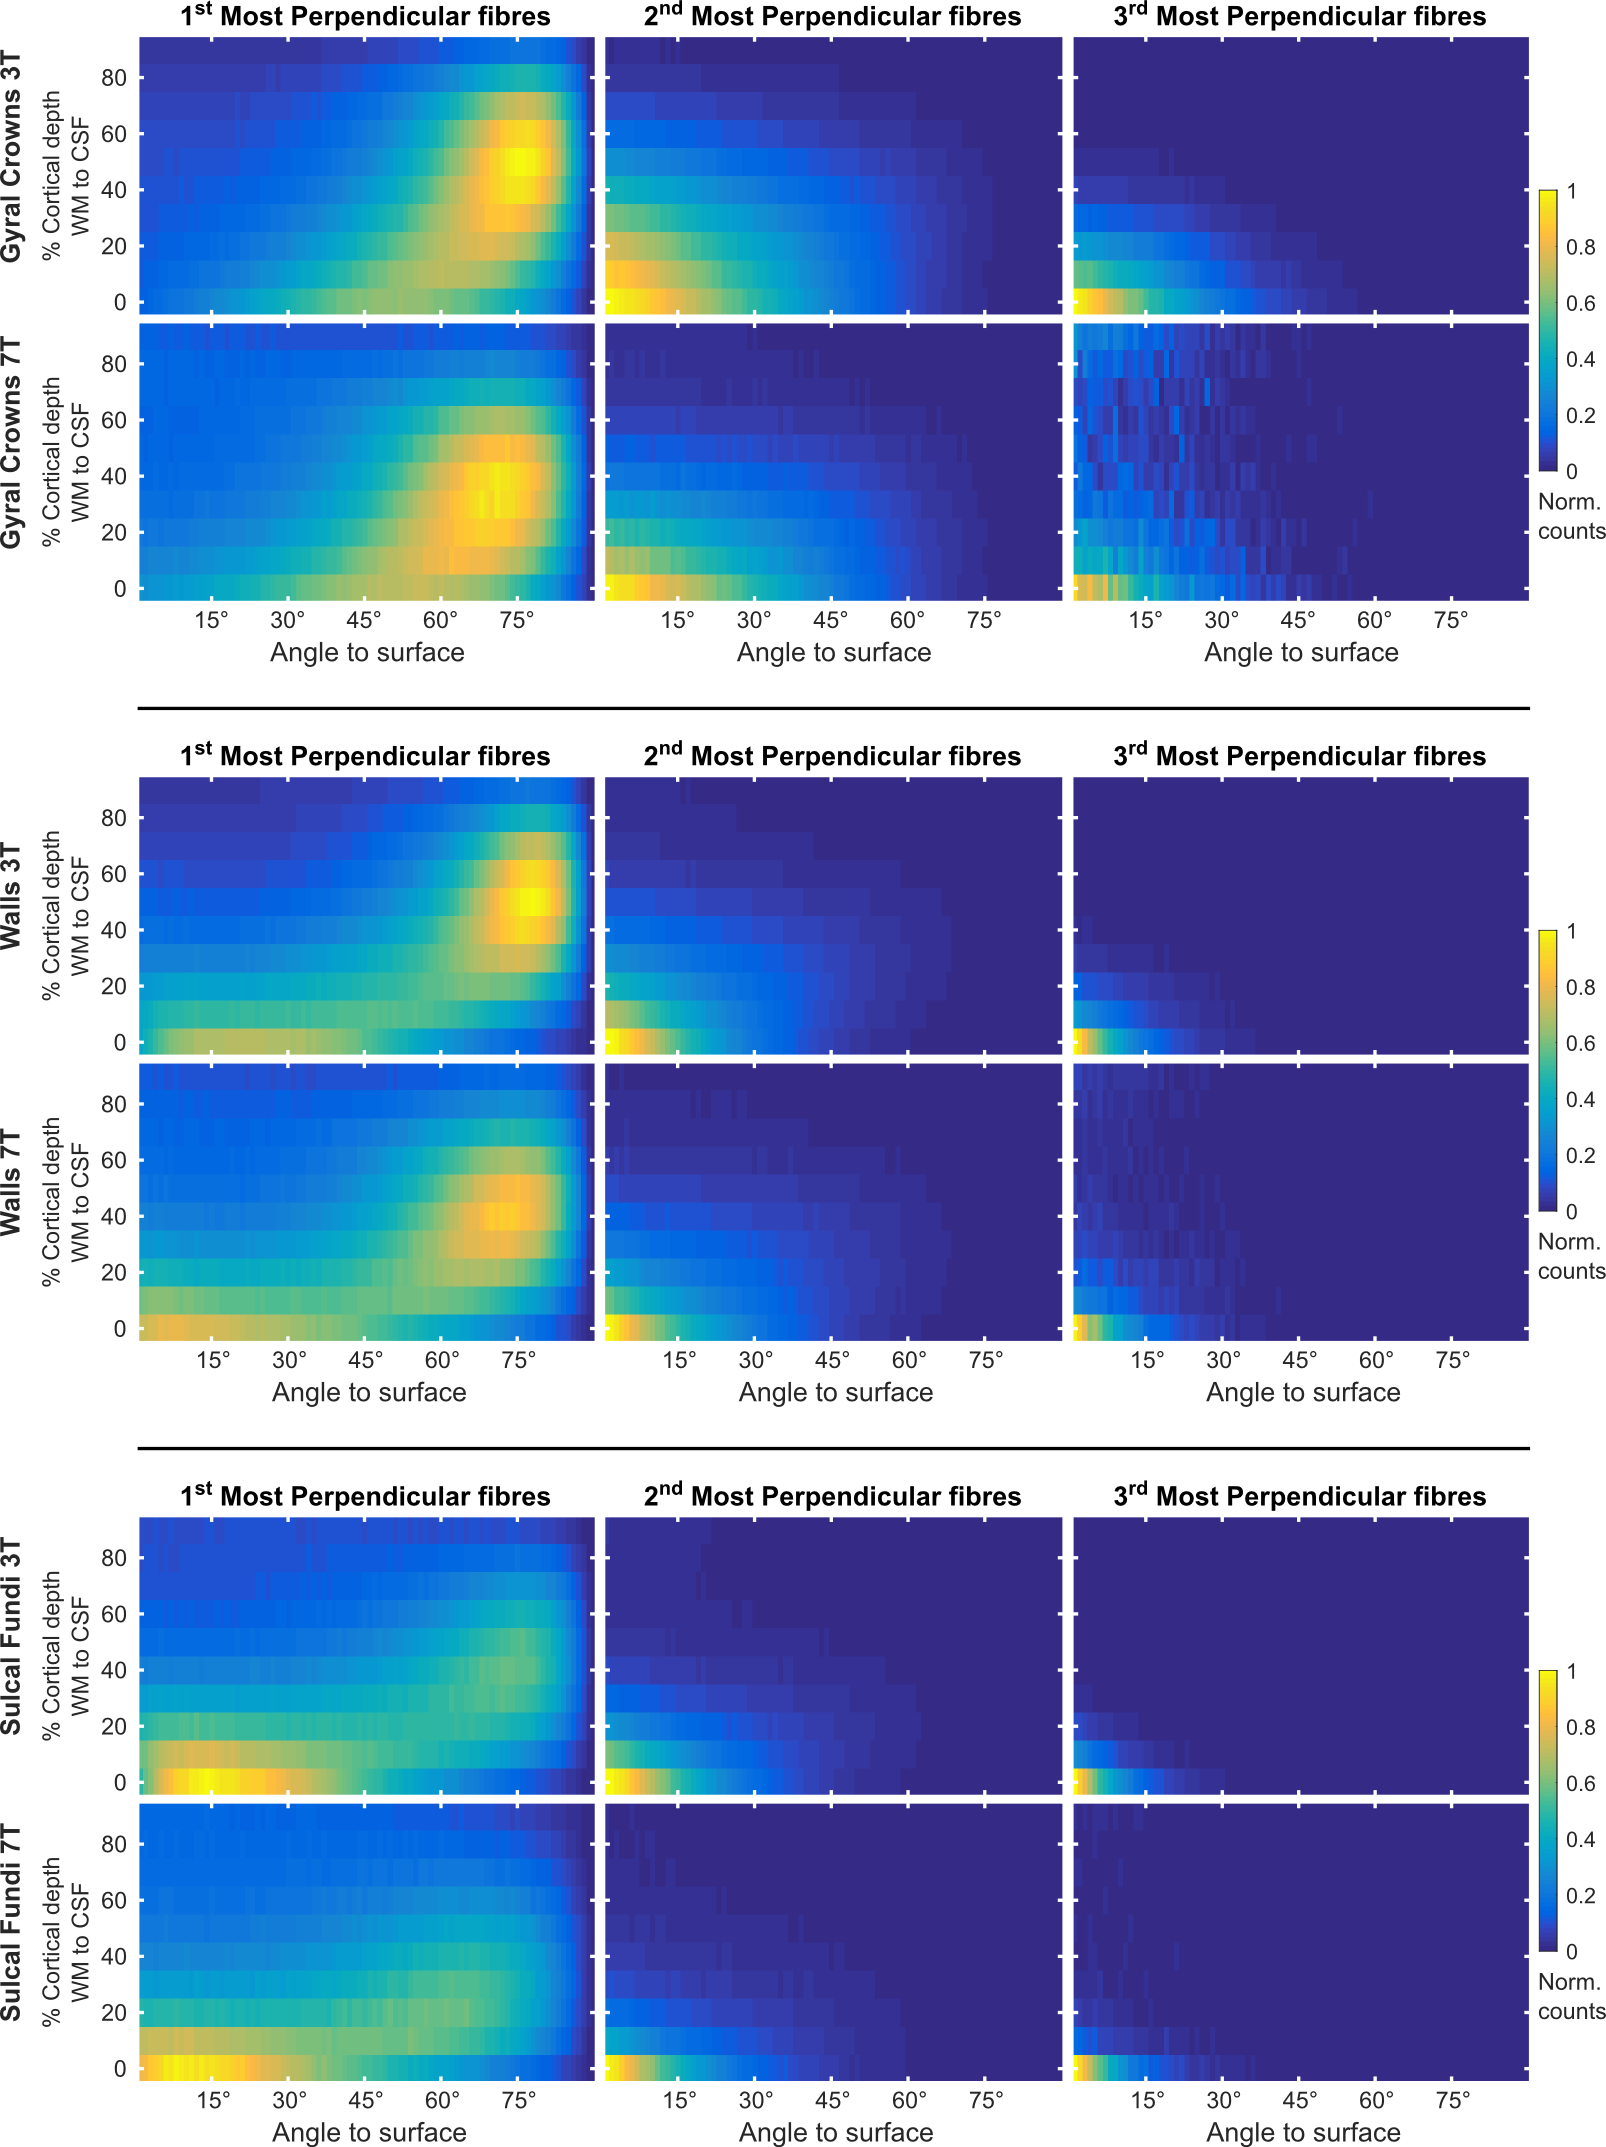
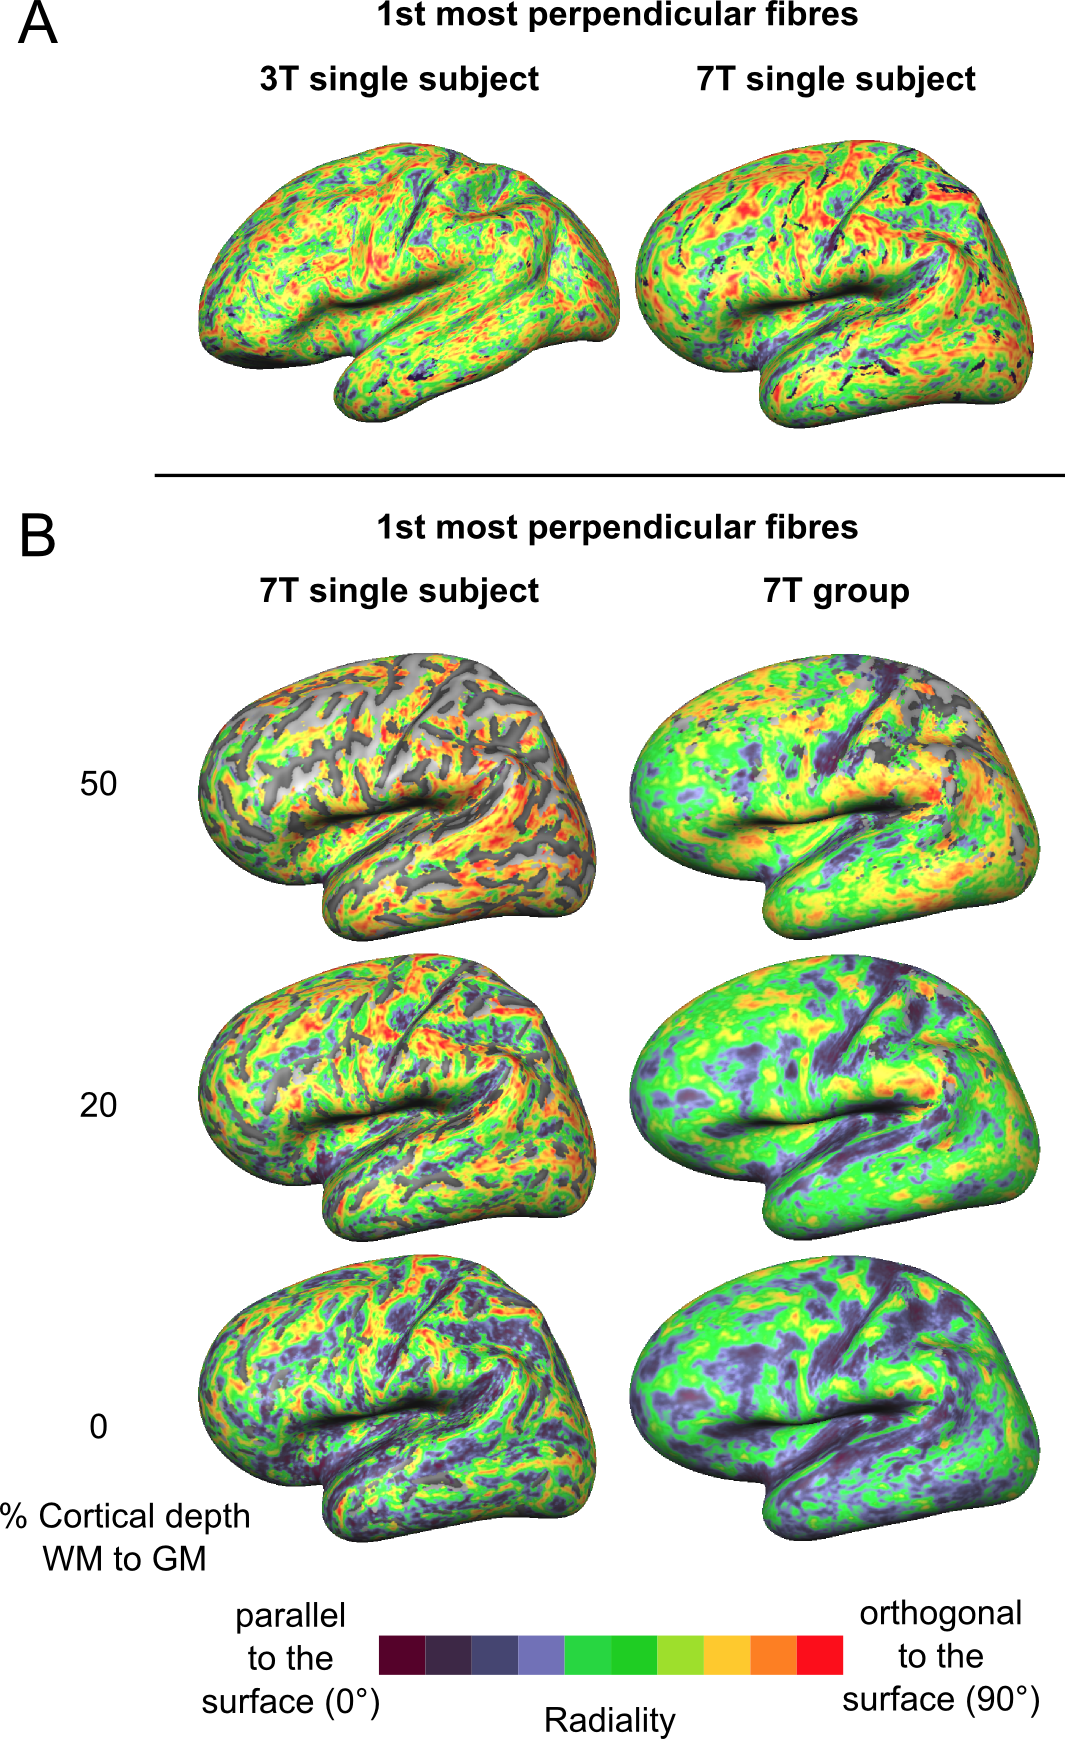
The proportion of vertices with radiality greater than 45 degrees in deep GM (Fig. 2) is larger in 7T data compared to 3T. This effect can be visualized in single subject maps by considering a cortical depth between 0 and 20% of the cortical thickness (Fig. 4A). Considering the cortical curvature (Fig. 3), more perpendicular fibers in deep gray matter can be found in walls, sulci and gyral crowns, indicating a reduced gyral bias in the 7T data. When considering the variation with cortical depth (Fig. 4B), the 7T data shows a slightly higher proportion of vertices with up to three fibers detected in the gyri (Fig. 3). These detected fiber crossings show shallow angles with the cortical surface in superficial cortical depths. Depending on the correspondence of macro-anatomical features (gyri and sulci), 7T group maps (Fig. 4B) respect single subject results.Conclusion
To investigate the organization of axonal trajectories within the cortex at different cortical depths requires high spatial resolution data, to reduce partial volume effects, and improved processing pipelines to fully leverage the information available in such data. Here, we present preliminary results from unique in-vivo 7T dMRI data, demonstrating the possibility of studying axonal trajectories within the cortex across depths. The increased resolution enables reduction of the gyral bias1 and detection of potentially interesting architectural features (e.g. parallel fibers in superficial cortical layers). Layer-specific analysis of cortical microstructural data may represent an additional source of information for the parcellation of cortical areas.Acknowledgements
This work was supported in part by NIH grants P41 EB015894, P30 NS076408, and the Human Connectome Project (U54 MH091657). F.D.M. and O.F.G. were supported by NWO VIDI grant 864-13-012.References
[1] Van Essen, D.C. et al., Mapping connections in humans and non-human primates: aspirations and challenges for diffusion imaging. in Diffusion MRI, 2nd edition (eds. Johansen-Berg, H. & Behrens, T.E.J.) 337–358 (Academic Press, 2014).
[2] Chen, H. et al., Coevolution of gyral folding and structural connection patterns in primate brains. Cereb. Cortex., 23 (2012), pp. 1208–1217.
[3] Nie, J. et al., Axonal fiber terminations concentrate on gyri. Cereb. Cortex., 22 (2012), pp. 2831–2839.
[4] Van Essen, W.T. et al., The projections from striate cortex (V1) to areas V2 and V3 in the macaque monkey: asymmetries, areal boundaries, and patchy connections. J. Comp. Neurol., 244 (1986), pp. 451–480.
[5] Leuze, C. et al., Layer-Specific Intracortical Connectivity Revealed with Diffusion MRI. Cerebral Cortex, 24 (2014), pp. 328-339.
[6] Aggarwal, M. et al., Probing region-specific microstructure of human cortical areas using high angular and spatial resolution diffusion MRI. Neuroimage 105 (2015), pp. 198-207.
[7] Sotiropoulos, S. et al., Fusion in diffusion MRI for improved fibre orientation estimation: An application to the 3T and 7T data of the Human Connectome Project. Neuroimage, 134 (2016), pp. 396-409.
[8] McNab, J.A. et al., Surface Based Analysis of Diffusion Orientation for Identifying Architectonic Domains in the In Vivo Human Cortex. Neuroimage, 69 (2013), pp. 87-100.
[9] Truong, T-K. et al., Cortical Depth Dependence of the Diffusion Anisotropy in the Human Cortical Gray Matter In Vivo. PLoS ONE 2014. http://dx.doi.org/10.1371/journal.pone.0091424.
[10] Kleinnijehuis, M. et al., Diffusion tensor characteristics of gyrencephaly using high resolution diffusion MRI in vivo at 7T. Neuroimage, 109 (2015), pp. 378-387.
[11] Vu, A.T. et al., High resolution whole brain diffusion imaging at 7 T for the Human Connectome Project. Neuroimage, 122 (2015), pp. 318-331.
[12] Kemper, V. et al., 9.4 Tesla imaging and high resolution data analysis strategies for mesoscale human functional MRI. Neuroimage (under review).
[13] Sotiropoulos, S. et al., Advances in diffusion MRI acquisition and processing in the Human Connectome Project. Neuroimage, 80 (2013), pp. 125-143.
[14] van de Moortele, P-F. et al., T1 weighted brain images at 7 Tesla unbiased for Proton Density, T2* contrast and RF coil receive B1 sensitivity with simultaneous vessel visualization. Neuroimage, 46 (2009), pp. 432-46.
[15] Greve, D. N., & Fischl, B., Accurate and robust brain image alignment using boundary-based registration. NeuroImage, 48 (2009), pp. 63–72.
[16] Jenkinson, M. et al., FSL. Neuroimage, 62 (2012), pp. 782-790.
[17] Goebel, R. et al., Analysis of functional image analysis contest (FIAC) data with brainvoyager QX: from single-subject to cortically aligned group general linear model analysis and self-organizing group independent component analysis. Hum. Brain Mapp. 27 (2009), pp. 392–401.
Figures