0716
Microscopic anisotropy in gray matter is evidence of myelinated axons but not dendrites? An in vivo study using diffusion MRI with variable shape of the b-tensor.1Clinical Sciences Lund, Medical Radiation Physics, Lund University, Lund, Sweden, 2Centre for Languages and Literature, Lund University, Lund, Sweden, 3Brigham and Women's Hospital, Harvard Medical School, Boston, MA, United States, 4Clinical Sciences Lund, Oncology and Pathology, Lund University, Lund, Sweden, 5Department of Psychology, Faculty of Social Science, Lund University, Lund, Sweden, 6Clinical Sciences Lund, Radiology, Lund University, Lund, Sweden
Synopsis
Microscopic anisotropy was measured in vivo using a novel tensor-valued diffusion encoding approach. In gray matter, the microscopic anisotropy was generally low, but its variation corresponded well to known differences in myelination. We hypothesize that myelinated axons cause microscopic diffusion anisotropy but that the contribution from dendrites is negligible. This hypothesis is supported by comparisons with independent myelin assessments using T1W/T2W-ratios, T2-mapping, and myelin stains from histology. We also demonstrate that the “neurite density index” detected by NODDI is less sensitive to these changes, and why NODDI cannot map the neurite density accurately.
Introduction
Gray matter (GM) contains anisotropic structures such as dendrites and axons (i.e. neurites)1. Diffusion MRI (dMRI) may enable non-invasive assessment of their density using methods such as neurite orientation dispersion and density imaging (NODDI)2 or the recently-developed CODIVIDE method for detection of microscopic anisotropy3. In a comparison, NODDI yielded higher estimates of the “neurite density” in gray matter than what was supported by the level of microscopic anisotropy detected by CODIVIDE3. Here, we investigate whether this result implies that diffusion anisotropy in GM mainly reflects the density of myelinated axons, and that the contribution from dendrites is negligible.Theory
Conventional dMRI is limited to so-called linear tensor encoding (LTE), which entangles microscopic anisotropy and orientation dispersion4. CODIVIDE solves this problem by employing a joint analysis of data acquired with LTE and spherical tensor encoding (STE) to estimate the tissue fraction with ‘stick’-like diffusion tensors (fTL), the free-water fraction (fFW), and the tissue mean diffusivity (dI;T). NODDI, which relies on LTE data alone, employs stronger model assumptions to estimate the neurite density (fIC), and the free-water fraction (fFW). Those assumptions enforce a connection between fIC and the tissue mean diffusivity, which is likely invalid3. As a result, the fIC may be biased whenever anisotropy and diffusivity vary independently.Methods
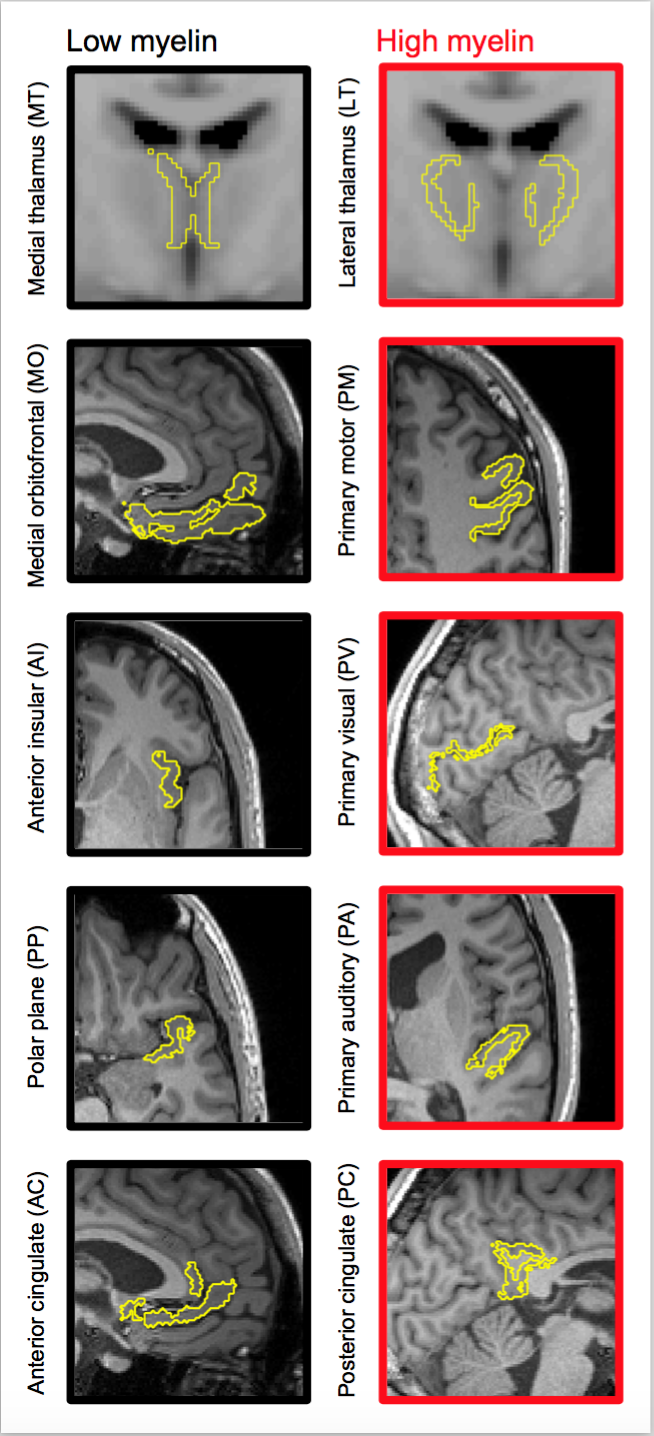
Data were acquired in 20 volunteers at a Siemens MAGNETOM Prisma 3T system using TR/TE = 4000/106 ms/ms, voxel size = 2×2×4 mm3, and b-values between 0.1 and 2.0 ms/μm2, distributed over up to 32 directions, using a prototype that enables both LTE and STE. Acquisition time was 9 minutes. T1-weighted images were also acquired. All participants gave written informed consent. CODIVIDE was fitted jointly to LTE and STE data, while NODDI was fitted to LTE data only, using the multidimensional diffusion MRI toolbox (https://github.com/markus-nilsson/md-dmri). Two thalamic regions featuring low and high myelin were defined from the medial thalamus (MT) and the lateral thalamus (LT), using the Harvard-Oxford subcortical atlas and an MNI-registered white matter (WM) probability map5 (Fig. 1). For visual comparison, we obtained a coronal brain section stained for myelin from the anterior thalamic level. Eight bilateral cortical ROIs with low or high myelin according to ref6 were also defined, using Freesurfer (Fig. 1). Values of fTL and fIC were obtained in each ROI. For comparison with another independent myelin assessment, we compared values of fTL and fIC obtained in ref3 to values of the myelin water fraction (MWF)7. To elucidate the performance of CODIVIDE and NODDI when microscopic anisotropy changes independently of mean diffusivity, we simulated LTE and STE data from a model system composed of randomly ordered linear (‘stick’) and isotropic (‘ball’) diffusion tensors with equal mean diffusivity. The anisotropy of the system was varied by changing the fraction of linear tensors between 0 and 1, keeping the mean diffusivity constant.Results
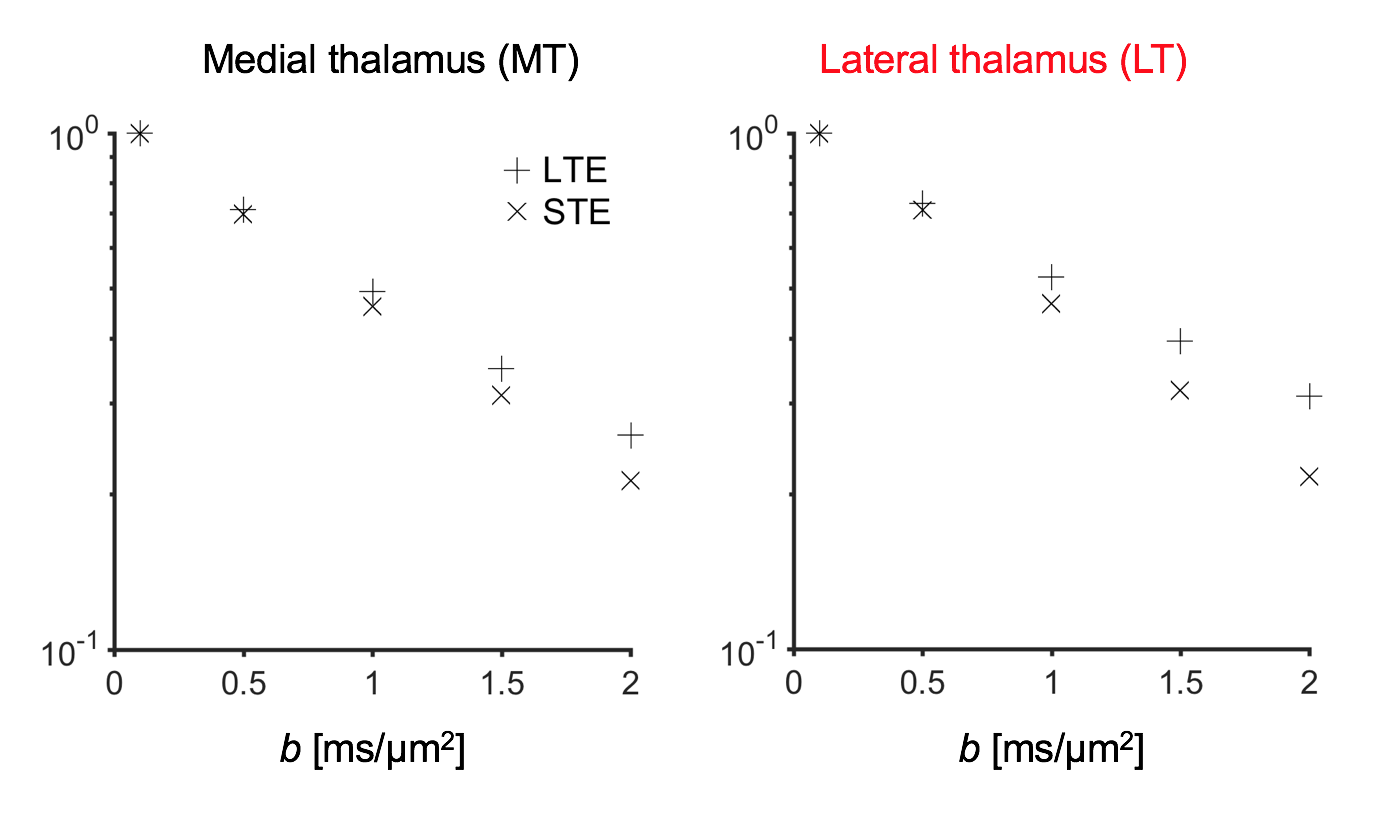
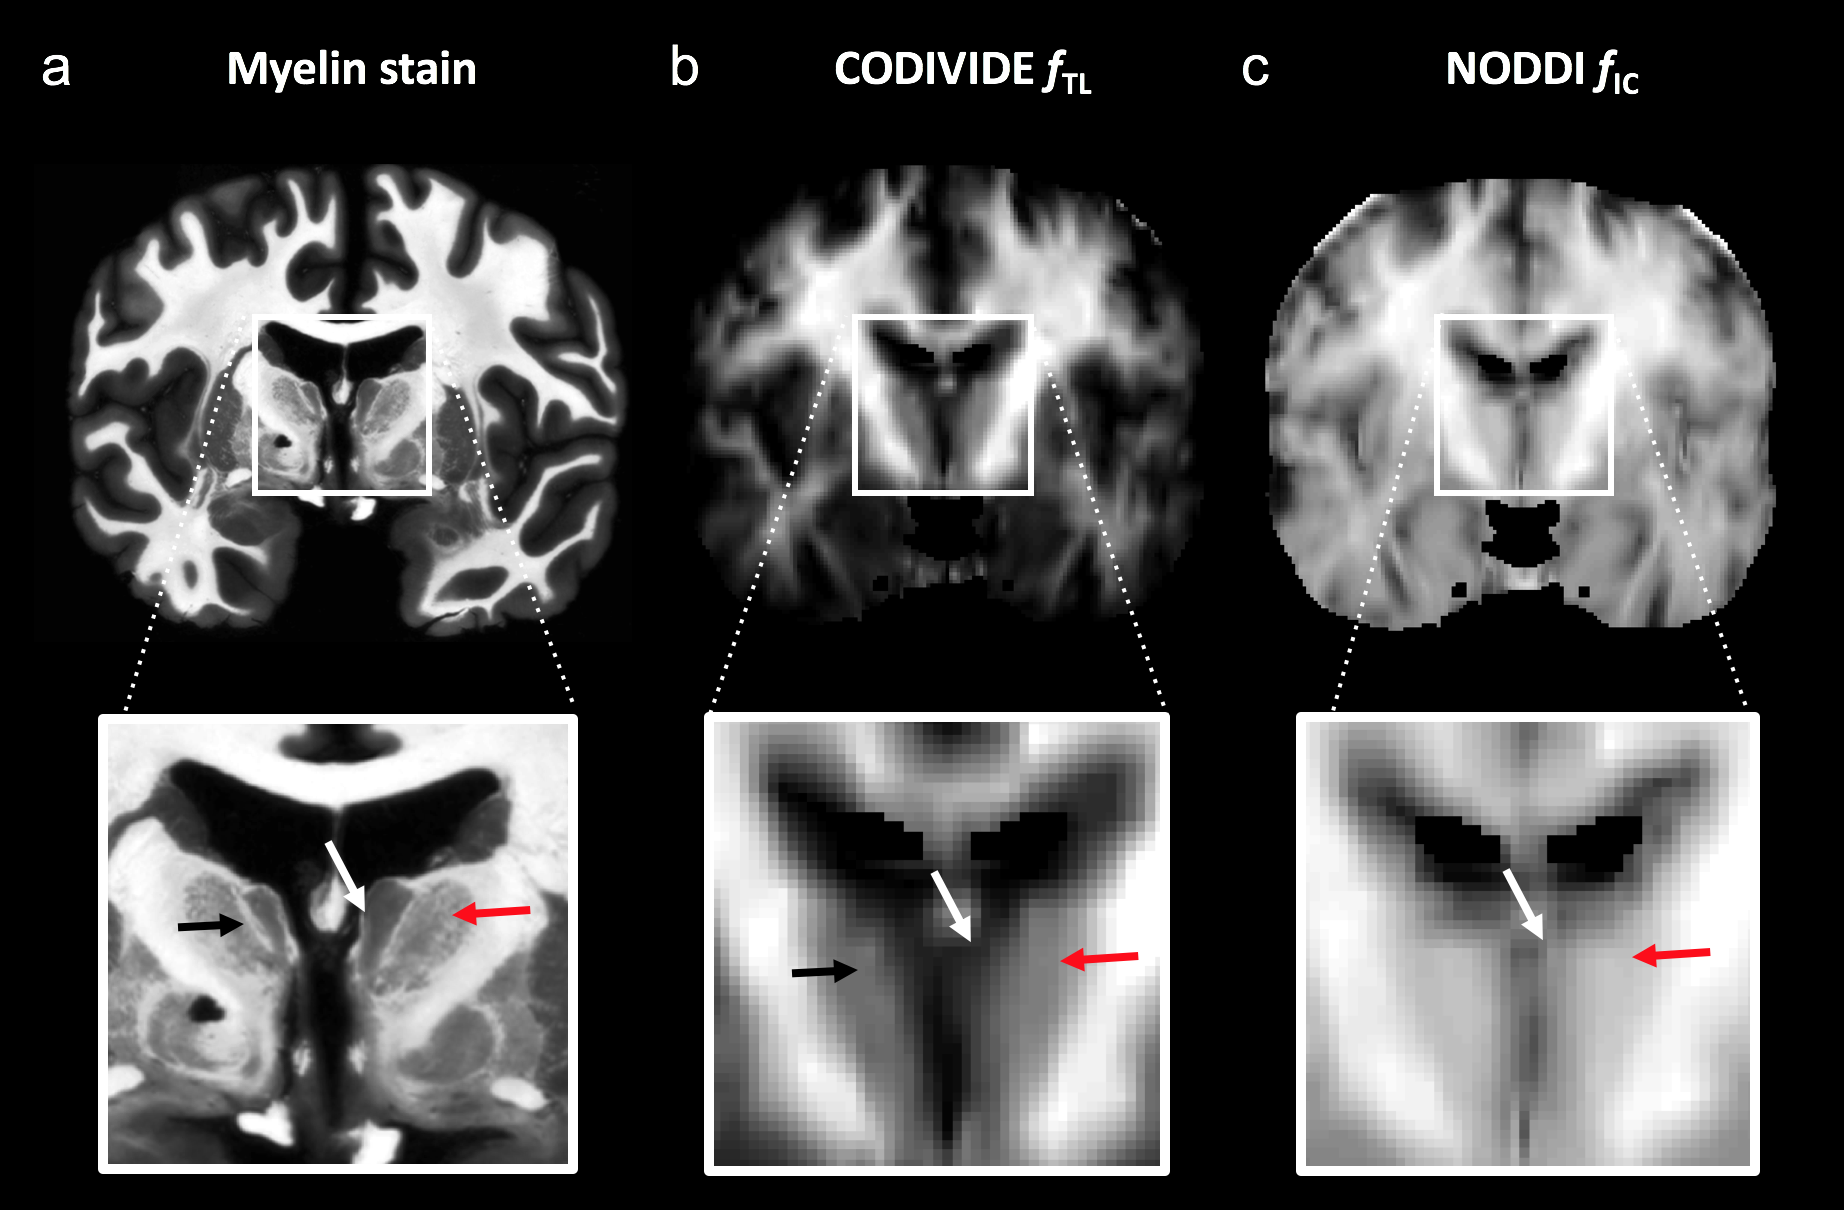
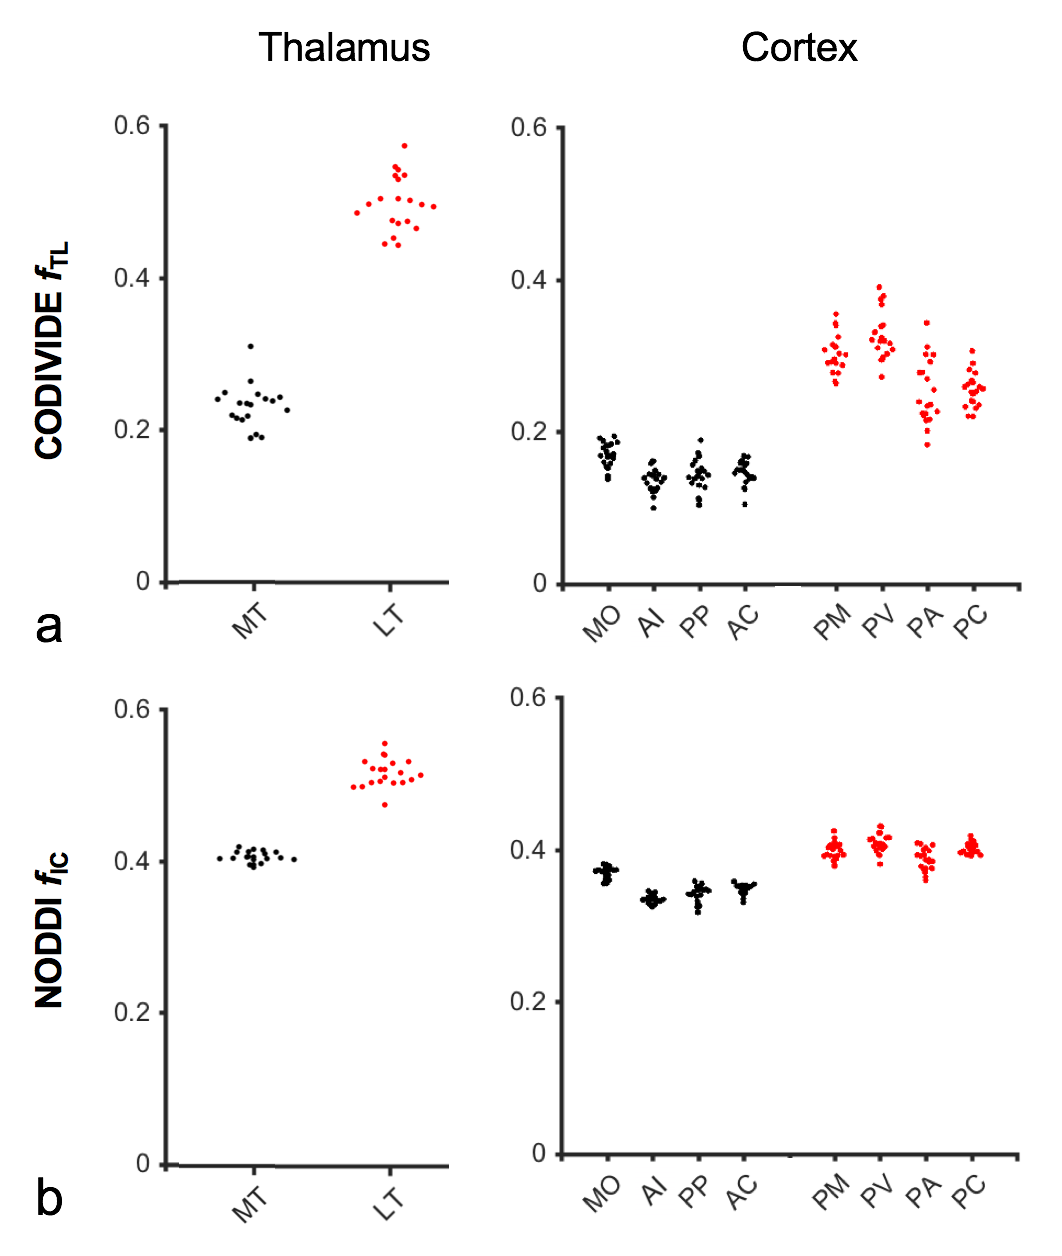
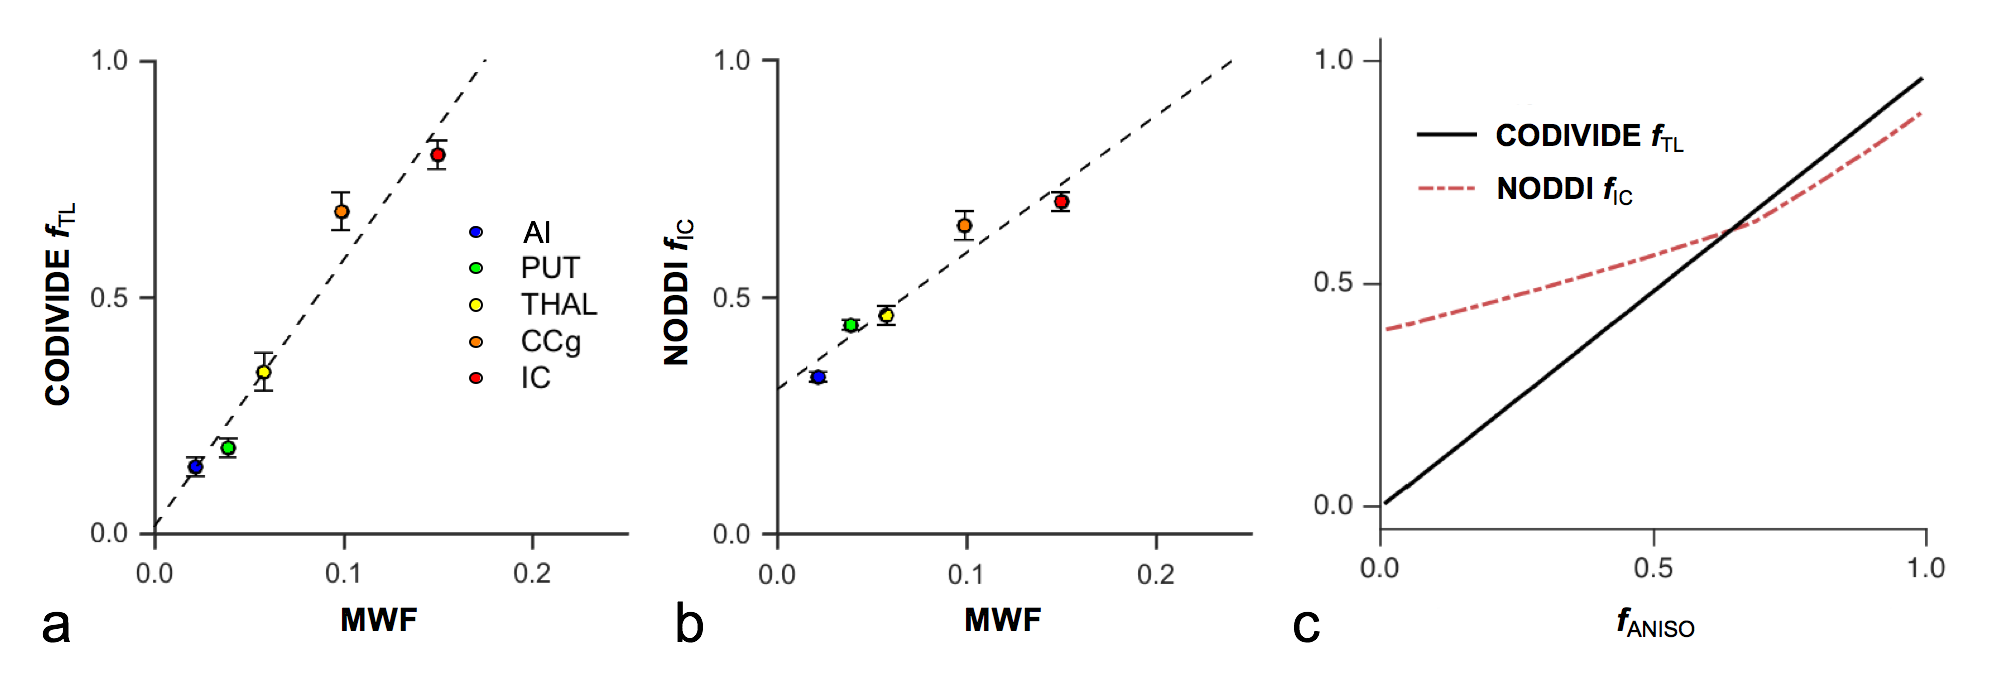
Figure 2 shows thalamic LTE and STE signal-versus-b curves. The divergence of the curves at high b-values is proportional to the amount of microscopic anisotropy8. Figure 3 shows myelin staining, and maps of microscopic anisotropy from CODIVIDE (fTL) and NODDI (fIC,). The medial thalamus had low myelin (white arrows), while the lateral had high myelin (red arrows). This difference was reflected in the fTL map, while the fIC map exhibited a more homogeneous contrast. Figure 4 shows that low myelin regions (black) were distinguishable from high myelin regions (red) in both parameters, but fIC exhibited higher values and less heterogeneity, compared to fTL. In the linear regression (Fig. 5a and b), both fTL and fIC correlated strongly with the MWF, but intercepts and slopes differed. The simulation (Fig. 5c) revealed a positive bias in estimated microscopic anisotropy for NODDI but not for CODIVIDE.Discussion and conclusions
CODIVIDE detected a microscopically anisotropic signal fraction that corresponded well to known myelination variations. The regression in Fig. 5a showed an intercept of zero for CODIVIDE, which suggests that myelin is necessary for microscopic diffusion anisotropy. Also, the fTL values were lower than estimated total neurite volumes1. We interpret this as evidence for a low dendritic contribution to diffusion anisotropy, potentially due to short segment lengths or fast exchange9. The NODDI fIC parameter also exhibited myelin sensitivity in GM. However, its model constraints induced a positive bias in low anisotropy regions and limited NODDI’s specificity for anisotropy3 (Fig. 5). In conclusion, we suggest that microscopic diffusion anisotropy is a proxy for myelinated axons, and can be accurately mapped using a variable shape of the b-tensor.Acknowledgements
No acknowledgement found.References
1. Bennet. Virginia Woolf and Neuropsychiatry. Springer Netherlands. 2016.
2. Zhang et al. NODDI: practical in vivo neurite orientation dispersion and density imaging of the human brain. NeuroImage. 2012;61(4):1000-1016.
3. Lampinen et al. Neurite density imaging versus imaging of microscopic anisotropy in diffusion MRI: A model comparison using spherical tensor encoding. NeuroImage. 2017;147:517-531
4. Westin et al. Q-space trajectory imaging for multidimensional diffusion MRI of the human brain. NeuroImage. 2016;135:345-362.
5. Fonov et al. Unbiased average age-appropriate atlases for pediatric studies. NeuroImage. 2011;54(1):313-327.
6. Glasser and van Essen. Mapping human cortical areas in vivo based on myelin content as revealed by T1-and T2-weighted MRI. The Journal of Neuroscience. 2011;31(32):11597-11616.
7. Whittall et al. In vivo measurement of T2 distributions and water contents in normal human brain. Magnetic Resonance in Medicine. 1997;37(1):34-43.
8. Lasic et al. Microanisotropy imaging: quantification of microscopic diffusion anisotropy and orientational order parameter by diffusion MRI with magic-angle spinning of the q-vector. Frontiers in Physics. 2014;2:11.
9. Inoue et al. Volume-sensitive chloride channels in mouse cortical neurons: characterization and role in volume regulation. European Journal of Neuroscience. 2005;21(6):1648-1658.
Figures