0715
Characterisation of cerebellar microstructure with two-compartment Spherical Mean Technique1Department of Physics, University of Milan, Milan, Italy, 2Brain Connectivity Center, C. Mondino National Neurological Institute, Pavia, Italy, 3Department of Physics, University of Pavia, Pavia, Italy, 4Department of Electrical, Computer and Biomedical Engineering, University of Pavia, Pavia, Italy, 5Department of Brain and Behavioral Sciences, University of Pavia, Pavia, Italy, 6Queen Square MS Centre, Department of Neuroinflammation, UCL Institute of Neurology, University College London, London, United Kingdom, 7Brain MRI 3T Mondino Research Center, C. Mondino National Neurological Institute, Pavia, Italy
Synopsis
Cerebrum microstructure has been extensively investigated with diffusion-weighted MRI, but little attention has been dedicated to the microstructural characterisation of the cerebellum.
We considered an anatomical parcellation of the cerebellum and fitted a multi-compartment model to diffusion data exploiting the spherical mean technique, which provides parametric maps unconfounded by the underlying fibre orientation distribution. For each region we report average values for multi-compartment parameters (e.g. intra-neurite volume fraction and intrinsic diffusivity) and diffusion tensor metrics.
Multi-compartment metrics more specific to microstructure provide information complementary to diffusion tensor metrics in the cerebellum, thus giving new insights about microstructural correlations between regions.
Purpose
Diffusion-weighted MRI (DW-MRI) is a valid tool for in vivo investigation of neural tissue microstructure. Over the years a lot of attention has been dedicated to study the cerebrum. However, more recently, attention has also turned onto the cerebellum because of new evidences of its key role in complex functions and pathology1.
The most widely used DW-MRI signal model is the diffusion tensor (DT), which has proven to be sensitive but not specific to microstructure and inadequate, for example, in regions of complex structure. To overcome DT limitations, new techniques, models and metrics have been recently proposed and applied to study the brain2. Amongst these, the spherical mean technique3 (SMT) is particularly appealing because it can be applied to complex diffusion signal models making no a priori assumptions about the underlying fibre orientation distribution (FOD).
The aim of the present work is to characterize cerebellar microstructure using the SMT in its recently proposed two-compartment version4, considering a validated anatomical parcellation.
Methods
The study was carried out on high-quality images of 15 subjects from the Human Connectome Project5, 100 Subjects Data Release with minimal pre-processing pipeline (diffusion data: 1.25mm isotropic resolution, b=1000,2000,3000s/mm2, 90 isotropically distributed directions for each shell; anatomical 3DT1-weighted data: 1.25mm isotropic resolution).
As our interest focused on the cerebellum we exploited SPM126 and the SUIT toolbox7 to isolate this structure and to perform its segmentation on the 3DT1-weighted images co-registered to diffusion data. Images were then registered to the SUIT template and the inverse transformation was applied to the standard SUIT cerebellar atlas8 and to the probabilistic atlas of cerebellar peduncles9 (50% threshold) to bring them to native space.
We applied the freely available two-compartment SMT implementation to DW-MRI data, obtaining voxel-wise estimates of intra-neurite volume fraction (vint), the intrinsic diffusivity (λ), the transverse and mean extra-neurite diffusivity. Unlike other models10 where a fixed λ is assumed across the brain, here it is directly estimated from data.
Region-specific average values of SMT/DTI metrics were obtained within cerebellar cortical regions, cerebellar peduncles and deep cerebellar nuclei11 derived from SUIT.
Lastly, maps were registered to SUIT standard space and concatenated across subjects. We created a between-region cross-correlation matrix for each microstructural feature to assess whether between-region microstructural relationships are repeatable across subjects.
The same procedure was followed also for classical DT metrics for comparison.
Results and discussion
Figure 1 reports maps of computed metrics for a single subject. It is noteworthy that λ exhibits regional variation even within the same tissue. Hence, models where a constant λ is assumed may be not appropriate for cerebellar applications.
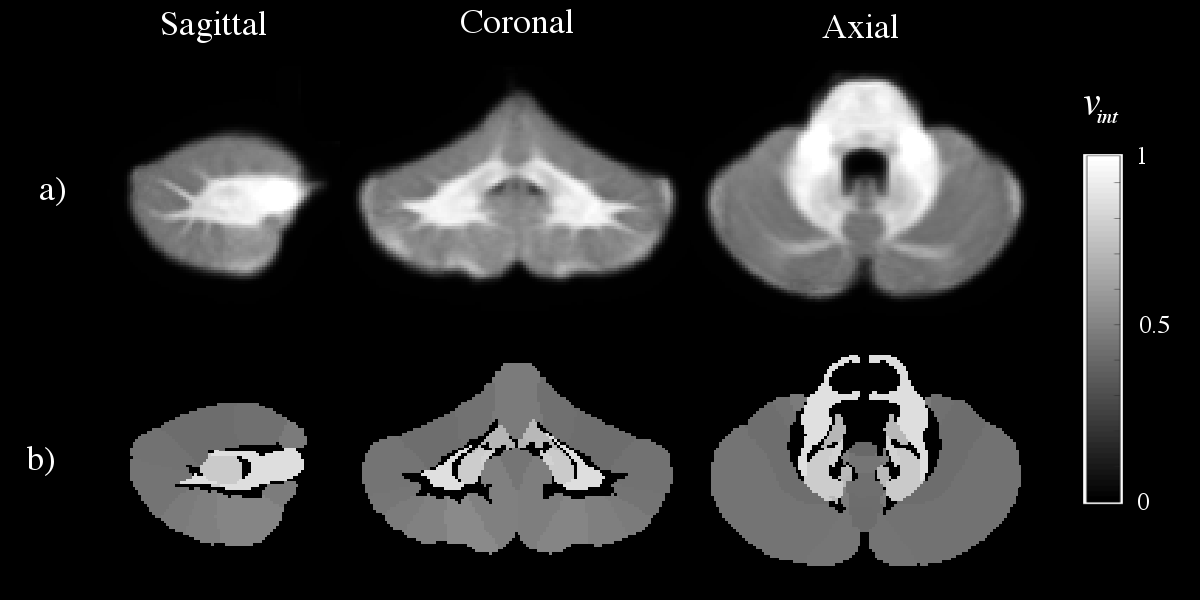
Boxplots in figure 2 show average vint, λ and fractional anisotropy (FA) in each region across subjects and corresponding maps of the average vint are displayed in figure 3. Considering grey matter vint and FA (figure 2), both metrics show no significant difference between left and right cerebellar regions. However, unlike FA, vint suggests lower neurite density of the vermis as compared to the two cerebellar hemispheres. Furthermore, the same comparison in the cerebellar peduncles highlights greater differences between superior cerebellar peduncles (SCPs) and inferior cerebellar peduncles (ICPs) in terms of vint. SCPs, which project their fibres towards the cerebral cortex, show higher vint than ICPs. Since ICPs receive inputs from the spinal cord and the medulla oblongata, this finding suggests that these neurite populations may have different microstructural properties, such as different neurite packing, average fibre diameter or myelination level.
Figure 4 shows cross-correlation matrices for vint, λ and FA (75% absolute threshold). SMT metrics cross-correlation matrices underline new possible microstructural relationships among structures, unseen with FA, which are repeatable across subjects. A striking difference, for example, is the correlation between the dentate and interposed nuclei, respectively rows 29-30 (L-R) and 31-32, very strong for vint and not detectable for FA. Moreover, the known strong structural connection between DCNs and cerebellar peduncles12 emerges from the cross-correlation matrix of vint, suggesting that functionally related structures may also share microstructural features.
Conclusions
In this work we have investigated for the first time the application of a recent, advanced diffusion method (the two-compartment SMT) to characterise the cerebellar microstructure. Unlike conventional DT metrics, SMT-derived microstructural parameters are unconfounded by the underlying FOD and thus provide complementary and more specific information. We found that microstructural metrics can give a deeper insight into cerebellar features with respect to DT metrics. We aim to increase the number of subjects for statistical significance and to perform a comparison with anatomical data for model validation.Acknowledgements
Data were provided by the Human Connectome Project, WU-Minn Consortium (Principal Investigators: David Van Essen and Kamil Ugurbil; 1U54MH091657) funded by the 16 NIH Institutes and Centers that support the NIH Blueprint for Neuroscience Research; and by the McDonnell Center for Systems Neuroscience at Washington University.
Horizon2020-EU.3.1 CDS-QUAMRI (ref: 634541).
Serena M. Valle for valuable consultancy and help in the production of the present abstract.
References
1. D'Angelo E, Casali S. Seeking a unified framework for cerebellar function and dysfunction: from circuit operations to cognition. Frontiers in neural circuits 6 (2013): 116.
2. Ferizi U, Schneider T, Panagiotaki E, et al. A Ranking of Diffusion MRI Compartment Models with In Vivo Human Brain Data. Magnetic Resonance in Medicine. 72:1785-1792 (2014).
3. Kaden E, Kruggel F, Alexander D C. Quantitative mapping of the per-axon diffusion coefficients in brain white matter. Magnetic resonance in medicine. 75:1752–1763 (2016).
4. Kaden E, Kelm N D, Carson R P, et al. Multi-compartment microscopic diffusion imaging. NeuroImage. 139 (2016): 346–359.
5. Van Essen D C, Smith S M, Barch D M, et al. for the WU-Minn HCP Consortium. The WU-Minn Human Connectome Project: An overview. NeuroImage. 80 (2013):62-79.
6. Statistical Parametric Mapping, http://www.fil.ion.ucl.ac.uk/spm/
7. Diedrichsen J. A spatially unbiased atlas template of the human cerebellum. NeuroImage. 33.1 (2016): 127-138.
8. Diedrichsen J, Balsters J H, Flavell J, et al. (2009). A probabilistic atlas of the human cerebellum. NeuroImage. 46.1 (2009): 39-46.
9. Van Baarsen K M, Kleinnijenhuis M, Jbabdi S, et al. A probabilistic atlas of the cerebellar white matter. NeuroImage. 124 (2016): 724-732.
10. Zhang H, Schneider T, Wheeler-Kingshott C A M, et al. NODDI: practical in vivo neurite orientation dispersion and density imaging of the human brain. NeuroImage. 61.4 (2012): 1000-1016.
11. Diedrichsen J, Maderwald S, Kuper M, et al. Imaging the deep cerebellar nuclei: A probabilistic atlas and normalization procedure. NeuroImage. 54.3 (2011): 1786-1794.
12. Witter L, De Zeeuw C I. Regional functionality of the cerebellum. Current opinion in neurobiology. 33 (2015): 150-155.
Figures
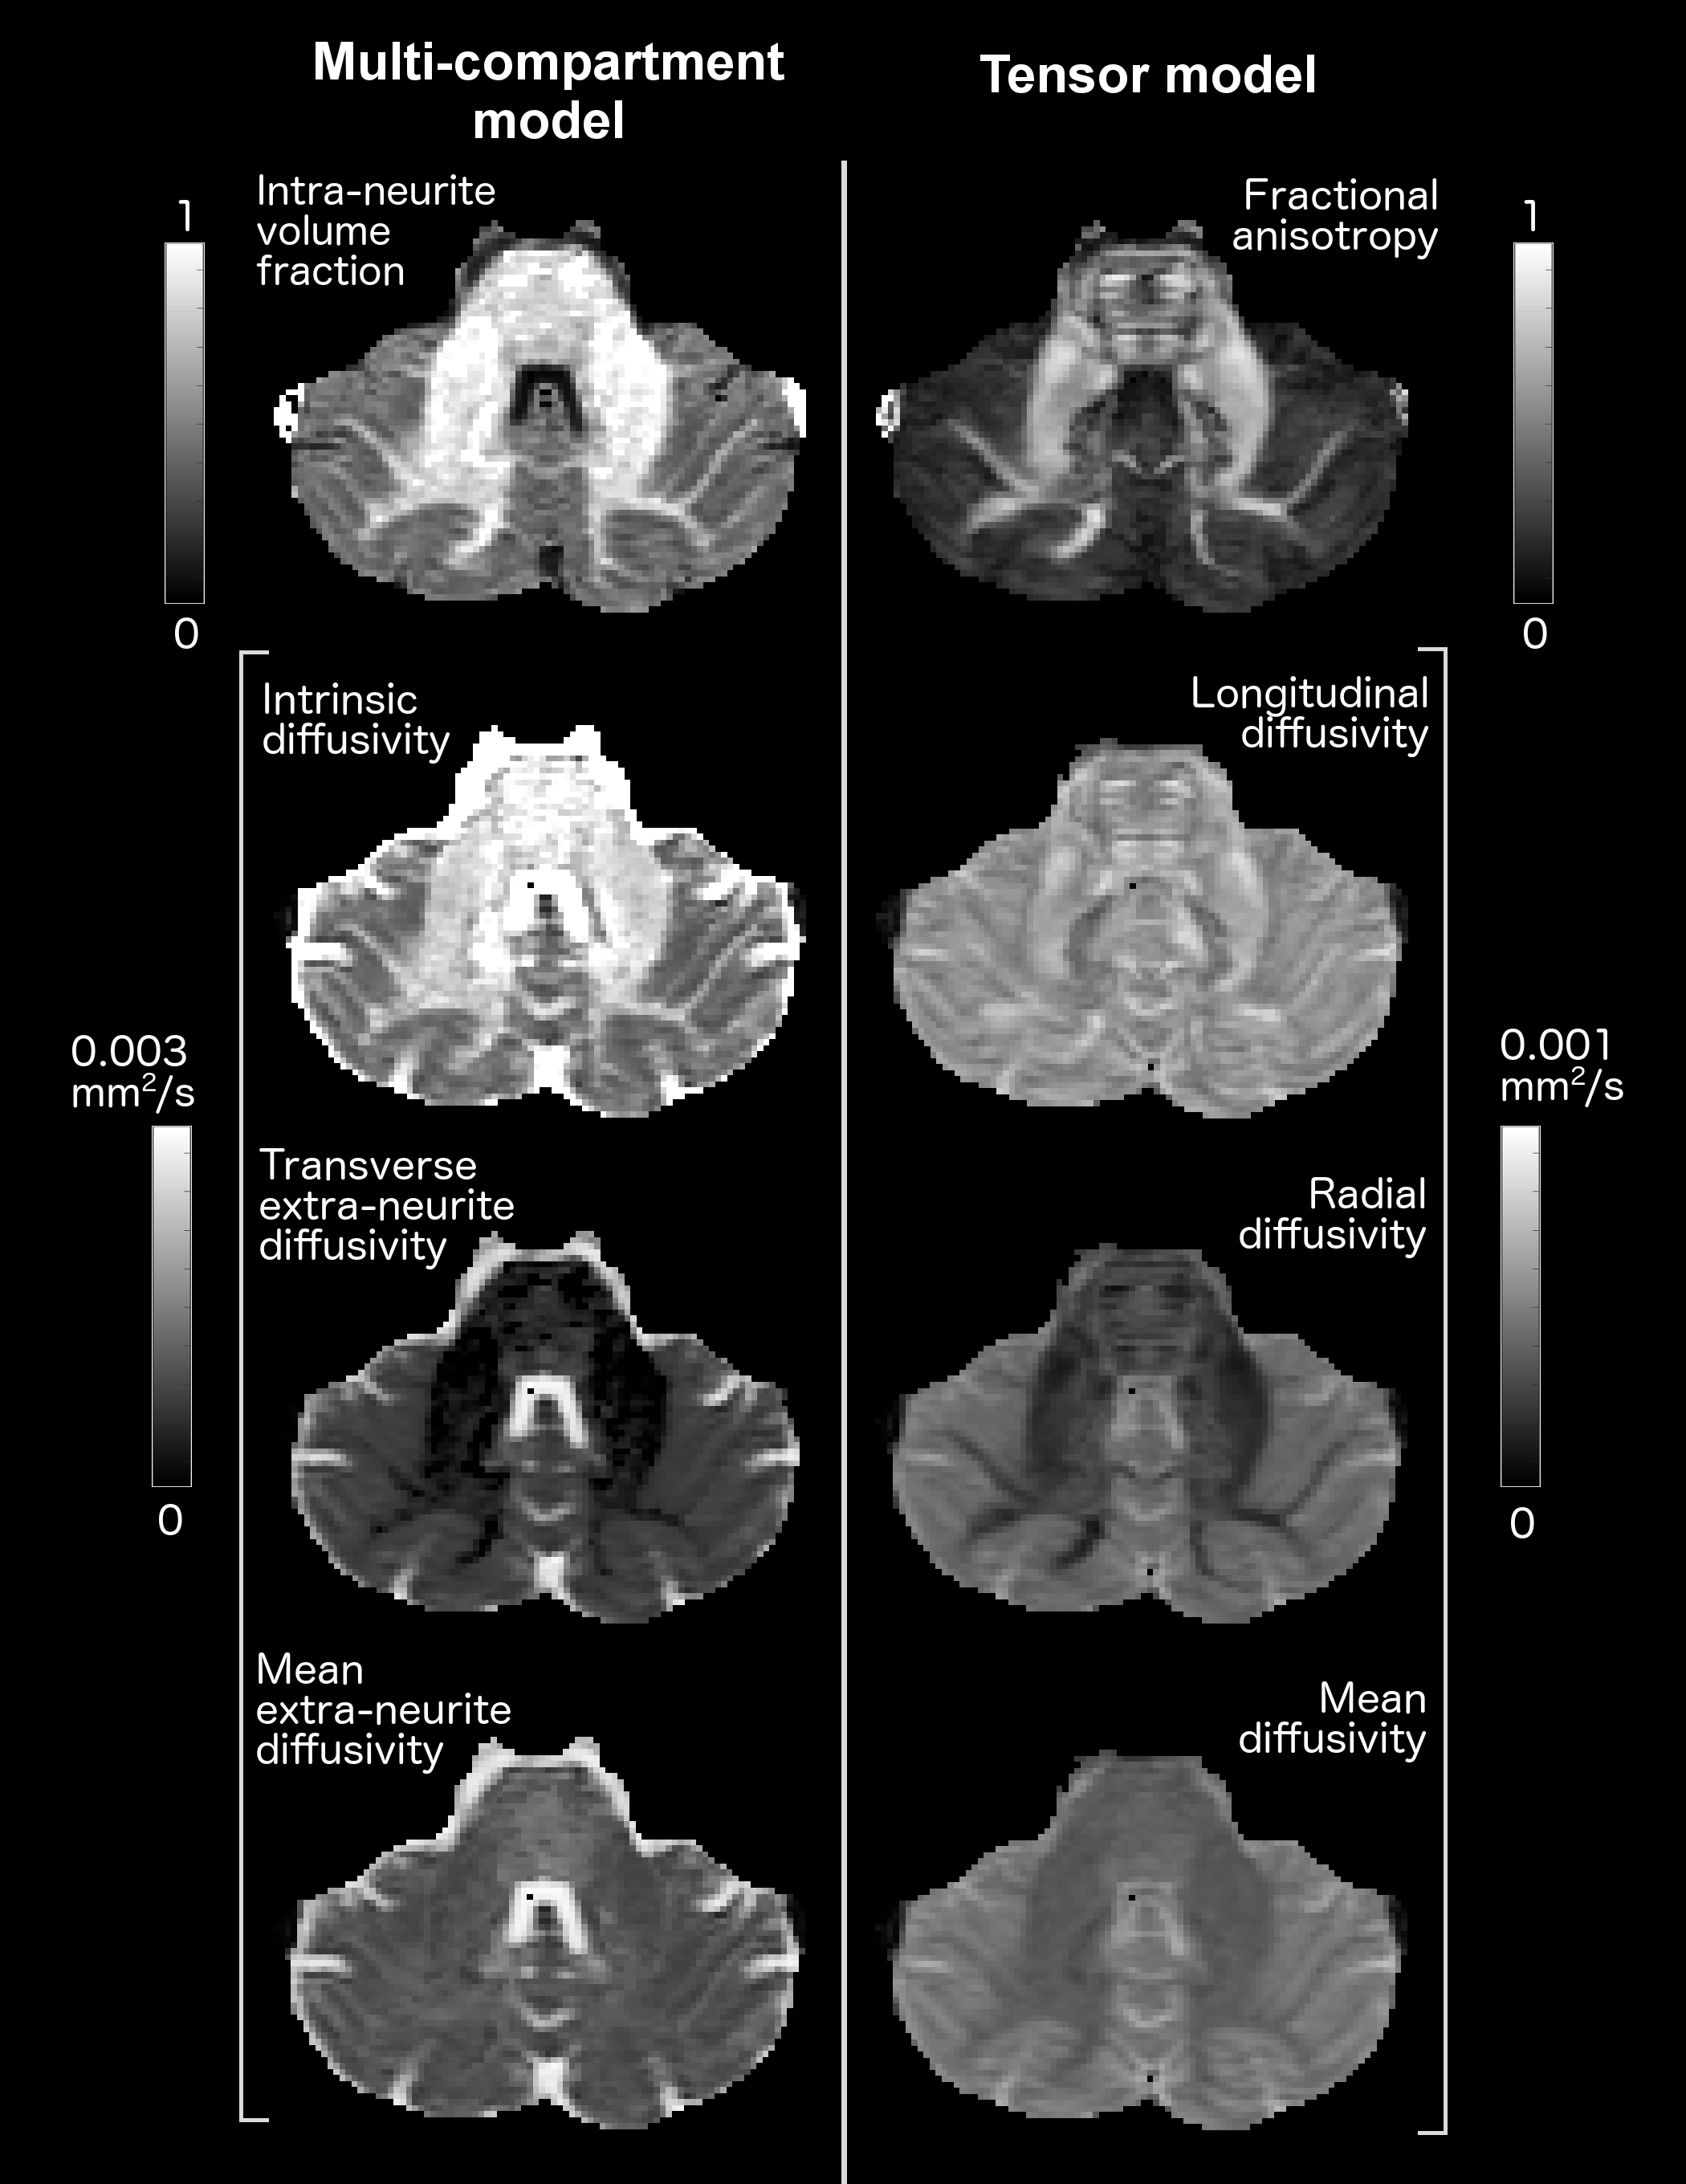
Left column, from top to bottom: single subject maps of intra-neurite volume fraction, intrinsic diffusivity, transverse extra-neurite diffusivity and mean extra-neurite diffusivity obtained with two-compartment spherical mean technique.
Right column, from top to bottom: single subject maps of fractional anisotropy, longitudinal diffusivity, radial diffusivity and mean diffusivity obtained with diffusion tensor model.
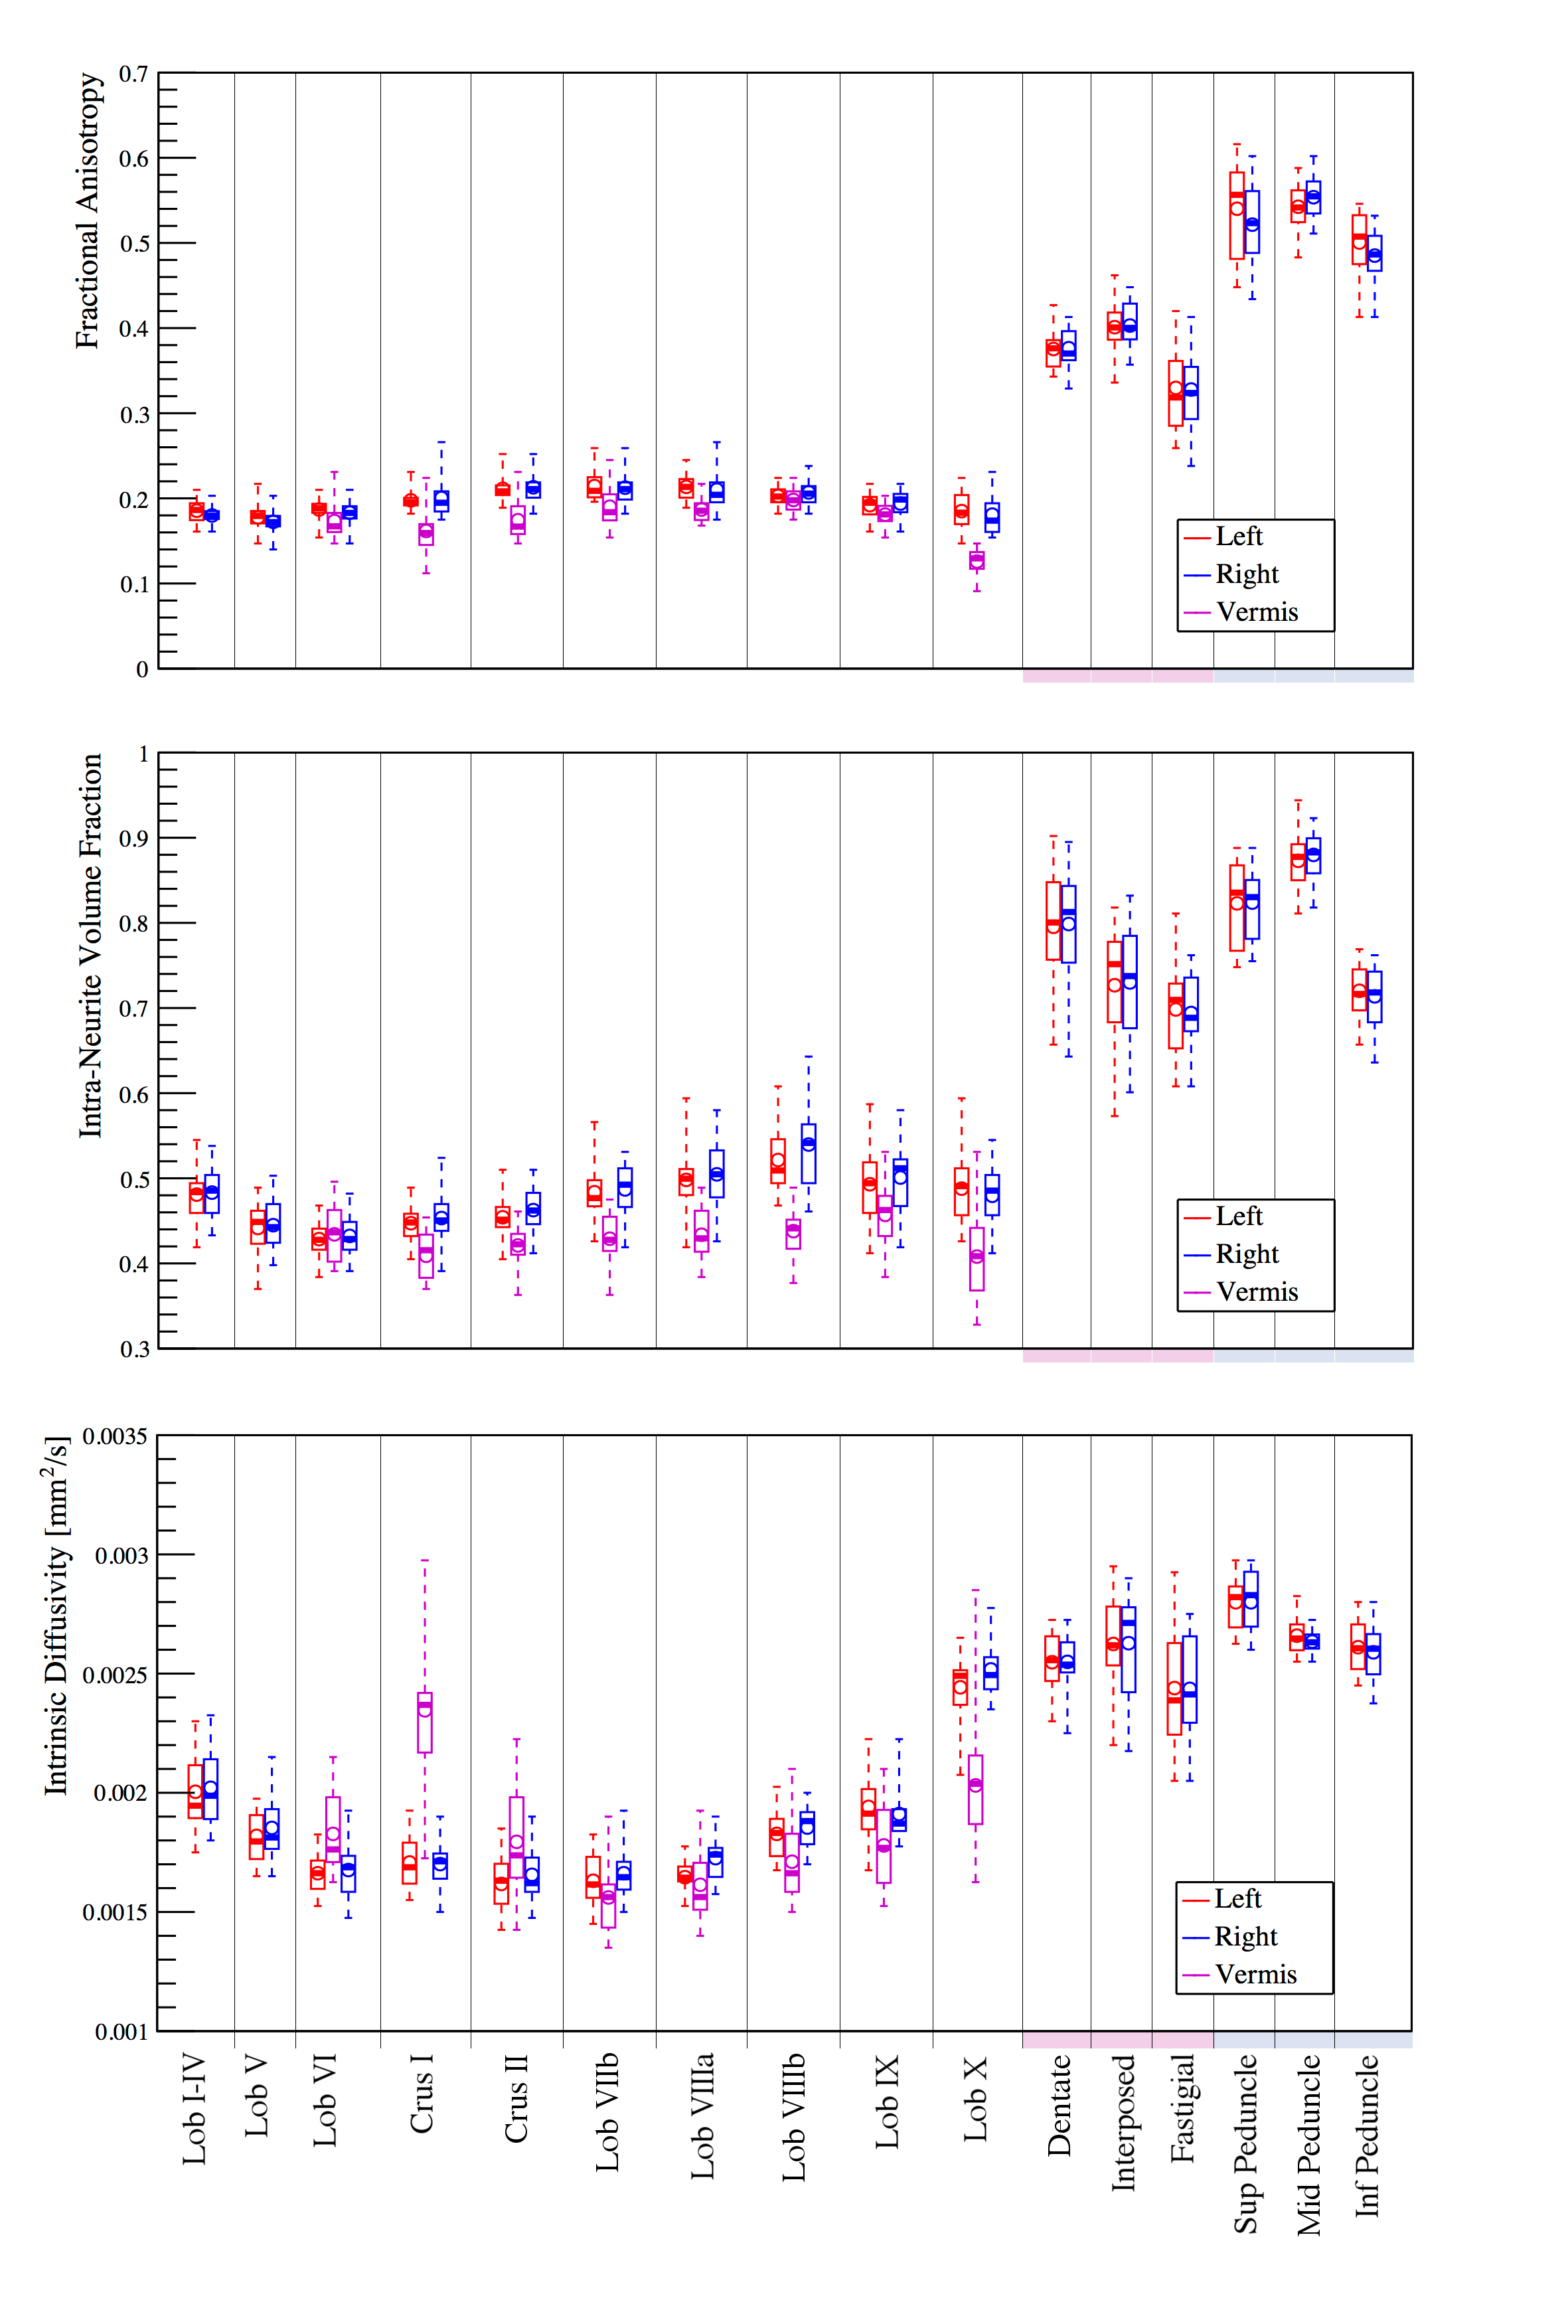
From top to bottom: boxplots of the mean fractional anisotropy, intra-neurite volume fraction and intrinsic diffusivity in anatomical parcellation regions of the cerebellum.
Regions from 1 to 28: cerebellar cortex (grey matter); from 29 to 34: deep cerebellar nuclei (deep grey matter); from 35 to 40: cerebellar peduncles (white matter).
Deep cerebellar nuclei are pink marked and cerebellar peduncles are light-blue marked.
Red: left hemisphere regions; blue: right hemisphere regions; purple: vermis regions.
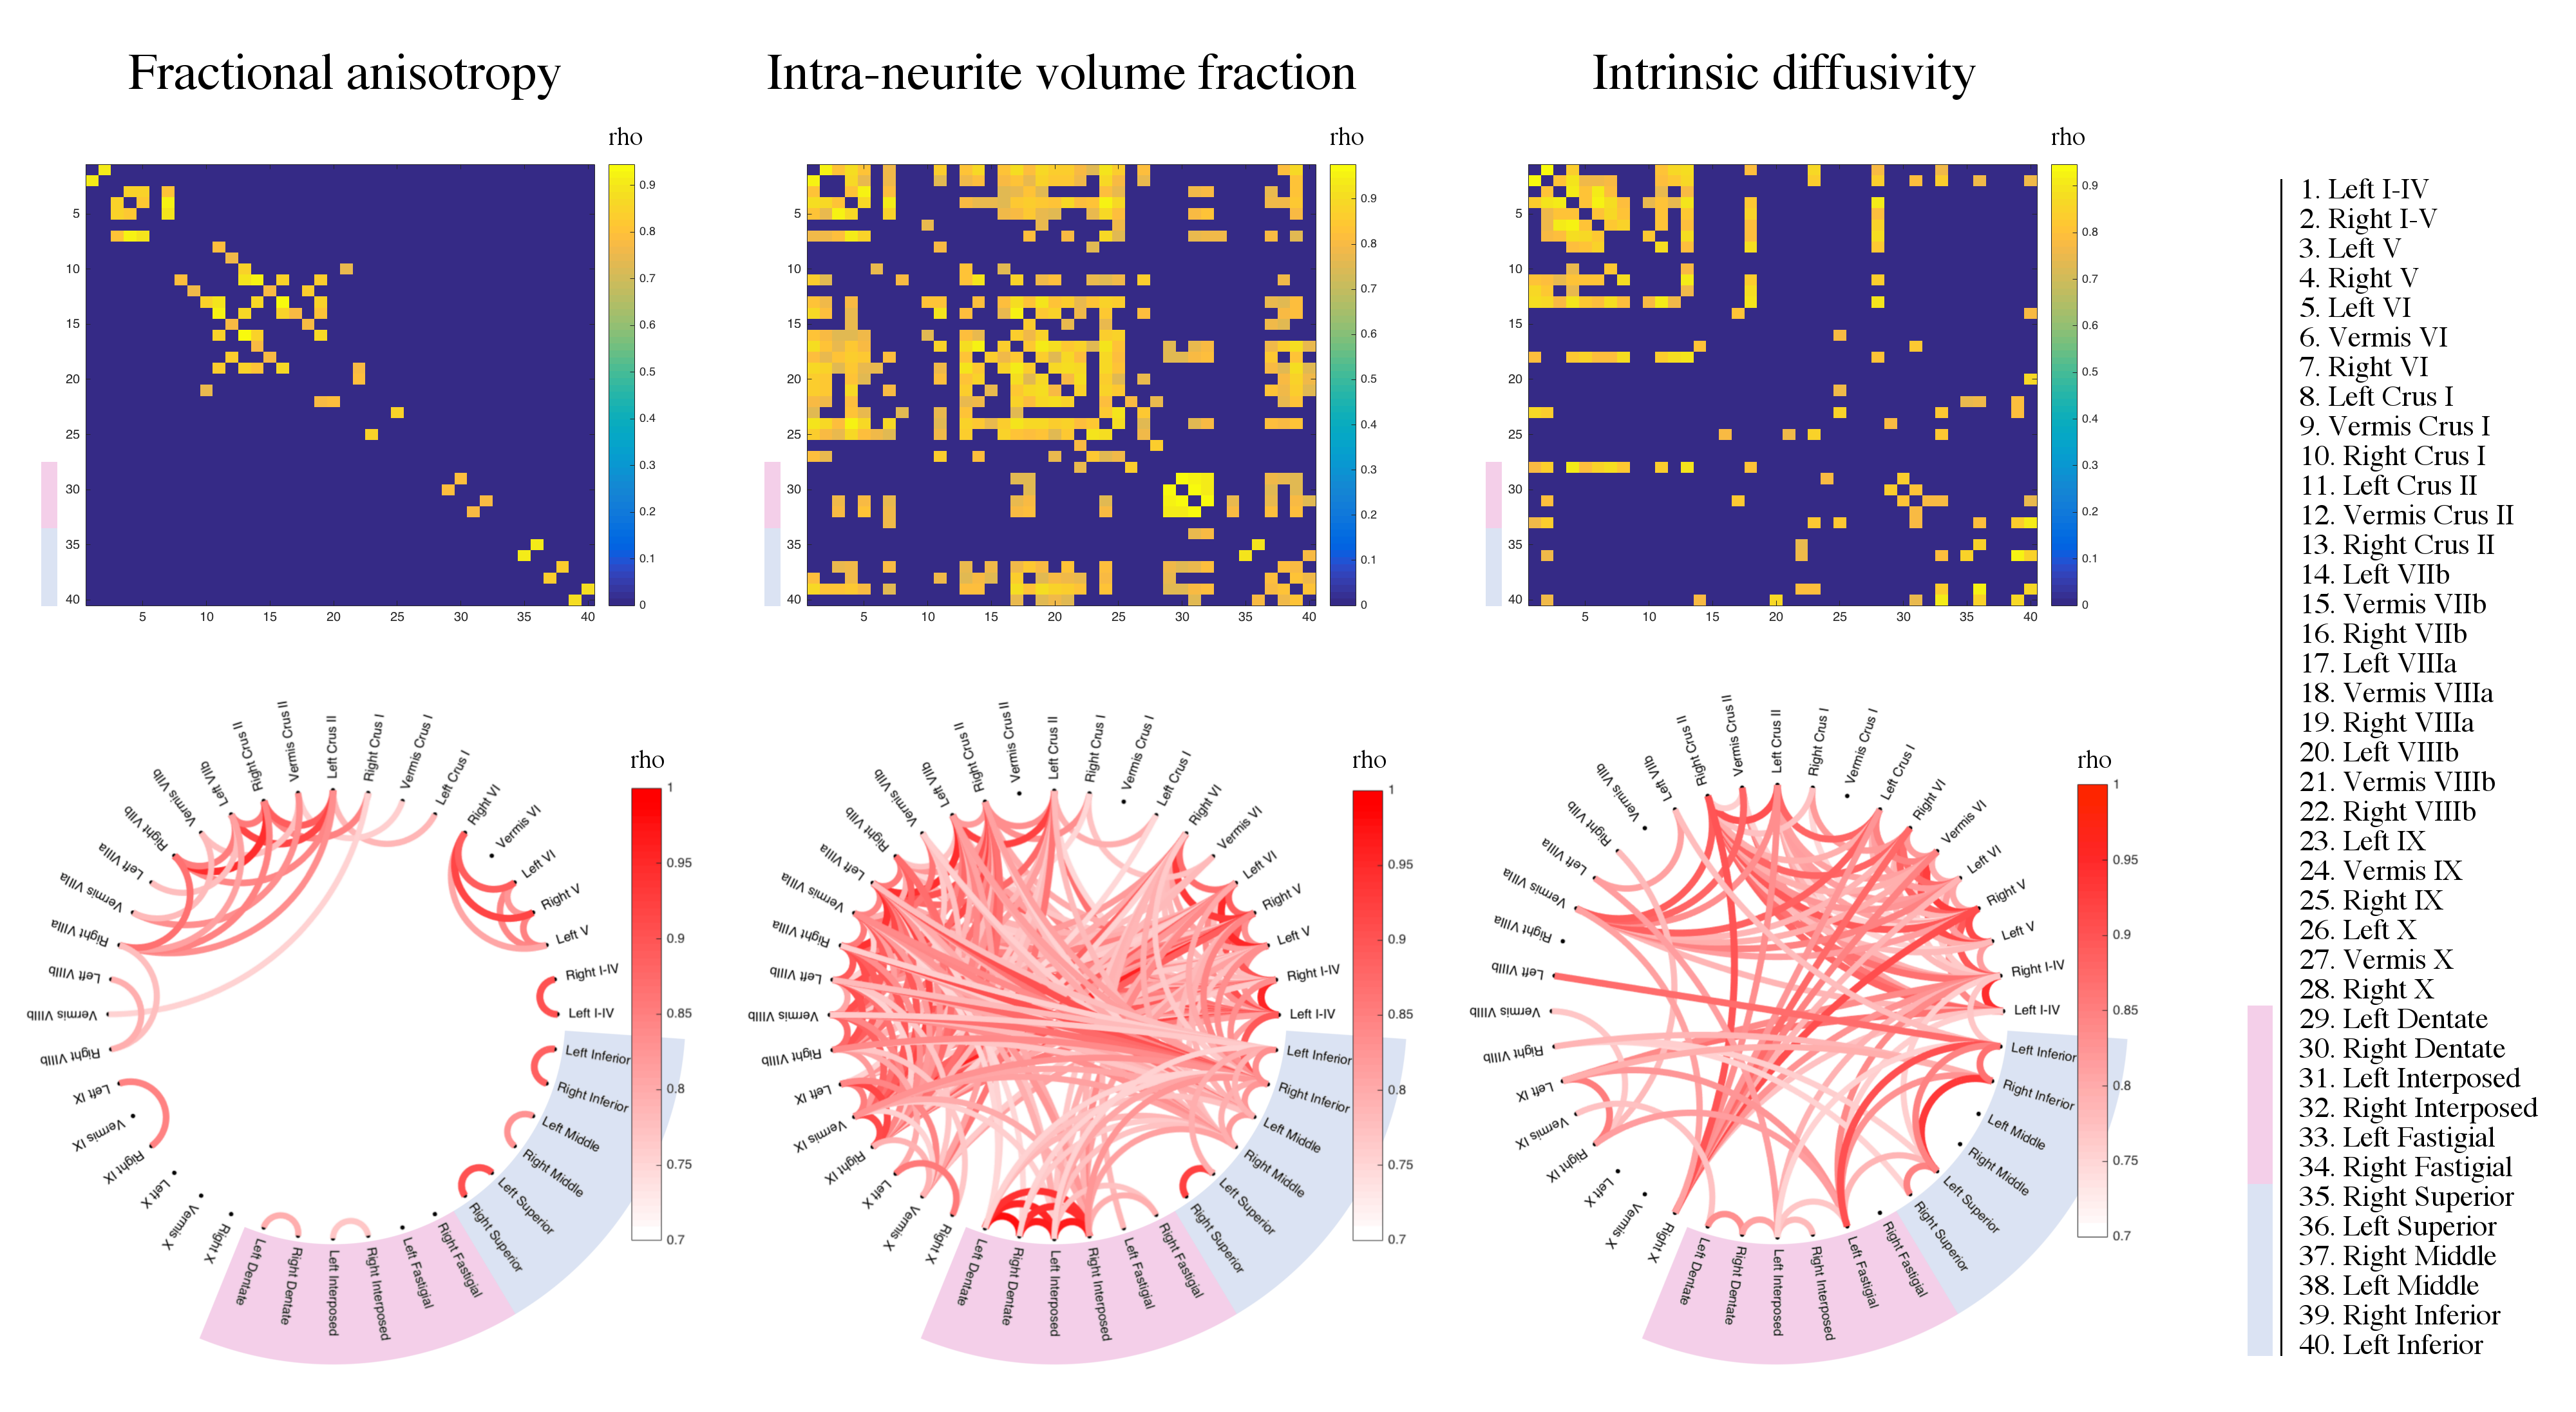
Fractional anisotropy (left) intra-neurite volume fraction (mid) and intrinsic diffusivity (right) between-region correlation across subjects with 75% absolute thresholding.
Top row: between-region cross-correlation symmetric matrices; bottom row: circular graphs of between-region cross-correlation.
In both matrices and circular graphs colour intensity encodes Pearson correlation coefficient.
Deep cerebellar nuclei are pink marked and cerebellar peduncles are light-blue marked.