0711
Volumetric 3D analysis of high grade glioma at pre- and post-radiation therapy by magnetic resonance echo-planar spectroscopic imaging1Department of Electronic Science, Xiamen University, Xiamen, People's Republic of China, 2Department of Radiology and Radiological Science, Johns Hopkins University School of Medicine, Baltimore, MD, United States, 3Department of Radiology, University of Miami, Miami, FL, United States, 4F.M. Kirby Center for Functional Brain Imaging, Kennedy Krieger Institute, Baltimore, MD, United States, 5Department of Radiation Oncology & Molecular Radiation Sciences, Sidney Kimmel Comprehensive Cancer Center, Johns Hopkins University School of Medicine, Baltimore, MD, United States
Synopsis
31 patients with high grade glioma were recruited at both pre- and post-radiation therapy. 3D EPSI was employed on a Siemens 1.5 T scanner. NAA and Cho in lesion are normalized to Cr at contralateral part. At pre-radiation, Cho/Cr at lesion is significantly higher than that in contralateral part (p = 0.003). From pre- to post-radiation, Cho/Cr at lesion is significantly decreased (p < 0.007). Elevated Cho level can be an indicator for residual glioma tumor after surgery. Cho/Cr ratio can be used to monitor the treatment response. EPSI technique can be a promising way to monitor treatment response.
Introduction
High grade glioma is one of prominent malignant brains tumor in adults. Magnetic resonance imaging (MRI) technique can be used for radiation therapy (RT) planning and monitoring. Conventional MRI technique has limitation in charactering tumor infiltration and tissue viability. Magnetic resonance spectroscopy (MRS) technique can identify biochemical patterns associated with normal brain and tumor. It can detect several metabolites in vivo, including choline (Cho) which is a marker of increased cell membrane proliferation. Elevated Cho is an indicator of tumor (1). Here, volumetric 3D magnetic resonance echo planar spectroscopic imaging (EPSI) technique was employed to identify residual tumor location at post-surgery and to monitor the RT treatment response in patients with high grade glioma.Methods and Materials
Total 31 patients with high grade glioma were recruited after tumor surgery. They received radiation therapy (60 Gy) and concurrent temozolomide (TMZ) for 6 weeks, and had magnetic resonance (MR) scans at both pre- and post-RT. 27 patients (15 male, 55.04 ± 14.40 years, mean ± standard deviation) were analyzed at pre-RT stage and 23 patients (13 male, 55.74 ± 14.25 years) were observed from pre- to post-RT. MR scans included 3D T1 weighted MRI and whole brain EPSI scans and were performed on a Siemens 1.5 T ESPREE scanner. Water and lipid suppressed metabolite spin-echo EPSI was performed with TR = 2000 ms, TE = 70 ms, FOV = 280 x 280 x 180 mm3, matrix = 50 x 50 x 12, and nominal voxel size » 0.5 ml. Water reference EPSI data was also acquired. Metabolite Imaging and Data Analysis System (MIDAS) software (2) was employed to process the EPSI data. Based on high Cho signal in MIDAS produced Choline map and abnormality in T1-weighted images, ROIs (region of interest) were selected in the lesion. ROIs in the normal tissue of contralateral hemisphere were also picked for reference. Averaged pre- and post-RT Cho and NAA levels were calculated for both lesion and contralateral hemisphere, and normalized to creatine (Cr) level in contralateral hemisphere (Chol/Crc, Choc/Crc, NAAl/Crc, and NAAc/Crc). Statistical analysis (Student t-test) was performed with metabolite ratios.Results
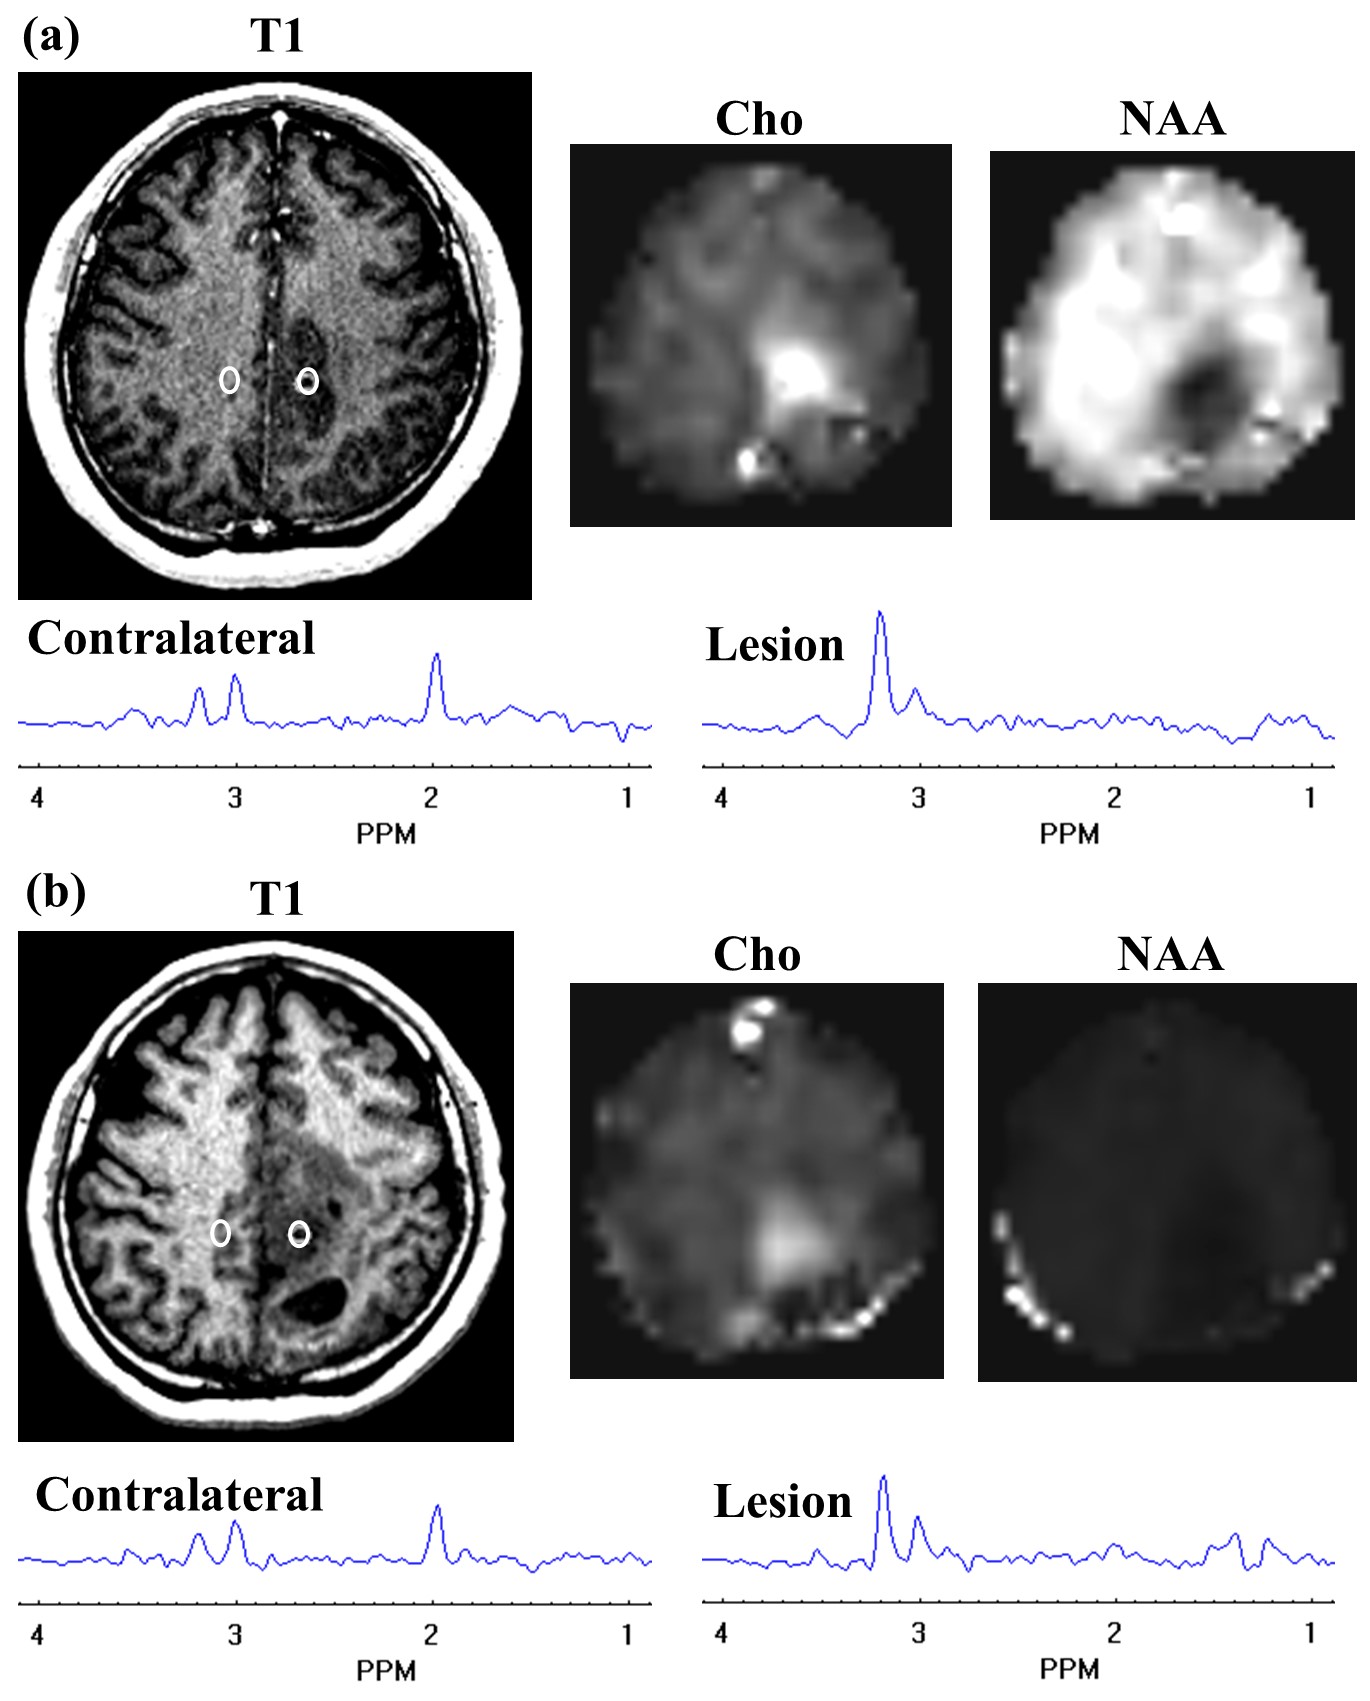
A representative MRSI result from one patient is shown at Fig. 1.Chol/Crc (0.459 ± 0.252, mean ± standard deviation) is significantly larger (p < 0.003) than Choc/Crc (0.301 ± 0.075) in pre-RT scan (27 patients). Mean metabolite ratios (23 patients) and corresponding standard deviations at both pre-RT and post-RT are shown in Fig. 2. Chol/Crc was significantly reduced (p < 0.007) from the pre- (0.466 ± 0.264) to post-RT (0.325 ± 0.159) scans. There is no significant difference between pre- and post-RT for Choc/Crc, and between Chol/Crc and Choc/Crc in post-RT scan. NAAl/Crc is significantly lower (p=0.0000) than NAAc/Crc for both pre- and post-RT scans. There is no significant difference between pre- and post-RT scans for either NAAl/Crc or NAAc/Crc.Discussion
Increased Cho level (and decreased NAA level) in lesion of pre-RT scan suggests that residual tumor can be detected by EPSI technique after surgery and EPSI has the potential as a new way for RT planning (3). A significant reduction in Chol/Crc at post-RT scan suggests that EPSI can be used for monitoring treatment response. Decreased NAAl/Crc compared to NAAc/Crc indicates decreased neuronal integrity in the tumor.Acknowledgements
Yanqin Lin is grateful to the State Scholarship Fund of China (No. 201506315033).References
(1) Horska A, et al. Neuroimag Clin N Am, 20:293, 2010.
(2) Maudsley AA et al. NMR Biomed, 19:492, 2006.
(3) Parra NA, et al. Int J Radiat Oncol Biol Phys, 90:376, 2014.
Figures