0710
Brain volume loss in glioblastoma patients following photon and proton radiochemotherapy1PET center, Institute of Radiopharmaceutical Cancer Research, Helmholtz-Zentrum Dresden-Rossendorf, Dresden, Germany, 2OncoRay – National Center for Radiation Research in Oncology, Faculty of Medicine and University Hospital Carl Gustav Carus, Dresden, Germany, 3Institute of Radiooncology, Helmholtz-Zentrum Dresden-Rossendorf, Dresden, Germany, 4NCT - National Center for Tumor Disease, Dresden, Germany, 5Department of Radiation Oncology, Faculty of Medicine and University Hospital Carl Gustav Carus, Technical University Dresden, Dresden, Germany, 6German Cancer Consortium (DKTK), Dresden, Germany, 7German Cancer Research Center (DKFZ), Heidelberg, Germany, 8Department of Nuclear Medicine, University Hospital Carl Gustav Carus, Technical University Dresden, Dresden, Germany, 9Department of Radiology, University Hospital Carl Gustav Carus, Technical University Dresden, Dresden, Germany
Synopsis
Gray matter (GM) atrophy in healthy brain tissue following radiochemotherapy was shown in brain-tumor patients in several studies. Here, we aimed to study GM and white matter (WM) changes in glioblastoma patients undergoing photon (n=43) and proton (n=12) radiochemotherapy. In photon-therapy patients, a statistically significant decrease of both GM (~2%) and WM (1.3-2.3%) volume was found with a positive influence of the RT-dose on the GM volume loss. In proton-therapy patients, no significant changes in GM and WM volumes were observed after therapy. This indicates that the proton-therapy has the potential to reduce structural GM changes in healthy tissue.
Introduction
Structural changes in healthy brain tissue1 and cognitive deficits2 following radiochemotherapy (RCT) in brain-tumor patients have long been recognized. Loss of gray matter (GM) volume after chemotherapy was shown for both non central-nervous-system tumor patients3, and brain-tumor patients4. Recently, the longitudinal changes on MRI were thoroughly examined using automated segmentation tools in glioblastoma5, and in high-grade glioma6 patients receiving RCT. Progressive GM volume loss and its dependence on radiation (RT) dose was shown. Both studies, however, suffered from small numbers of patients. Our aim was thus to study GM and white matter (WM) changes in healthy brain tissue of glioblastoma patients undergoing RCT in a larger population. We also compared the results between photon- and proton-therapy patients to assess whether proton-therapy reduces the healthy-tissue atrophy.Methods
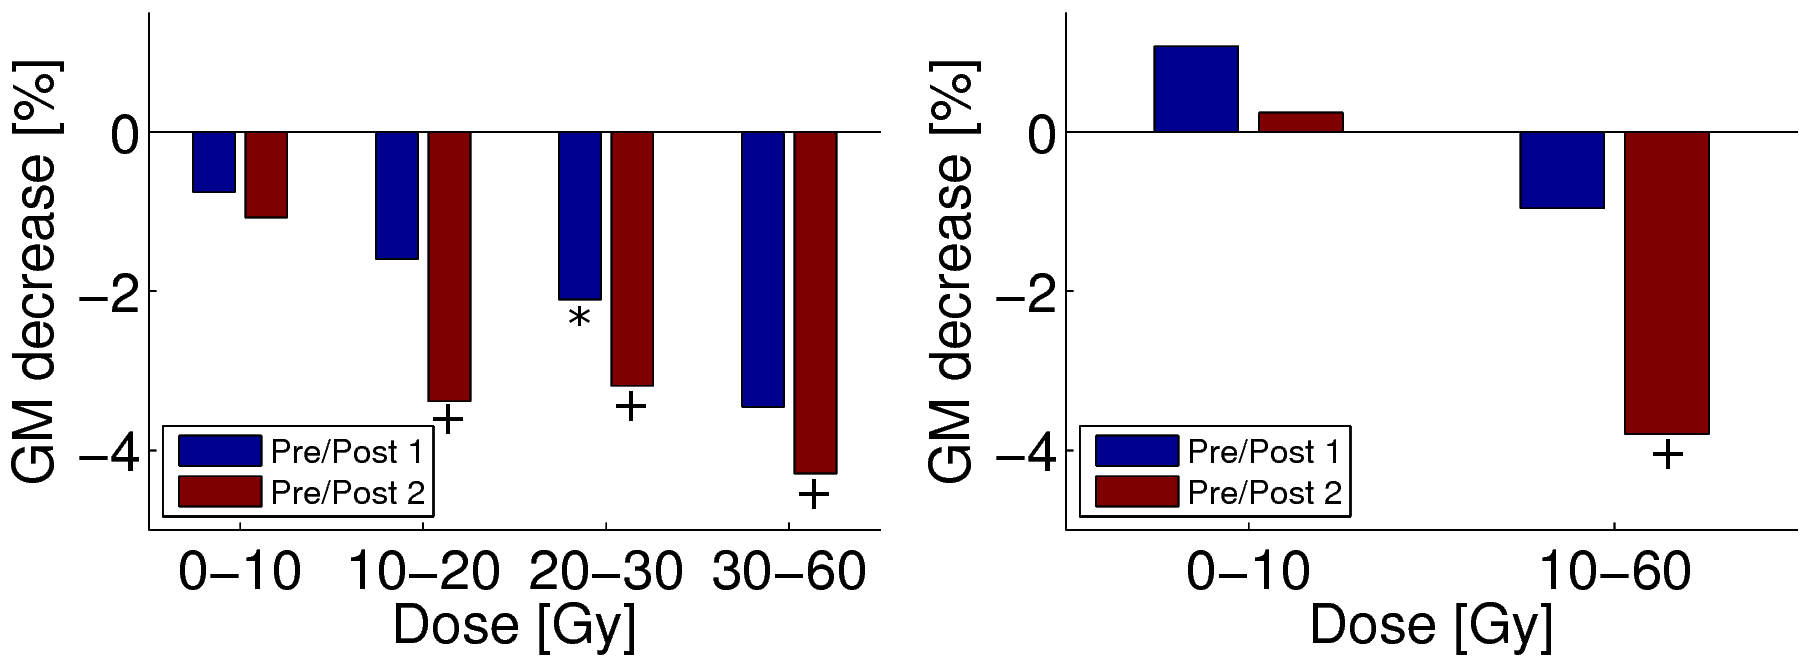
Fifty-five patients with histologically confirmed glioblastoma multiforme, unilateral tumor presence on PET/MRI imaging, and no previous RCT were studied. Fractionated radiotherapy with a total dose 60 Gy (2 Gy fractions 5 days/week) and concomitant Temozolomide chemotherapy (75 mg/m2) plus 6 months of adjuvant Temozolomide (150 mg/m2) was delivered to all patients7. Intensity modulated radiation therapy with photon beams was applied in 43 patients (mean age 55.2±13.9 years), and therapy with proton beams was applied in 12 patients (mean age 55.5±15.3 years). MRI measurements were performed with a 3T Philips Ingenuity TF PET/MR scanner with an 8-channel head-coil. 3D-TFE (Turbo Field Echo) T1-weighted images were obtained in the sagittal orientation with 1 mm isotropic resolution. First imaging (Pre-RCT) was performed after tumor resection and before the RCT start. The second and third sessions were performed in 3-months intervals after the end of the RCT. Data were processed using SPM12 toolbox (Wellcome Trust Centre for Neuroimaging) and in-house routines written in Matlab (MathWorks). The T1-w images were segmented to GM, WM, and cerebro-spinal fluid maps. The planning CT and associated RT-dose plans were co-registered with the T1-w images for each session. Inter-session GM and WM volume changes were evaluated in the unaffected hemisphere contralateral to the tumor. The GM volume changes were also assessed regionally according to received RT-dose (using the subdivisions 0-10-20-30-60 Gy and 0-10-60 Gy for the photon- and proton-therapy patients, respectively).Results
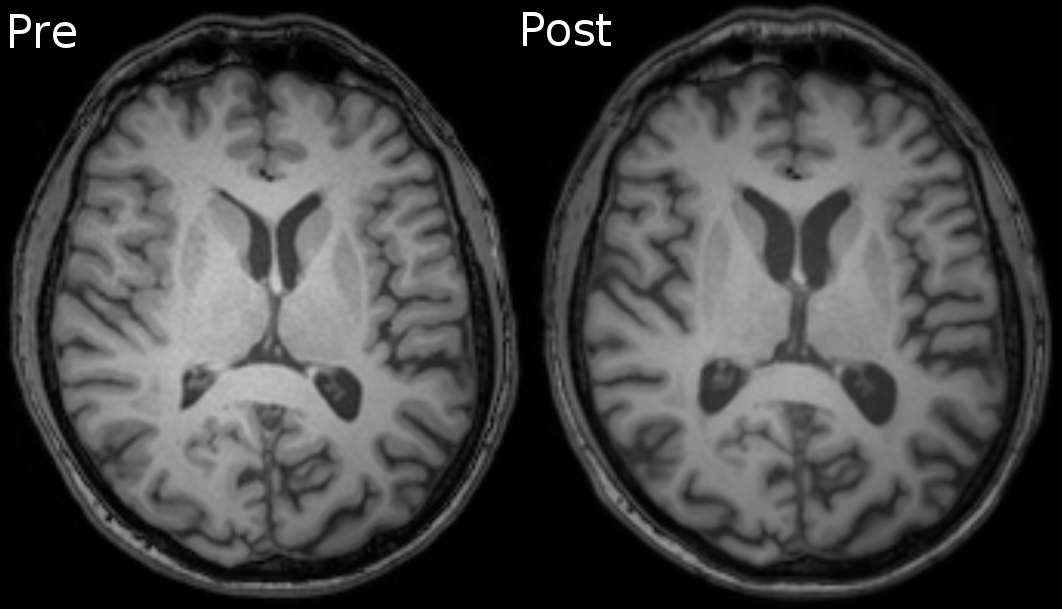
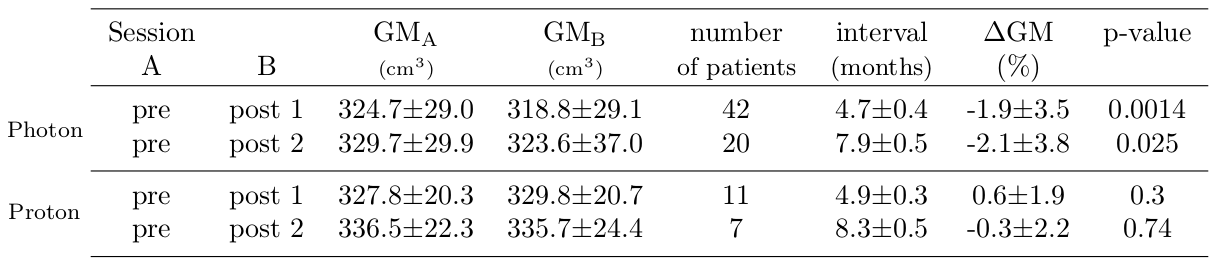
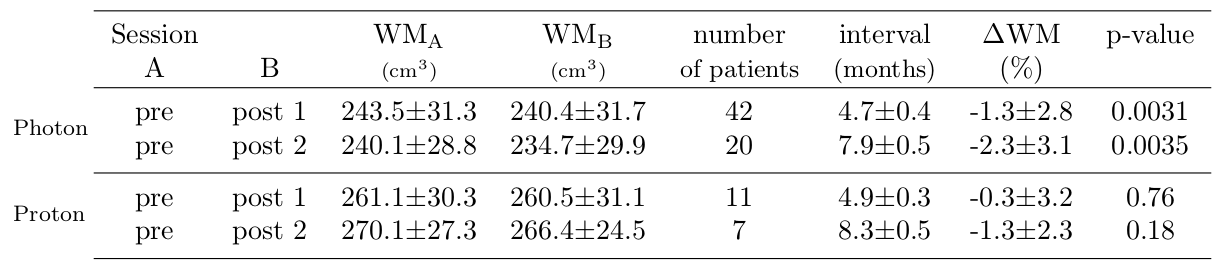
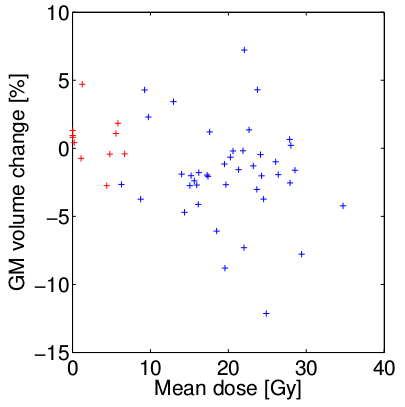
Signs of brain atrophy were observed in most photon-therapy patients, see Figure 1. In photon-therapy patients, significant decrease of both GM (~2%) and WM (1.3-2.3%) volume was found, see Tables 1 and 2. On the contrary in proton-therapy patients, no significant global changes in GM and WM volumes were observed. For photon-therapy patients, GM volume loss in high RT-dose regions was 3-4 fold higher than in the low RT-dose regions, see Figure 2. The effect of GM volume loss was heterogeneous across patients with range between +5 and -10% for most of the patients, see Figure 3.Discussion and conclusions
We have shown a GM volume loss after RCT that is higher than what is attributable to healthy aging (0.3-0.4% per year8,9). The results were in concordance with the results by Prust5 with the same type of patients and treatment, although, we have observed smaller decreases (1.9-2.1% compared with ~3-4% by Prust et al.). The current study, however, used a larger patient group (42 compared with 8) and we excluded patients with bilateral tumor presence where changes in the vicinity of the tumor could be mistaken for GM loss. Contrary to results by Prust, we have observed significant loss in WM volume. Our findings confirm those of Karunamuni6 that higher RT-dose increases the level of GM atrophy. In proton-therapy patients, no significant changes in GM and WM (except for GM volume loss on second post-RCT sessions in high-dose regions) were observed. This, however, needs to be confirmed in a larger group. Accuracy of the GM volume estimation is influenced by errors in segmentation, co-registration, and hydration status (10% difference in ventrical volume measured on MRI was reported between dehydration and hyperhydration10). We assume that this does on average not affect the results, however, it can explain individual measured increase in GM volume. Decrease of atrophy level with lower RT-dose in both photon- and proton-therapy patients, and minor structural changes in proton-therapy patients in general indicate that brain atrophy in RCT patients is mainly dose-dependent. The slight trend of atrophy progress in time and volume loss in low RT-dose regions of photon-therapy patients might be attributed to low doses of chemotherapy crossing the blood-brain barrier in healthy tissue causing DNA damage or cumulative effect of chemo- and radio-therapy. To confirm this, we plan to include more proton-therapy patients and investigate atrophy in latter sessions as well.Acknowledgements
M.K. and J. vdH. contributed equally to this work.References
1. Constine L, Konski A, Ekholm S, McDonald S, Rubin P. Adverse effects of brain irradiation correlated with MR and CT imaging. International Journal of Radiation Oncology*Biology*Physics. 1988; 15(2):319–330.
2. Douw, L., Klein, M., Fagel, S. S., van den Heuvel, J., Taphoorn, M. J., Aaronson, N. K., … Heimans, J. J. Cognitive and radiological effects of radiotherapy in patients with low-grade glioma: long-term follow-up. The Lancet Neurology. 2009; 8(9):810–8.
3. Inagaki M, Yoshikawa E, Matsuoka Y, et al. Smaller regional volumes of brain gray and white matter demonstrated in breast cancer survivors exposed to adjuvant chemotherapy. Cancer. 2007; 109:146–156.
4. Shibamoto, Y., Baba, F., Oda, K., Hayashi, S., Kokubo, M., Ishihara, S. I., … Koizumi, M. Incidence of Brain Atrophy and Decline in Mini-Mental State Examination Score After Whole-Brain Radiotherapy in Patients With Brain Metastases: A Prospective Study. International Journal of Radiation Oncology Biology Physics. 2008; 72(4):1168–1173.
5. Prust, M. J., Jafari-Khouzani, K., Kalpathy-Cramer, J., Polaskova, P., Batchelor, T. T., Gerstner, E. R., & Dietrich, J. Standard chemoradiation for glioblastoma results in progressive brain volume loss. Neurology. 2015; 85(8):683–691.
6. Karunamuni, R. A., Moore, K. L., Seibert, T. M., Li, N., White, N. S., Bartsch, H., … Hattangadi-Gluth, J. A. Radiation sparing of cerebral cortex in brain tumor patients using quantitative neuroimaging. Radiotherapy and Oncology. 2016; 118(1):29–34.
7. Stupp R, Mason WP, Van Den Bent MJ, Weller M, Fisher B, Taphoorn MJ, Belanger K, Brandes AA, Marosi C, Bogdahn U, et al. Radiotherapy plus concomitant and adjuvant temozolomide for glioblastoma. New Engl J Med. 2005; 352(10):987-996.
8. Catriona D. Good, Ingrid S. Johnsrude, John Ashburner, Richard N.A. Henson, Karl J. Friston, Richard S.J. Frackowiak, A Voxel-Based Morphometric Study of Ageing in 465 Normal Adult Human Brains. NeuroImage. 2001; 14(1):21-36.
9. Hutton, C., Draganski, B., Ashburner, J., & Weiskopf, N. A comparison between voxel-based cortical thickness and voxel-based morphometry in normal aging. NeuroImage 2009; 48(2):371–380.
10. Streitbürger D-P, Möller HE, Tittgemeyer M, Hund-Georgiadis M, Schroeter ML, Mueller K. Investigating Structural Brain Changes of Dehydration Using Voxel-Based Morphometry. PLoS ONE. 2012; 7(8):e44195.
Figures