0709
Improvement in Diagnostic Accuracy and Reliability of Pharmacokinetic Parameters from DCE MR Imaging by using Arterial Input Function Obtained from DSC MR imaging: Differentiation of High Grade Glioma from Low Grade Glioma.Sung-Hye You1 and Seung Hong Choi1
1Department of Radiology, Seoul National University Hospital, Seoul, Korea, Republic of
Synopsis
The aim of this study was to compare two AIFs derived from DCE (AIFDCE) and DSC MR imaging (AIFDSC) in terms of the diagnostic accuracy and reliability of pharmacokinetic parameters from DCE MRI for differentiation of high grade from low grade glioma. This retrospective study included 70 patients with pathologically confirmed gliomas. In all of the patients, we performed preoperative DSC and DCE MRI, and two AIFs (AIFDSC and AIFDCE) were obtained from each image. Pharmacokinetic parameters (Ktrans, Vp, and Ve) were processed. DCE MRI parameters obtained using AIFDSC showed better accuracy and reliability than those derived from AIFDCE.
Purpose:
It has been well demonstrated that the accuracy and reliability of pharmacokinetic parameters from dynamic contrast-enhanced (DCE) magnetic resonance (MR) imaging are affected by arterial input function (AIF).1-4 However, the most optimal method to obtain AIF has not yet been fully determined. The aim of the present study was to compare two AIFs derived from DCE (AIFDCE) and dynamic susceptibility-contrast (DSC) MR imaging (AIFDSC) in terms of the diagnostic accuracy and reliability of pharmacokinetic parameters from DCE MR imaging for differentiation of high grade from low grade glioma.Methods:
This retrospective study included 70 patients (39 men, 31 women; mean age, 45.3 years; age range, 28–79 years) with pathologically confirmed gliomas (World Health Organization grade II, n=21; grade III, n=16; grade IV, n=33). In all of the patients, we performed DSC and DCE MR imaging before operation, and two AIFs (AIFDSC and AIFDCE) were obtained from each image. Pharmacokinetic parameters from DCE MRI using both AIFDSC and AIFDCE, including Ktrans, Vp, and Ve, were processed by using a dedicated post-processing software (Nordic ICE; Nordic NeuroLab, Bergen, Norway). The diagnostic accuracies of individual parameters to differentiate high grade from low grade glioma were compared using Receiver operating characteristic (ROC) curve analysis. To compare the intra-observer reliability, those parameters were re-measured with same method, and the result of that were analyzed using intra-class correlation coefficient (ICC) and Bland-Altman analysis.Results:
The mean Ktrans and Ve measured by using AIFDSC were more accurate to differentiate high grade glioma than AIFDCE (AUC; mean Ktrans, 0.855 (0.751, 0.928) and 0.636 (0.512, 0.747) for AIFDSC and AIFDCE, respectively, P<.001; mean Ve, 0.840 (0.732, 0.916) and 0.635 (0.511, 0747) for AIFDSC and AIFDCE, respectively, P<.001). All of the three parameters, Ktrans, Vp, and Ve, showed better ICC using AIFDSC than that from AIFDCE (Ktrans, 0.946 and 0.164; Vp, 0.974 and 0.831; Ve, 0.913 and 0.744 for AIFDSC and AIFDCE, respectively).Conclusion:
DCE MR imaging parameters obtained using AIFDSC showed better accuracy and reliability for differentiating high grade glioma from low grade glioma than those derived from AIFDCE. We believe that this new method using AIFDSC to process pharmacokinetic parameters from DCE MR imaging can be an alternative to improve clinical applications of DCE MR imaging.Acknowledgements
No acknowledgement found.References
1. Simonis FF, Sbrizzi A, Beld E, Lagendijk JJ, van den Berg CA. Improving the arterial input function in dynamic contrast enhanced MRI by fitting the signal in the complex plane. Magnetic resonance in medicine 2016; 76:1236-1245. 2. Filice S, Crisi G. Dynamic Contrast-Enhanced Perfusion MRI of High Grade Brain Gliomas Obtained with Arterial or Venous Waveform Input Function. Journal of Neuroimaging 2016; 26:124-129. 3. Sanz-Requena R, Prats-Montalbán JM, Martí-Bonmatí L, Alberich-Bayarri Á, García-Martí G, Pérez R, et al. Automatic individual arterial input functions calculated from PCA outperform manual and population-averaged approaches for the pharmacokinetic modeling of DCE-MR images. Journal of Magnetic Resonance Imaging 2015; 42:477-487. 4. Othman AE, Falkner F, Kessler D-E, Martirosian P, Weiss J, Kruck S, et al. Comparison of different population-averaged arterial-input-functions in dynamic contrast-enhanced MRI of the prostate: Effects on pharmacokinetic parameters and their diagnostic performance. Magnetic resonance imaging 2015; 34: 496-501.Figures
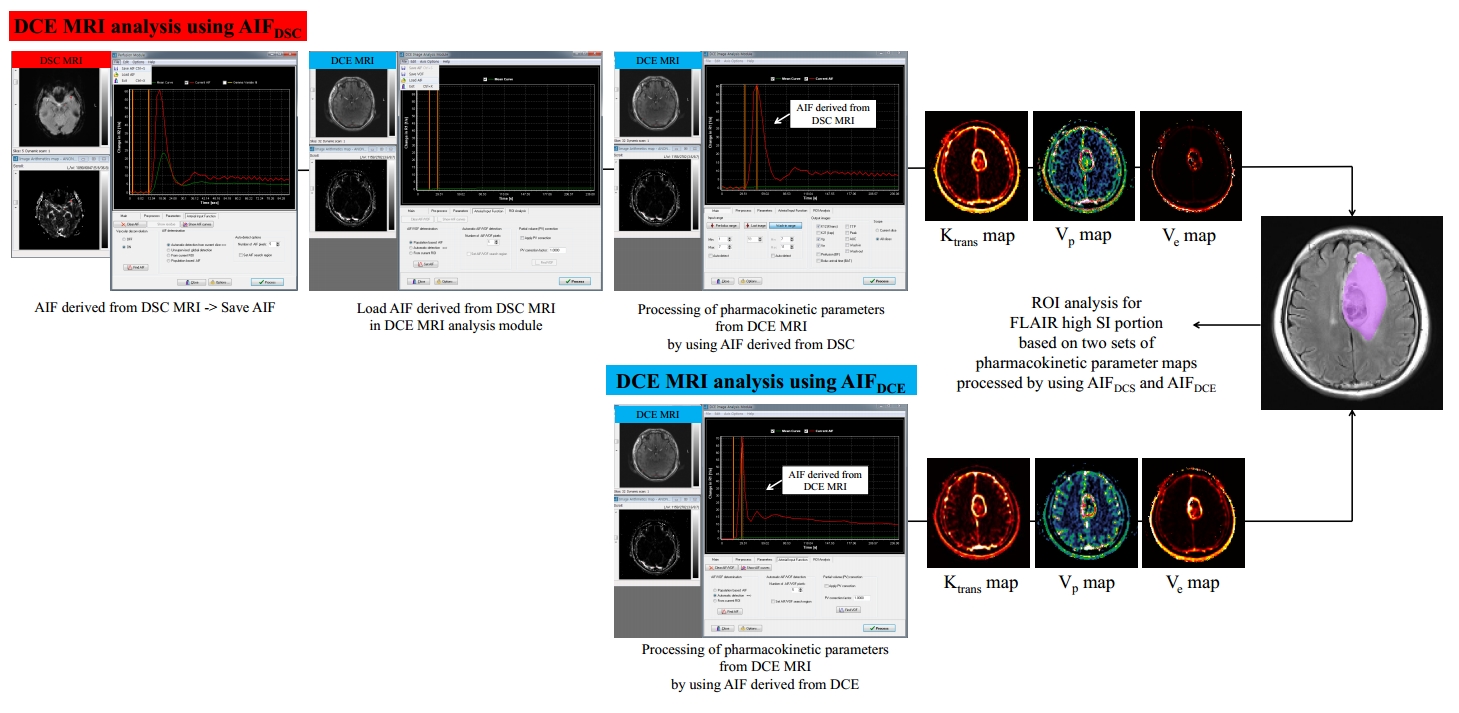
Figure 1. A demonstration of AIFDSC, AIFDCE,
and DCE MRI pharmacokinetic parameters acquisition, AIF=arterial input function,
DSC=dynamic susceptibility contrast, DCE=dynamic contrast enhanced, AIFDSC=AIF derived from DSC MRI, AIFDCE=AIF
derived from DCE MRI
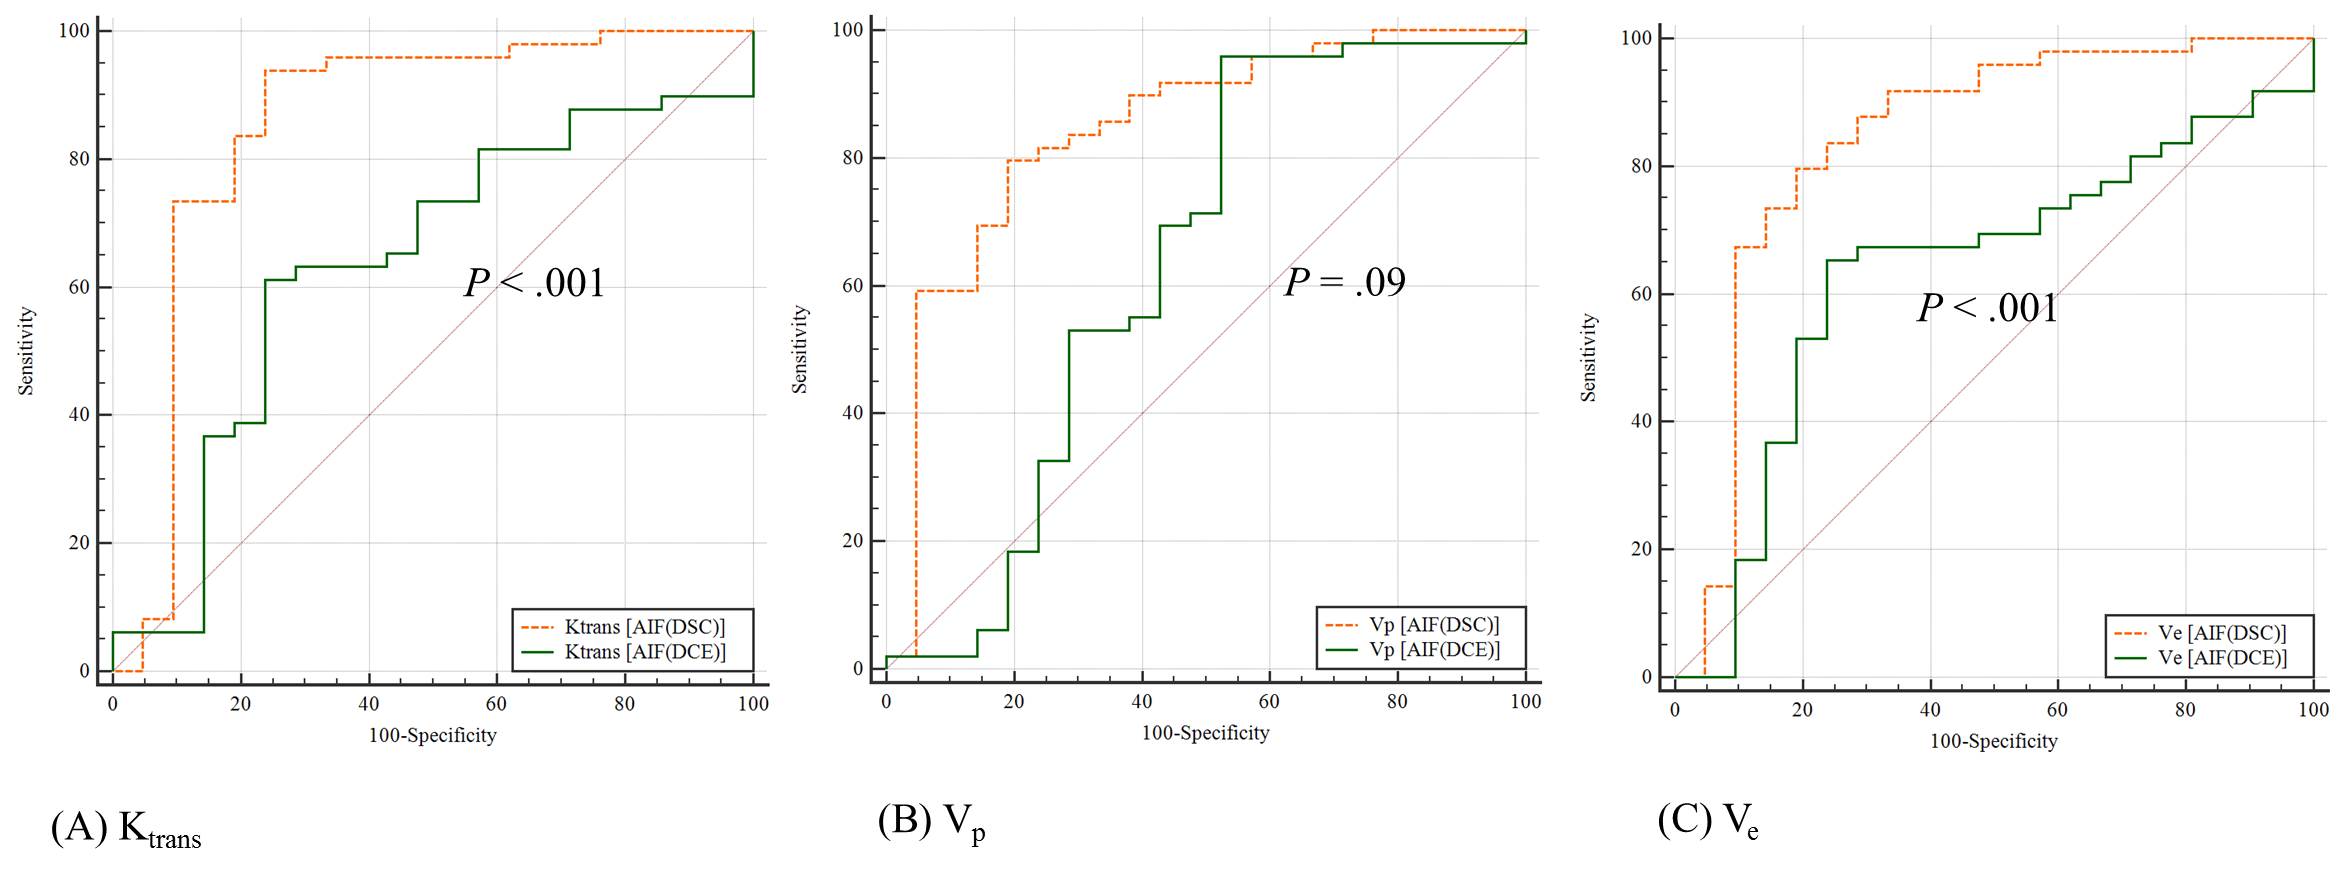
Figure 2. The receiver operating
characteristic curves to use two AIFDSC and AIFDCE for
differentiating high grade glioma from low grade glioma, (A) AUC of mean Ktrans,
0.855 (0.751, 0.928) and 0.636 (0.512, 0.747) for AIFDSC and AIFDCE,
respectively, P<.001 (B) AUC of Vp, 0.845 (0.738,
0.920) and 0.637 (0.513, 0.748) for AIFDSC and AIFDCE,
respectively, P=.09, (C) AUC of Ve,
0.840 (0.732, 0.916) and 0.635 (0.511, 0747) for AIFDSC and AIFDCE,
respectively, P<.001. AIF=arterial
input function, DSC=dynamic susceptibility contrast, DCE=dynamic contrast
enhanced, AIFDSC=AIF derived from DSC MRI, AIFDCE=AIF
derived from DCE MRI.
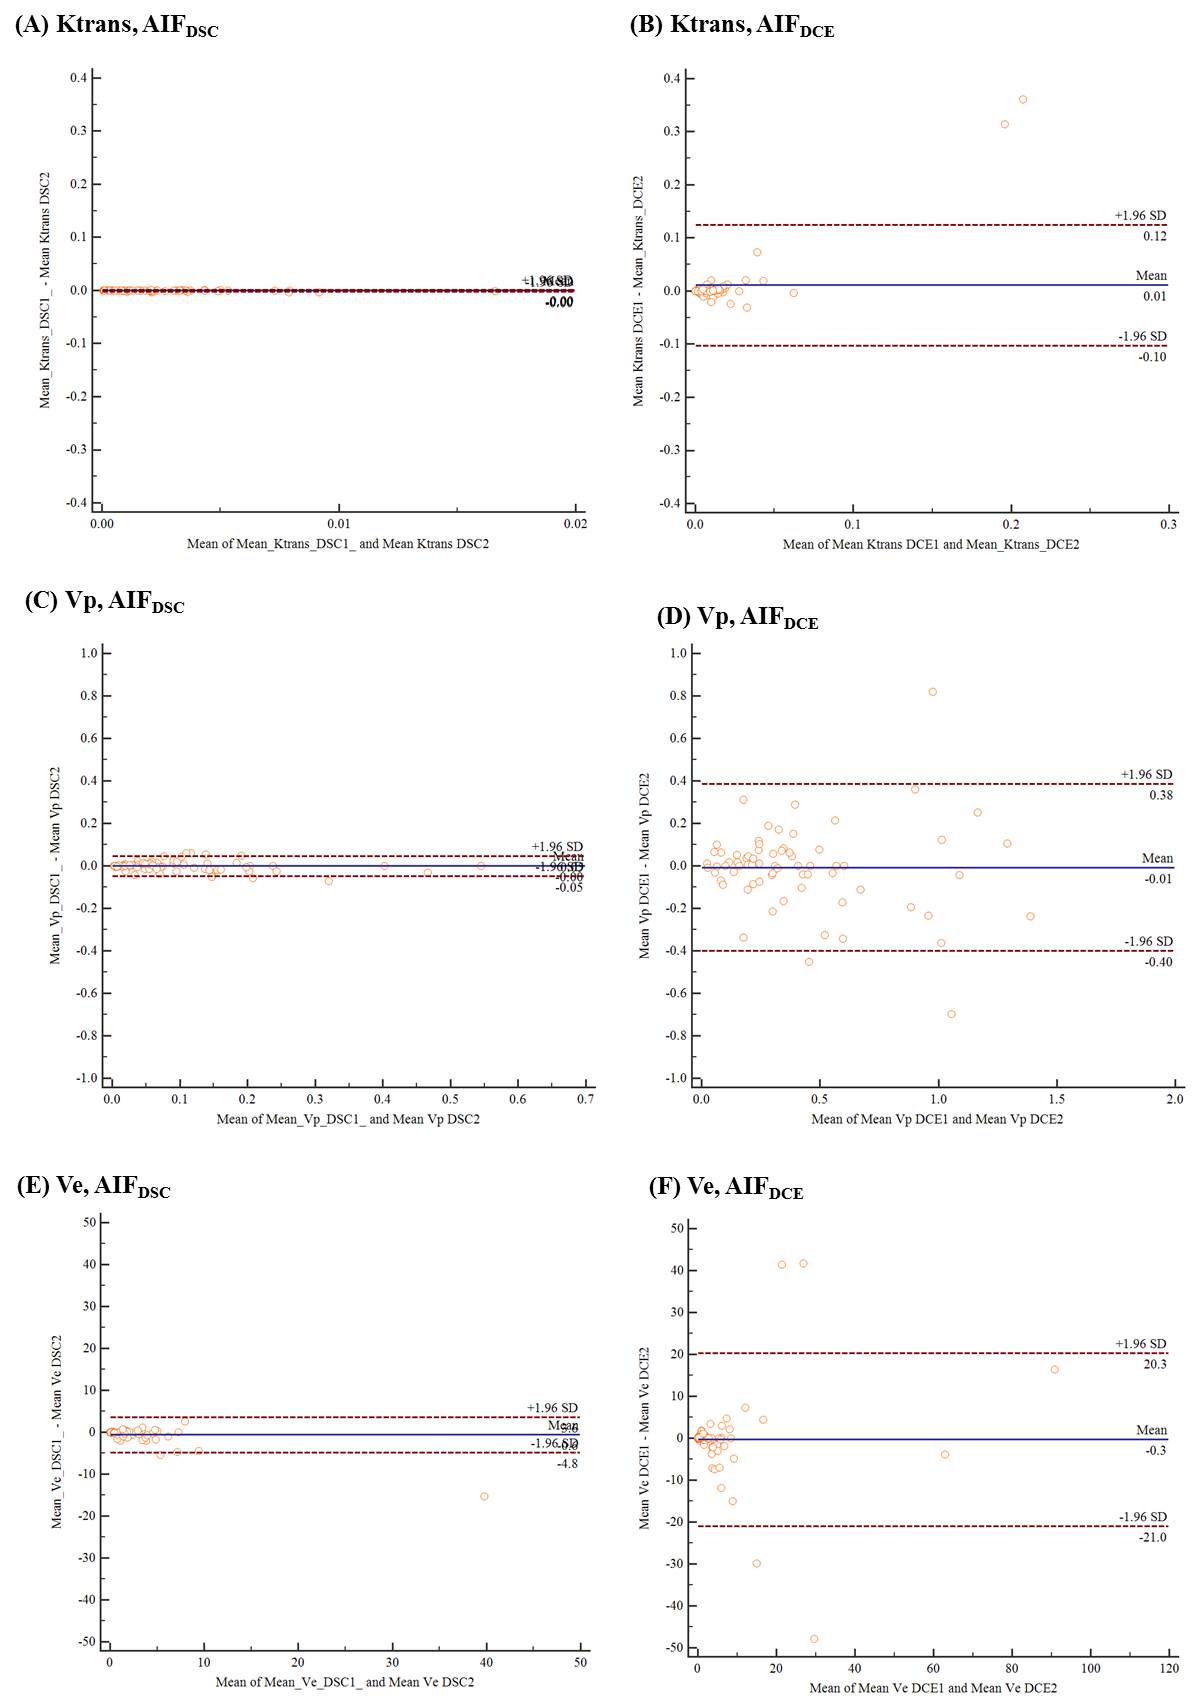
Figure 3. Bland-Altman plots show
intraobsertver agreement for the pharmacokinetic parameters between two
measurements. Intraoberver agreements for Ktrans, Vp, and
Ve processed using AIFDSC were better than those from AIFDCE,
AIF=arterial input function, AIFDSC=AIF derived from DSC MRI, AIFDCE=AIF derived from DCE MRI